Automotive Steel Market Size - Global Industry, Share, Analysis, Trends and Forecast 2024 - 2032
Published :
Report ID:
Pages :
Format :
Automotive Steel Market Size - Global Industry, Share, Analysis, Trends and Forecast 2024 - 2032
Report Coverage
- Industry Dynamics
- Market Size and Forecast Data
- Segment Analysis
- Competitive Landscape
- Regional Analysis with a Niche Focus on Country-Level Data
- High Level Analysis - Porter's, PESTEL, Value Chain, etc.
- Company Profiles of Key Players
- Option to Customize the Report As Per Your Specific Need
Request Sample Report
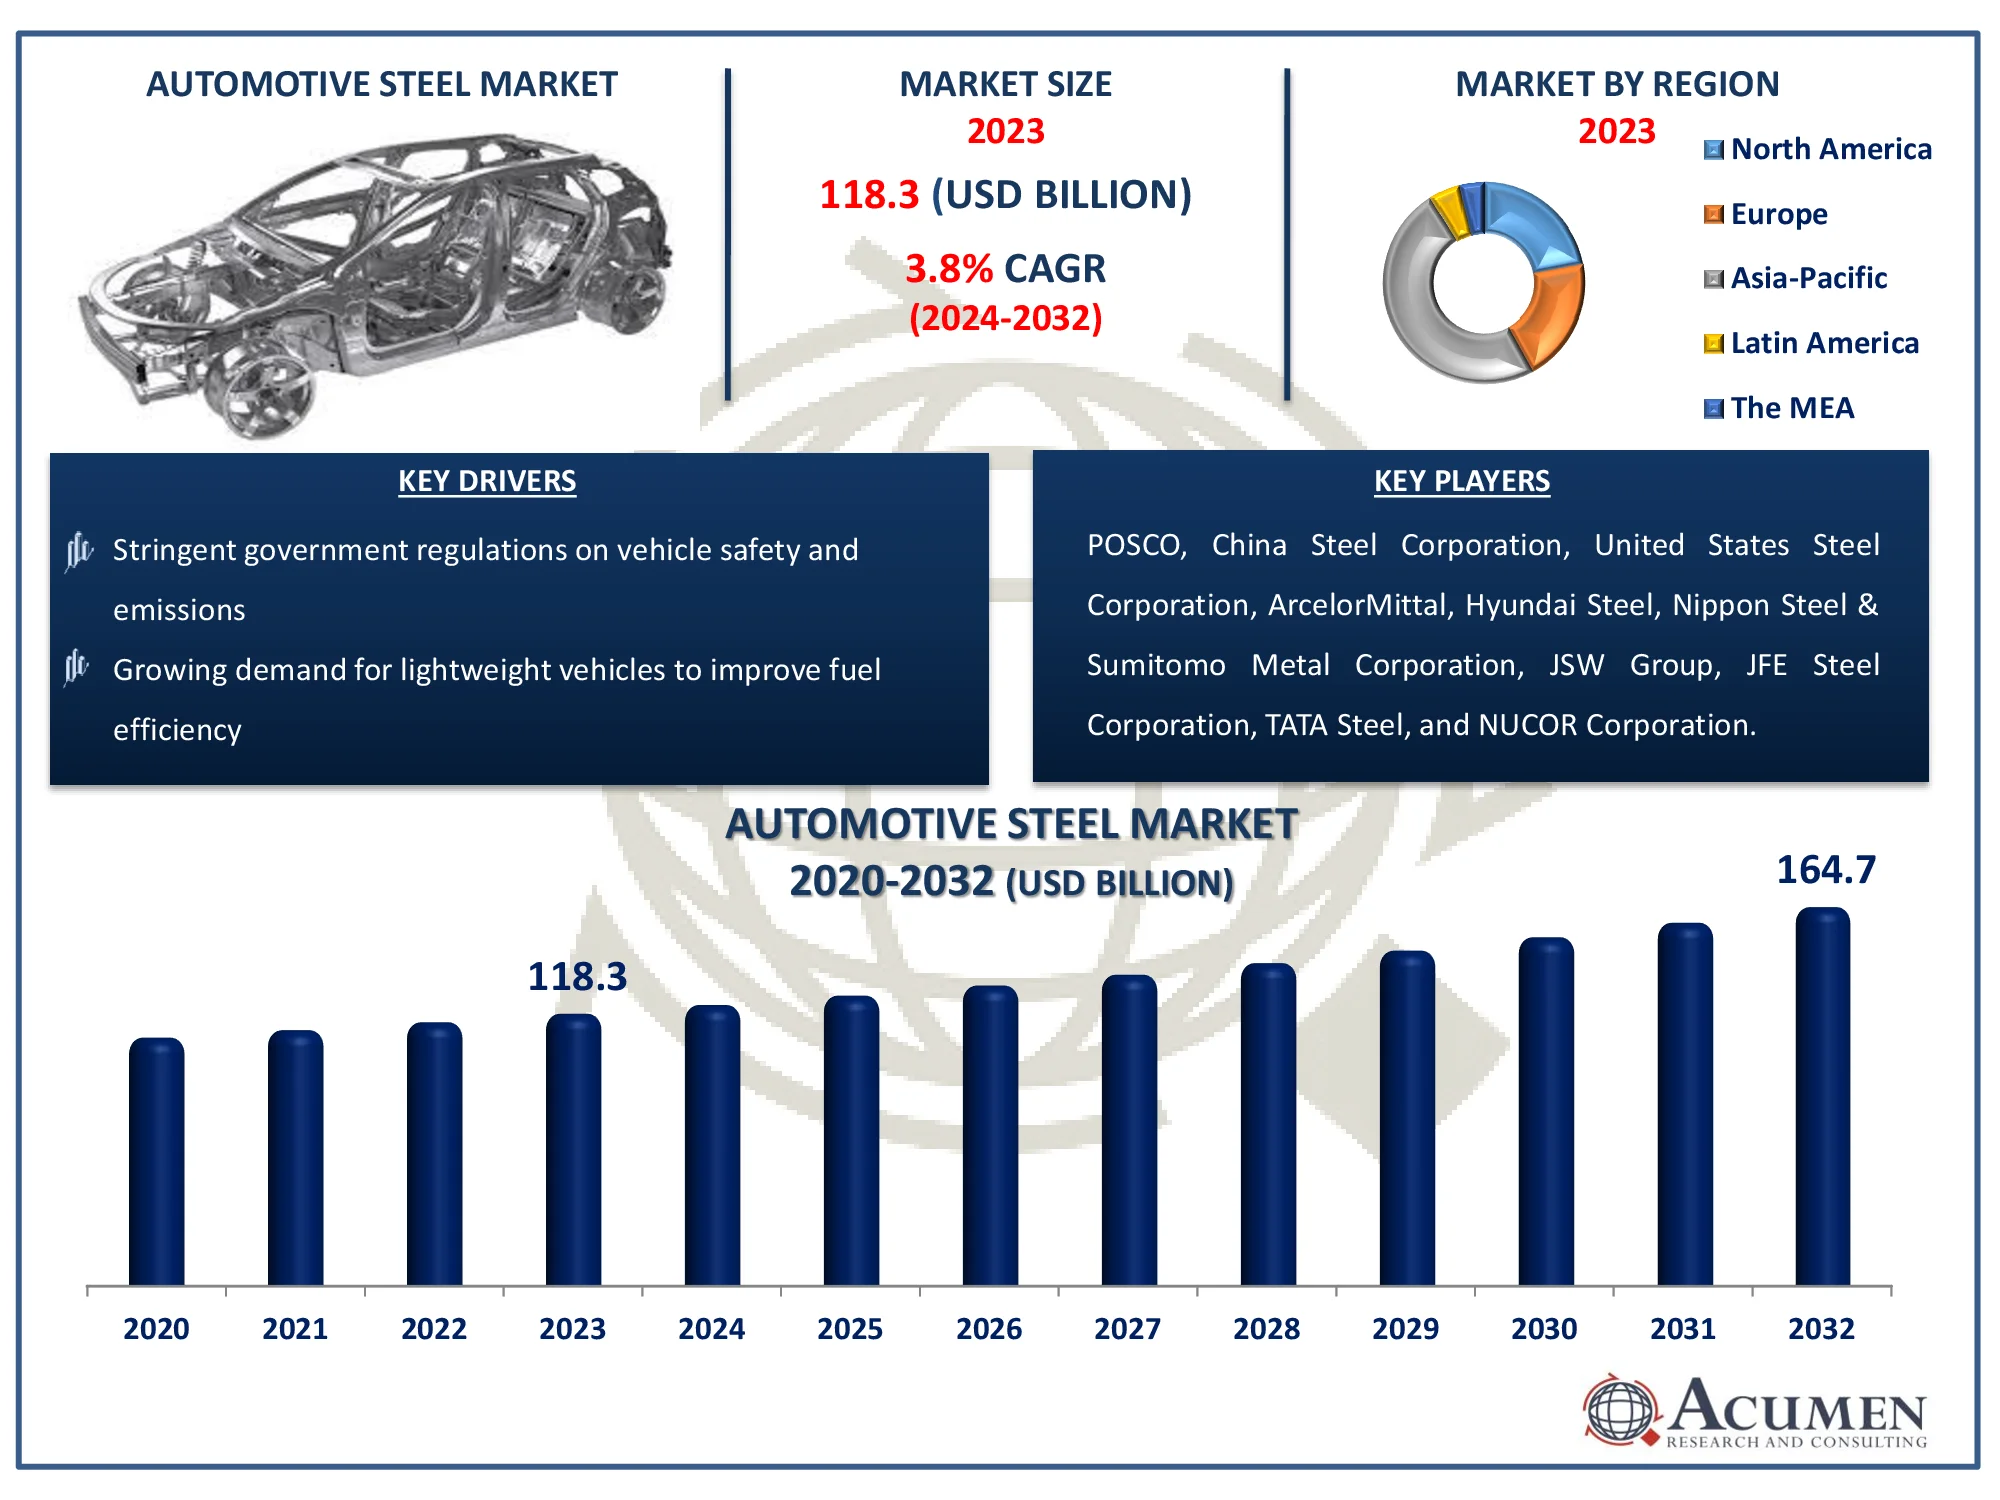
The Global Automotive Steel Market Size accounted for USD 118.3 Billion in 2023 and is estimated to achieve a market size of USD 164.7 Billion by 2032 growing at a CAGR of 3.8% from 2024 to 2032.
Automotive Steel Market Highlights
- Global automotive steel market revenue is poised to garner USD 164.7 billion by 2032 with a CAGR of 3.8% from 2024 to 2032
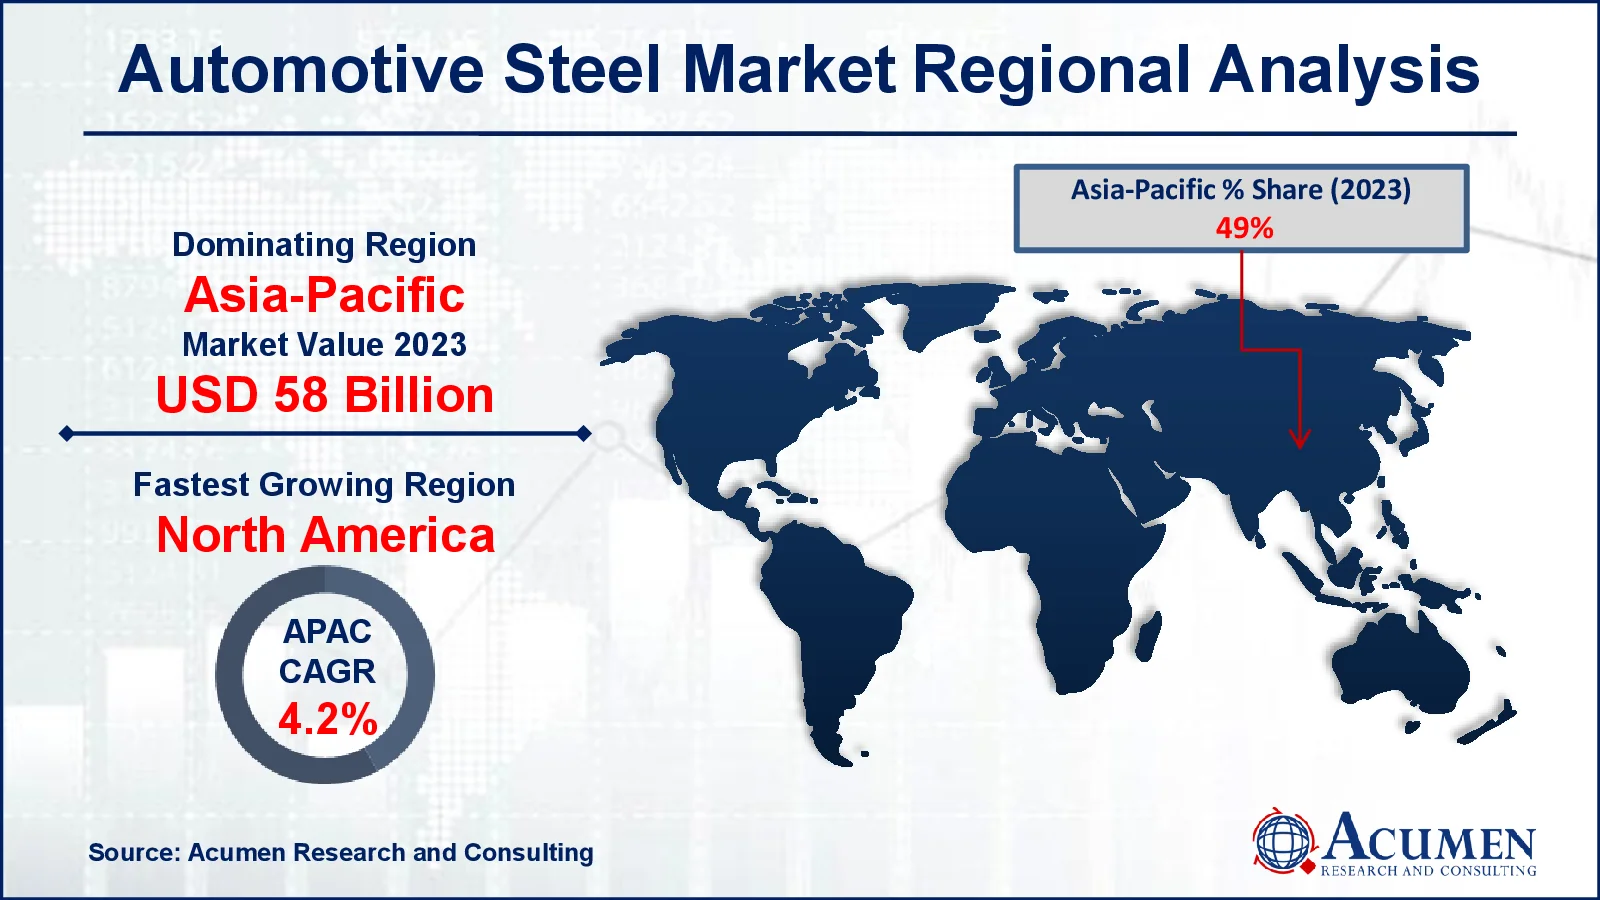
- Asia-Pacific automotive steel market value occupied around USD 58 billion in 2023
- North America automotive steel market growth will record a CAGR of more than 4.2% from 2024 to 2032
- Among vehicle type, the passenger vehicles sub-segment generated more than USD 82.8 billion revenue in 2023
- Based on application, the body structure sub-segment generated around 39% market share in 2023
- Growing vehicle electrification and autonomous driving systems is a popular automotive steel market trend that fuels the industry demand

Automotive steel is a type of steel specifically developed for manufacturing vehicles. It includes various grades and types, such as advanced high-strength steels (AHSS), which offer a combination of strength, ductility, and formability. These properties are essential for ensuring vehicle safety, performance, and fuel efficiency. AHSS is widely used in structural components, safety features like crash zones, and parts requiring high durability. The use of automotive steel helps in reducing vehicle weight without compromising strength, leading to better fuel economy and lower emissions. Additionally, automotive steel is often treated with coatings to enhance its resistance to corrosion and wear, ensuring long-term durability and reliability. This material plays a critical role in modern automotive design and manufacturing, contributing to both vehicle safety and environmental sustainability.
Global Automotive Steel Market Dynamics
Market Drivers
- Growing demand for lightweight vehicles to improve fuel efficiency
- Increasing automotive production globally
- Advancements in high-strength steel technologies
- Stringent government regulations on vehicle safety and emissions
Market Restraints
- Volatility in raw material prices
- Competition from alternative materials like aluminum and composites
- High cost of advanced steel grades
Market Opportunities
- Rising adoption of electric vehicles
- Increasing demand for passenger safety enhancements
- Development of new steel alloys with improved properties
Automotive Steel Market Report Coverage
|
Market |
Automotive Steel Market |
|
Automotive Steel Market Size 2023 |
USD 118.3 Billion |
|
Automotive Steel Market Forecast 2032 |
USD 164.7 Billion |
|
Automotive Steel Market CAGR During 2024 - 2032 |
3.8% |
|
Automotive Steel Market Analysis Period |
2020 - 2032 |
|
Automotive Steel Market Base Year |
2023 |
|
Automotive Steel Market Forecast Data |
2024 - 2032 |
|
Segments Covered |
By Process, By Vehicle Type, By Application, and By Geography |
|
Regional Scope |
North America, Europe, Asia Pacific, Latin America, and Middle East & Africa |
|
Key Companies Profiled |
POSCO, China Steel Corporation, United States Steel Corporation, ArcelorMittal, Hyundai Steel, Nippon Steel & Sumitomo Metal Corporation, JSW Group, JFE Steel Corporation, TATA Steel, and NUCOR Corporation. |
|
Report Coverage |
Market Trends, Drivers, Restraints, Competitive Analysis, Player Profiling, Covid-19 Analysis, Regulation Analysis |
Automotive Steel Market Insights
The demand for lightweight vehicles is a significant driver of the automotive steel market. As fuel efficiency and emission reductions become increasingly important, automakers are adopting advanced high-strength steels (AHSS). These steels offer high strength-to-weight ratios, allowing for lighter vehicles without compromising safety or performance, thus meeting regulatory and consumer demands. Additionally, the continuous rise in global vehicle production, particularly in developing countries, boosts the demand for automotive steel. Emerging markets in Asia-Pacific, Latin America, and Africa are experiencing robust automotive industry growth, driving the need for reliable and cost-effective materials. Technological advancements in steel manufacturing, such as the development of ultra-high-strength steels (UHSS) and new coating technologies, enhance the performance characteristics of automotive steel. These advancements improve vehicle safety, durability, and corrosion resistance, making steel a preferred material. Furthermore, governments worldwide are implementing stricter regulations on vehicle emissions and safety standards. This regulatory environment pushes automakers to use high-performance materials like AHSS to meet these stringent requirements, driving demand for automotive steel.
However, the market faces several restraints. The prices of raw materials like iron ore and coking coal are subject to fluctuations due to market dynamics, geopolitical tensions, and supply chain disruptions. This volatility impacts the cost structure of automotive steel production, posing challenges for manufacturers. Moreover, the increasing use of lightweight materials such as aluminum, carbon fiber, and composites in the automotive industry presents competition for steel. These materials, though more expensive, offer significant weight savings and are gaining traction in specific vehicle segments. Additionally, advanced steel grades, while offering superior properties, are often more expensive to produce. This cost factor can be a barrier to widespread adoption, especially among cost-sensitive automakers.

Automotive Steel Market Segmentation
The worldwide market for automotive steel is split based on process, vehicle type, application, and geography.
Automotive Steel Market By Process
- Basic Oxygen Furnace (BOF)
- Electric Arc Furnace (EAF)
According to automotive steel industry analysis, the electric arc furnace (EAF) segment is anticipated to take a notable share. EAF is gaining prominence due to its environmental and economic benefits. Unlike the basic oxygen furnace (BOF) process, EAF uses scrap steel as the primary raw material, which significantly reduces the carbon footprint and energy consumption. This aligns with the automotive industry's increasing focus on sustainability and reducing greenhouse gas emissions. Additionally, EAF allows for greater flexibility and lower production costs, which are crucial in the competitive steel industry. The ability to efficiently recycle scrap steel makes EAF an attractive option for automakers looking to meet stringent environmental regulations and adopt sustainable manufacturing practices, thereby driving its growth in the automotive steel market.
Automotive Steel Market By Vehicle Type
- Passenger Vehicles
- Light Commercial Vehicles
- Heavy Commercial Vehicles
The passenger vehicles dominate the vehicle type category and it is expected to increase during the automotive steel market forecast period. This dominance is driven by the sheer volume of passenger cars produced and sold globally, which far exceeds that of light and heavy commercial vehicles. The demand for advanced steel materials in passenger vehicles is high due to the need for enhanced safety features, fuel efficiency, and performance. Automakers are increasingly using high-strength and ultra-high-strength steels to achieve these goals, particularly in structural components and safety systems. Additionally, the rising consumer expectations for vehicle durability and longevity further boost the use of specialized steels in passenger cars. This sustained demand ensures that the passenger vehicle segment remains the largest and most influential in the automotive steel market.
Automotive Steel Market By Application
- Body Structure
- Power Train
- Suspension
- Others
In the terms of automotive steel market analysis, the body structure segment commands the largest share due to its critical role in vehicle integrity and safety. The body structure requires materials that offer a high strength-to-weight ratio, which steel provides effectively. Automakers rely on advanced high-strength steels (AHSS) to design crumple zones, reinforce the passenger cabin, and meet stringent crash safety standards. These steels are essential for maintaining vehicle rigidity while reducing overall weight, contributing to fuel efficiency and performance. The extensive use of steel in body panels, frames, and underbody components underscores its importance. As vehicles evolve to meet higher safety and efficiency standards, the demand for steel in body structures continues to drive the market forward.
Automotive Steel Market Regional Outlook
North America
- U.S.
- Canada
Europe
- U.K.
- Germany
- France
- Spain
- Rest of Europe
Asia-Pacific
- India
- Japan
- China
- Australia
- South Korea
- Rest of Asia-Pacific
Latin America
- Brazil
- Mexico
- Rest of LATAM
The Middle East & Africa
- South Africa
- GCC Countries
- Rest of the Middle East & Africa (ME&A)
 Automotive Steel Market Regional Analysis
Asia-Pacific is the largest region in the automotive steel market due to several key factors. The region is home to some of the world's largest automotive producers, including China, Japan, South Korea, and India, which drive substantial demand for automotive steel. China, in particular, is a major hub for both vehicle manufacturing and steel production, contributing significantly to the region's dominance. The rapid industrialization and urbanization in Asia-Pacific countries have led to increased automobile ownership, further boosting the market.
Additionally, the growing middle-class population and rising disposable incomes in these countries are driving higher sales of passenger and commercial vehicles. The region also benefits from significant investments in infrastructure and automotive manufacturing facilities, enhancing production capabilities. Furthermore, government initiatives promoting electric vehicles and stricter safety regulations are pushing automakers to adopt advanced high-strength steels (AHSS) to improve vehicle performance and safety. These factors collectively make Asia-Pacific the leading region in the market, with continuous growth in the automotive steel industry forecast period.
Automotive Steel Market Players
Some of the top automotive steel companies offered in our report includes POSCO, China Steel Corporation, United States Steel Corporation, ArcelorMittal, Hyundai Steel, Nippon Steel & Sumitomo Metal Corporation, JSW Group, JFE Steel Corporation, TATA Steel, and NUCOR Corporation.
Frequently Asked Questions
How big is the automotive steel market?
The automotive steel market size was valued at USD 118.3 billion in 2023.
What is the CAGR of the global automotive steel market from 2024 to 2032?
The CAGR of automotive steel is 3.8% during the analysis period of 2024 to 2032.
Which are the key players in the automotive steel market?
The key players operating in the global market are including POSCO, China Steel Corporation, United States Steel Corporation, ArcelorMittal, Hyundai Steel, Nippon Steel & Sumitomo Metal Corporation, JSW Group, JFE Steel Corporation, TATA Steel, and NUCOR Corporation.
Which region dominated the global automotive steel market share?
Asia-Pacific held the dominating position in automotive steel industry during the analysis period of 2024 to 2032.
Which region registered fastest CAGR from 2024 to 2032?
North America region exhibited fastest growing CAGR for market of automotive steel during the analysis period of 2024 to 2032.
What are the current trends and dynamics in the global automotive steel industry?
The current trends and dynamics in the automotive steel industry include growing demand for lightweight vehicles to improve fuel efficiency, increasing automotive production globally, advancements in high-strength steel technologies, and stringent government regulations on vehicle safety and emissions.
Which vehicle type held the maximum share in 2023?
The passenger vehicles type held the maximum share of the automotive steel industry.


