Automotive Smart Display Market Size - Global Industry, Share, Analysis, Trends and Forecast 2023 - 2032
Published :
Report ID:
Pages :
Format :
Automotive Smart Display Market Size - Global Industry, Share, Analysis, Trends and Forecast 2023 - 2032
Report Coverage
- Industry Dynamics
- Market Size and Forecast Data
- Segment Analysis
- Competitive Landscape
- Regional Analysis with a Niche Focus on Country-Level Data
- High Level Analysis - Porter's, PESTEL, Value Chain, etc.
- Company Profiles of Key Players
- Option to Customize the Report As Per Your Specific Need
Request Sample Report
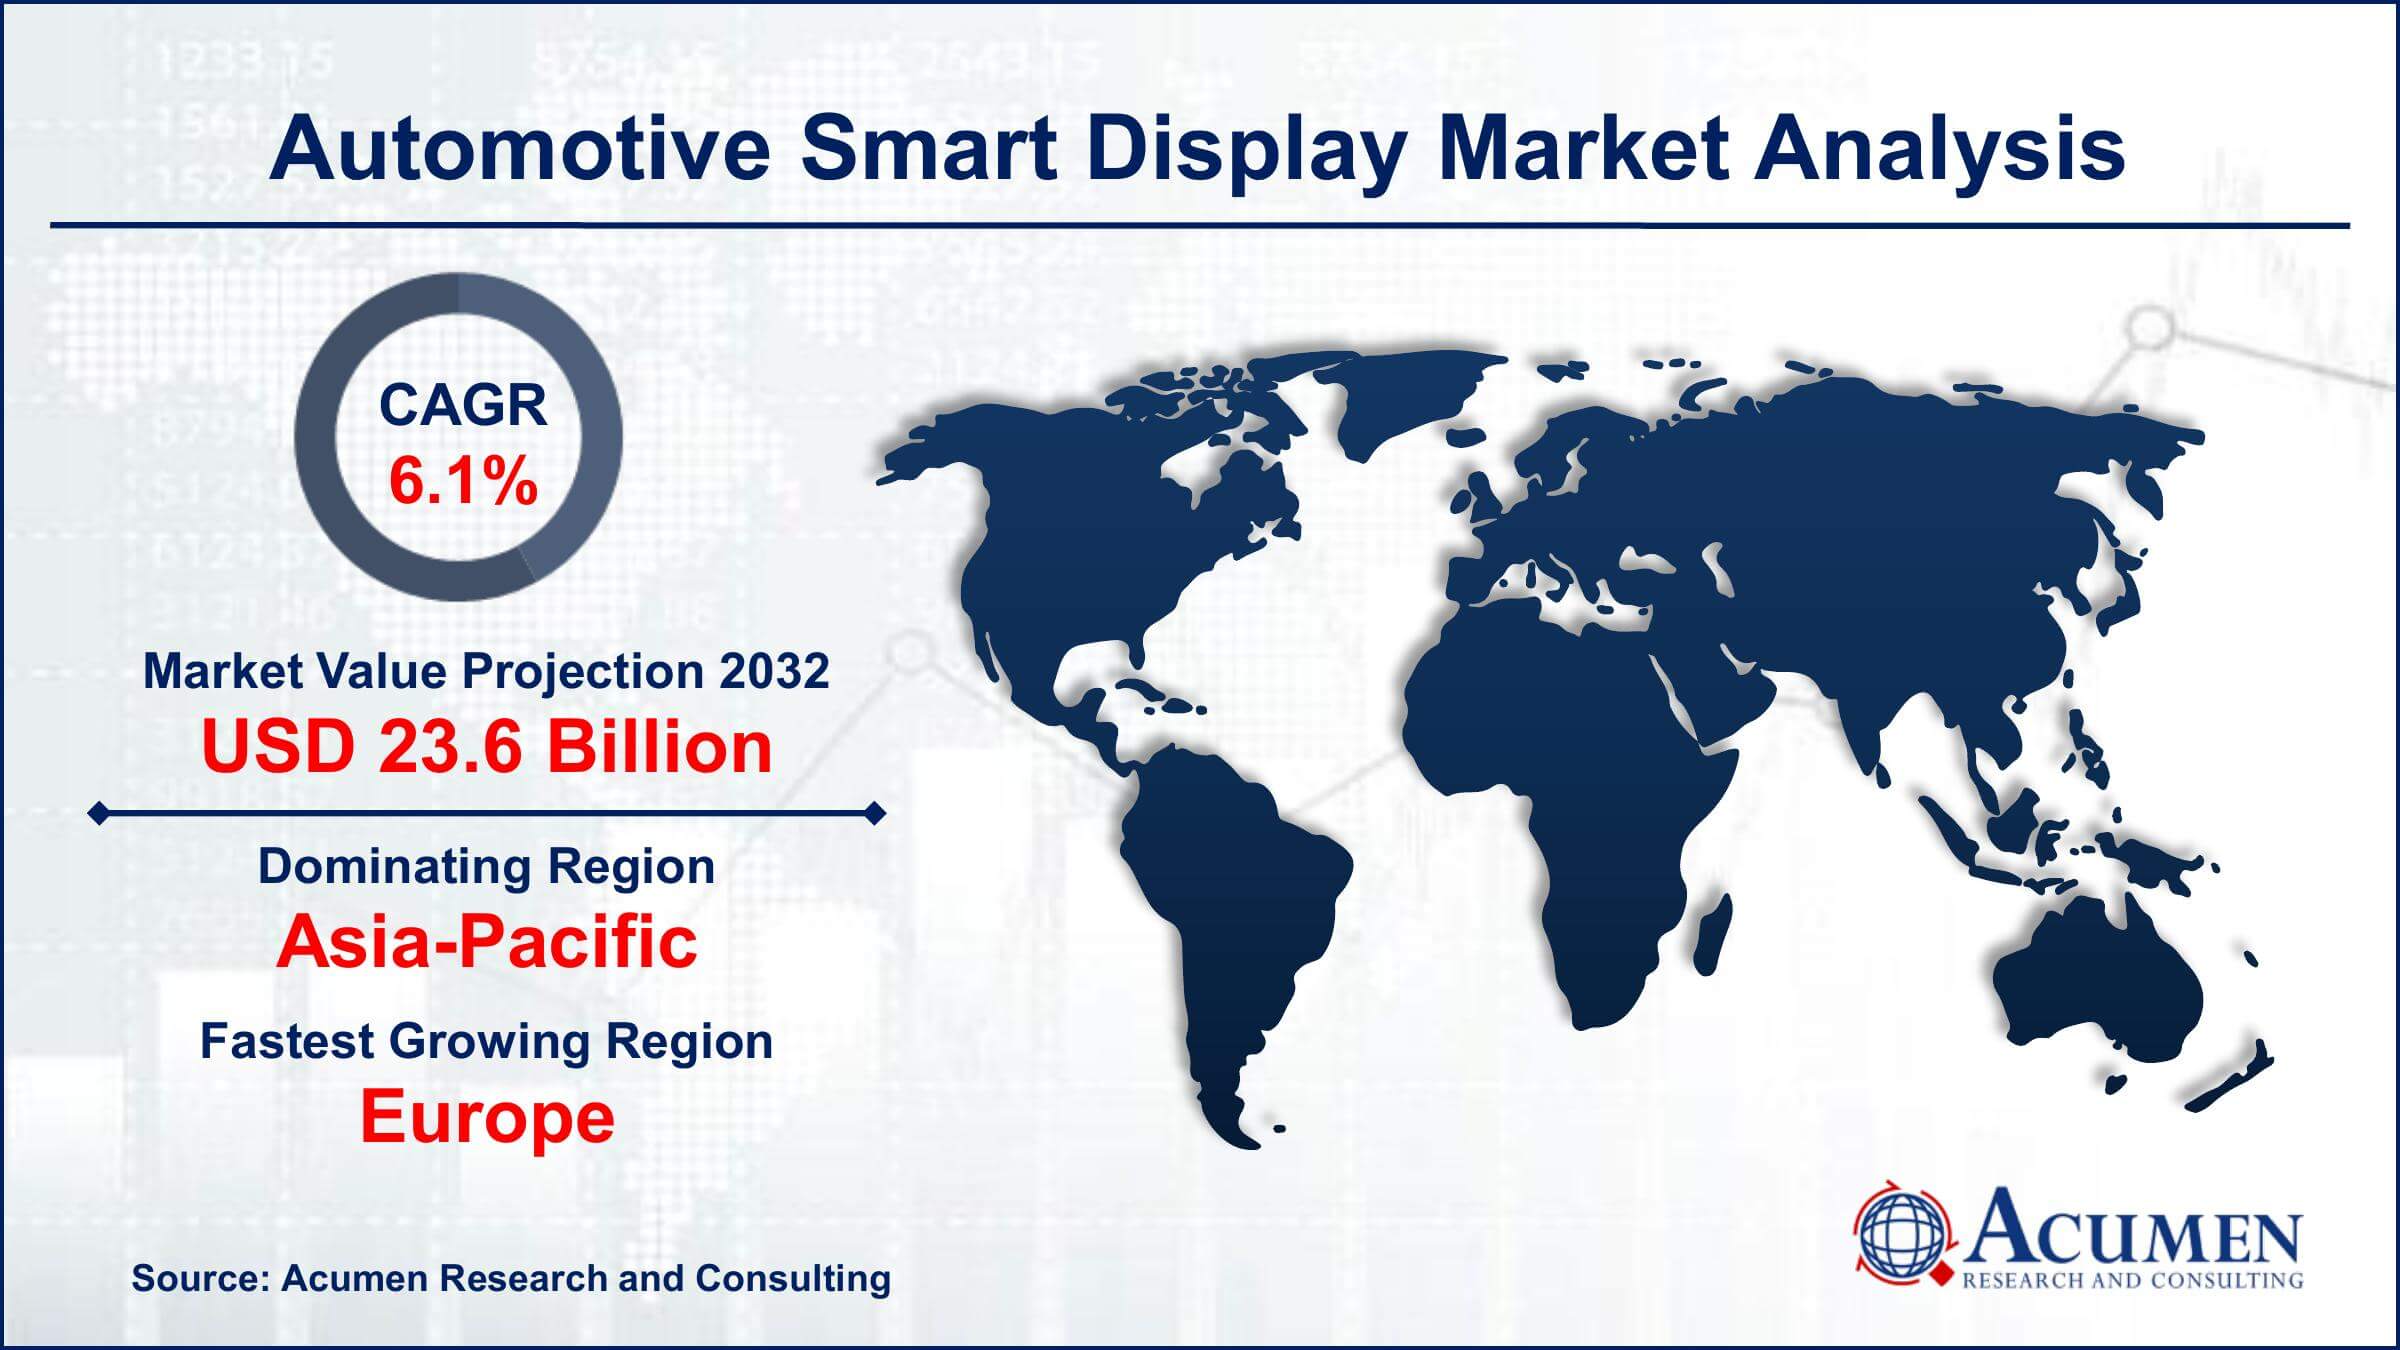
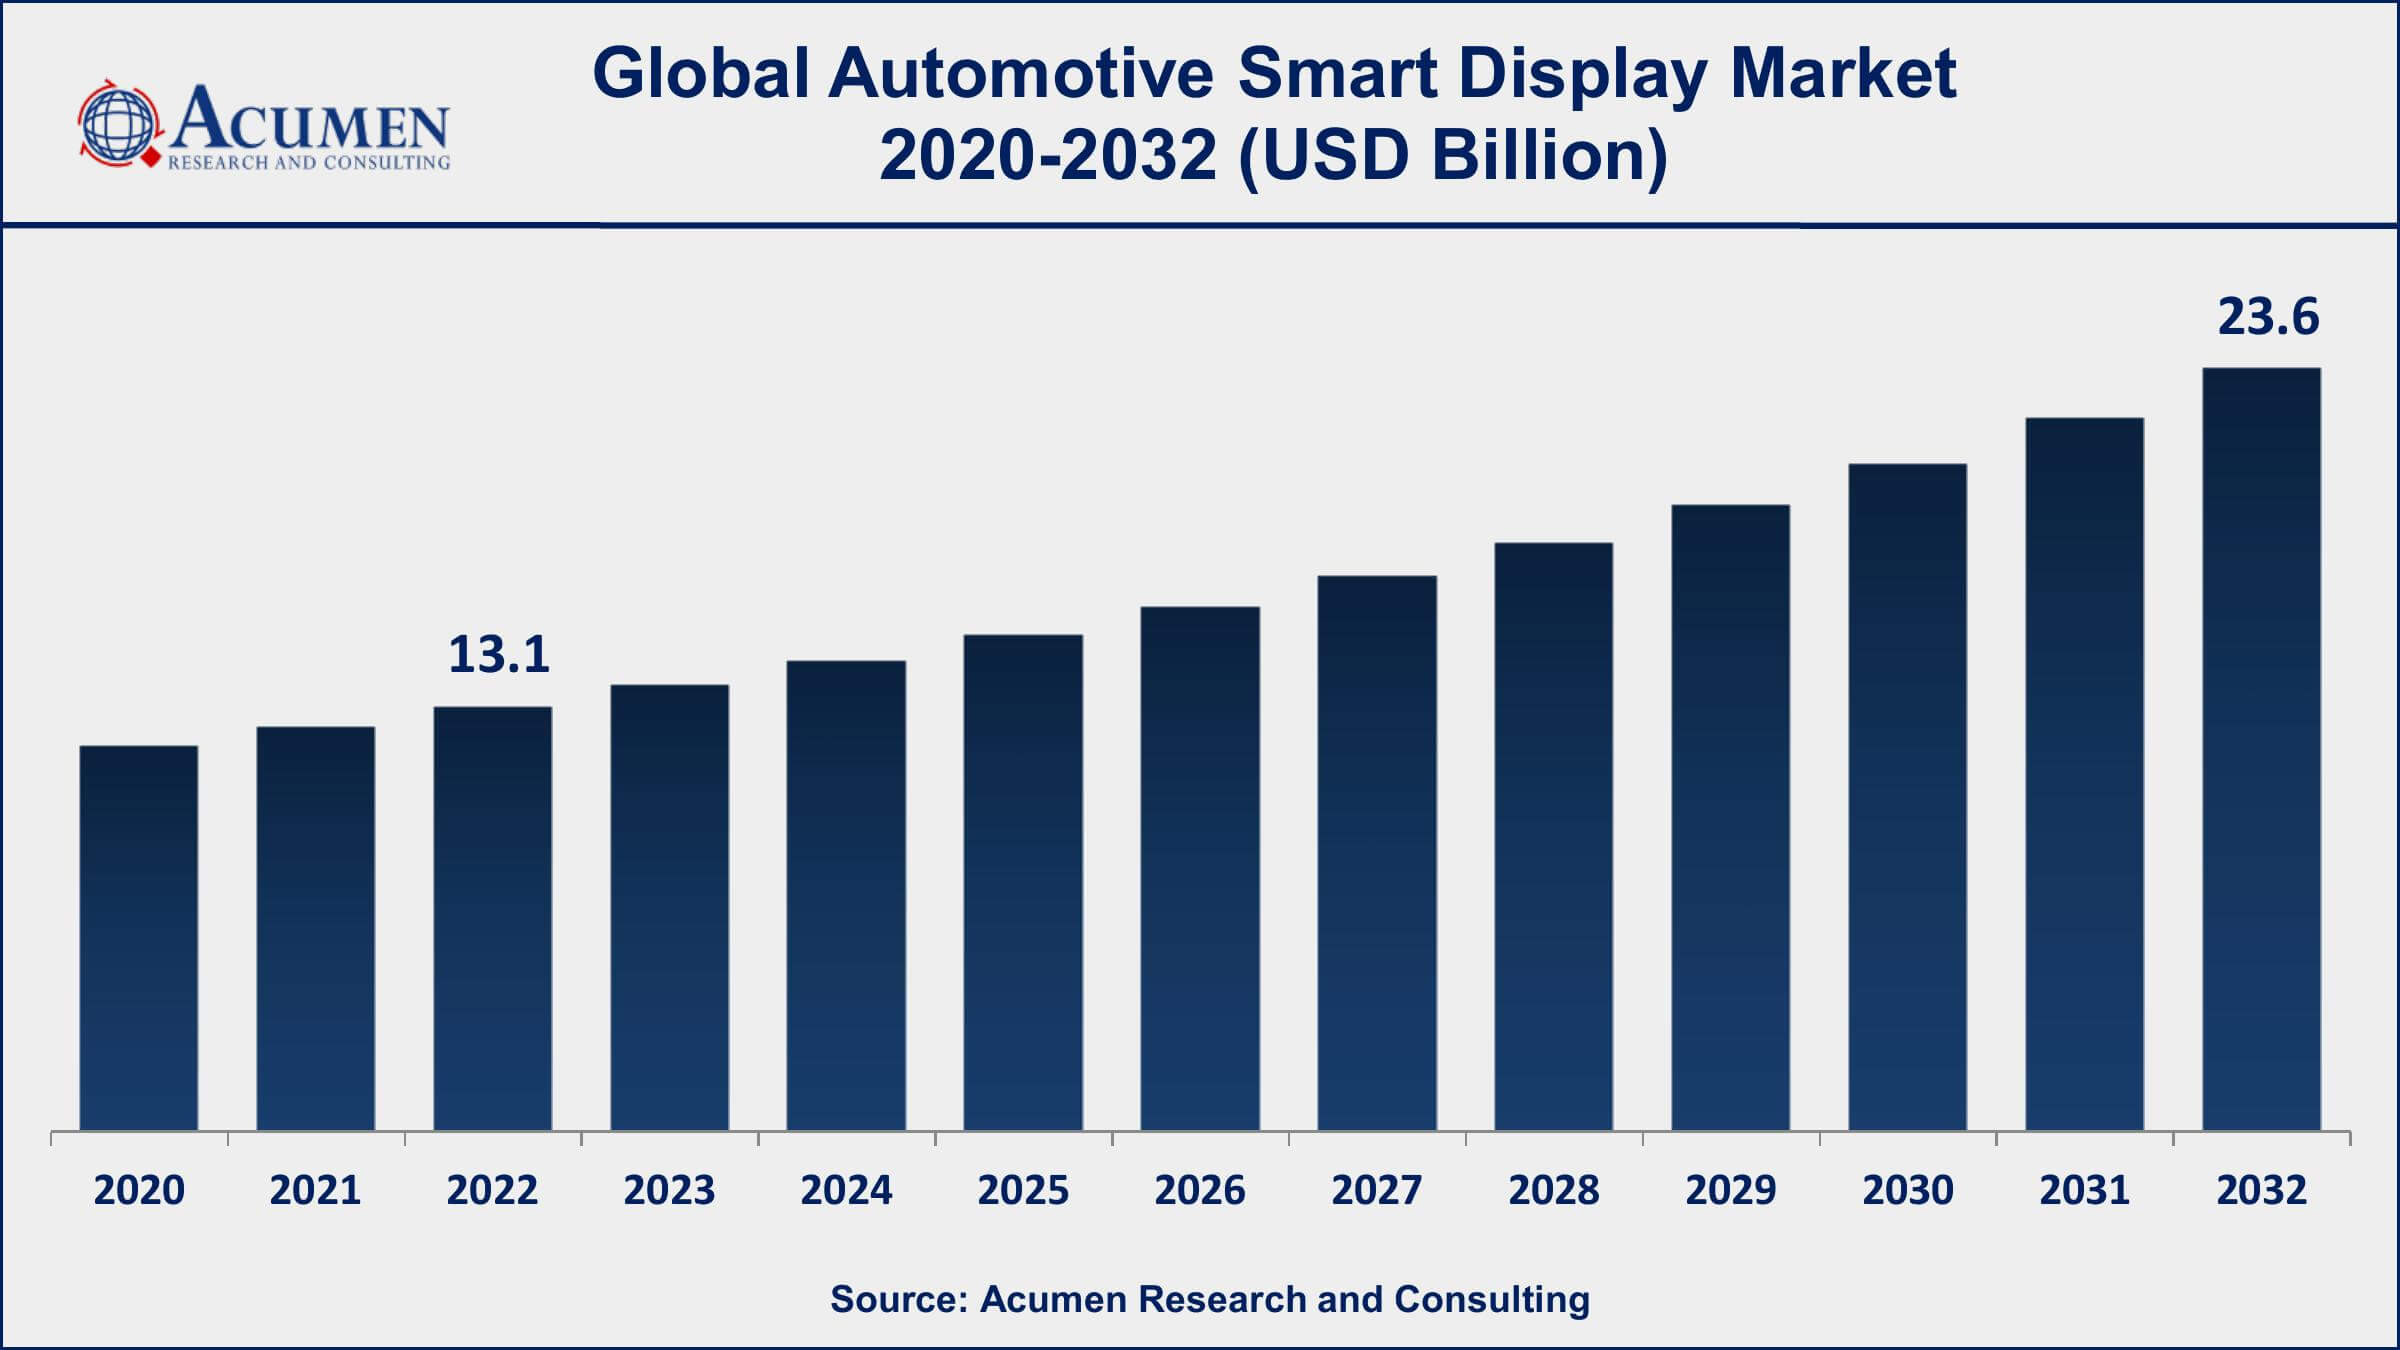
The Global Automotive Smart Display Market Size accounted for USD 13.1 Billion in 2022 and is projected to achieve a market size of USD 23.6 Billion by 2032 growing at a CAGR of 6.1% from 2023 to 2032.
Automotive Smart Display Market Highlights
- Global automotive smart display market revenue is expected to increase by USD 23.6 Billion by 2032, with a 6.1% CAGR from 2023 to 2032
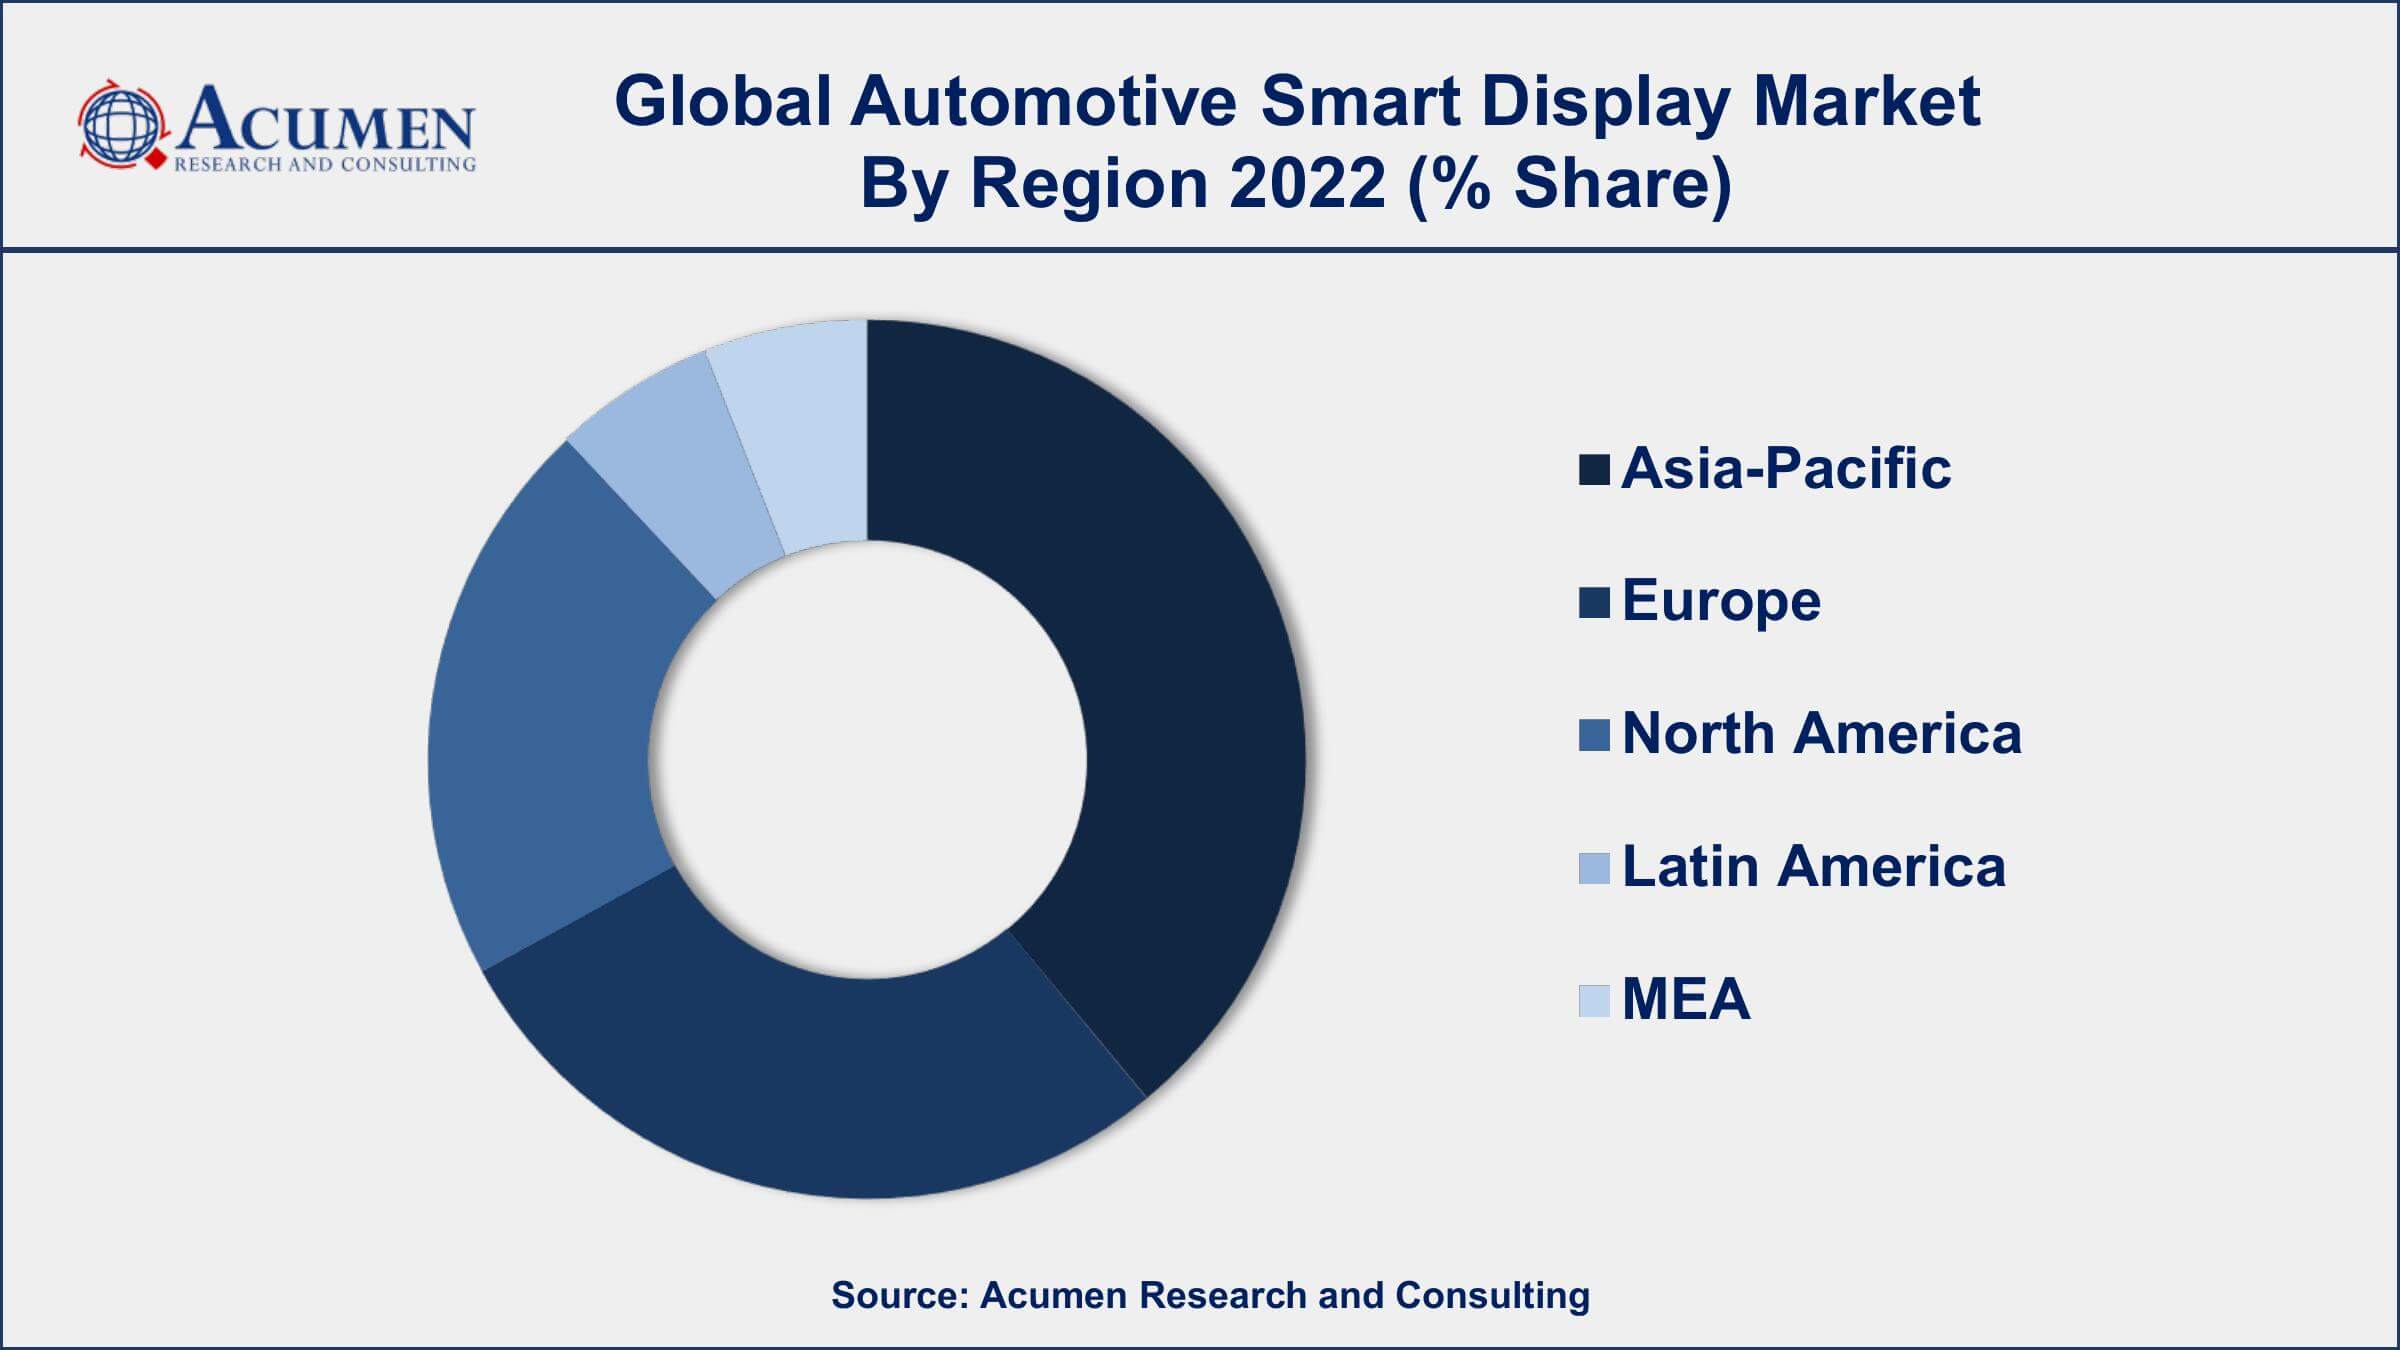
- Asia-Pacific region led with more than 51% of automotive smart display market share in 2022
- Europe automotive smart display market growth will record a CAGR of around 6.6% from 2023 to 2032
- According to a study, touchscreens accounted for 79% of new vehicle sales in the United States in 2022, up from 60% in 2021
- By display technology, the TFT-LCD display segment has recorded more than 52% of the revenue share in 2022
- Increasing consumer demand for connected cars and advanced infotainment systems, drives the automotive smart display market value

An automotive smart display refers to an advanced digital interface integrated into vehicles that provides information, entertainment, and control features to drivers and passengers. These displays typically utilize touchscreens and offer a user-friendly interface that enables access to various functionalities such as navigation, media playback, climate control, and connectivity options. Additionally, smart displays can incorporate voice recognition and gesture control for enhanced convenience and safety while driving.
The market for automotive smart displays has witnessed significant growth in recent years and is expected to continue expanding in the coming years. This growth can be attributed to several factors. Firstly, the increasing consumer demand for connected cars and advanced infotainment systems has been a major driving force. Consumers now expect seamless integration of their smartphones and other devices with their vehicles, allowing for easy access to apps, media, and online services. Moreover, advancements in display technology, such as high-resolution screens, vibrant colors, and responsive touchscreens, have enhanced the user experience and fueled the adoption of automotive smart displays. The integration of artificial intelligence (AI) and voice assistants has also contributed to the market growth, enabling voice commands for various functions and providing a more intuitive and hands-free user interface.

Global Automotive Smart Display Market Trends
Market Drivers
- Increasing consumer demand for connected cars and advanced infotainment systems
- Growing emphasis on driver safety and integration of advanced driver assistance systems (ADAS)
- Advancements in display technology, including high-resolution screens and responsive touchscreens
- Rising popularity of smartphone integration and seamless connectivity options in vehicles
Market Restraints
- High cost of smart display technology, limiting affordability for some consumers
- Challenges related to driver distraction and maintaining focus on the road while using smart displays
Market Opportunities
- Increasing adoption of electric vehicles (EVs) and autonomous vehicles, which require advanced display systems
- Growing demand for personalized and customizable user interfaces in vehicles
Automotive Smart Display Market Report Coverage
| Market | Automotive Smart Display Market |
| Automotive Smart Display Market Size 2022 | USD 13.1 Billion |
| Automotive Smart Display Market Forecast 2032 | USD 23.6 Billion |
| Automotive Smart Display Market CAGR During 2023 - 2032 | 6.1% |
| Automotive Smart Display Market Analysis Period | 2020 - 2032 |
| Automotive Smart Display Market Base Year | 2022 |
| Automotive Smart Display Market Forecast Data | 2023 - 2032 |
| Segments Covered | By Application, By Display Technology, By Display Size, By Vehicle Type, And By Geography |
| Regional Scope | North America, Europe, Asia Pacific, Latin America, and Middle East & Africa |
| Key Companies Profiled | Continental AG, Panasonic Corporation, Denso Corporation, Visteon Corporation, Robert Bosch GmbH, LG Display Co., Ltd., Magna International Inc., Harman International Industries, Incorporated, Yazaki Corporation, Garmin Ltd., Pioneer Corporation, and Delphi Technologies. |
| Report Coverage |
Market Trends, Drivers, Restraints, Competitive Analysis, Player Profiling, Covid-19 Analysis, Regulation Analysis |
An automotive smart display is a digital interface integrated into vehicles that provides various functionalities and information to drivers and passengers. It typically consists of a touchscreen display with advanced features, such as high-resolution visuals, intuitive user interfaces, and connectivity options. These displays serve as the primary interface for controlling and accessing a range of vehicle features, including infotainment systems, navigation, climate control, and advanced driver assistance systems (ADAS).
The application of automotive smart displays is diverse and wide-ranging. One of the key applications is in infotainment systems, where smart displays offer an interactive and intuitive interface for accessing media, apps, and online services. Drivers and passengers can easily control music playback, make hands-free calls, access navigation services, and even stream content from their smartphones. Smart displays can present real-time information about the vehicle's surroundings, such as blind-spot monitoring, collision warnings, and lane departure alerts. This allows drivers to have a clear view of potential hazards and enhances their situational awareness, ultimately improving safety on the road.
The automotive smart display market has experienced significant growth in recent years and is expected to continue its upward trajectory in the coming years. Factors such as increasing consumer demand for connected cars, advanced infotainment systems, and enhanced driving experiences have been key drivers of this growth. The integration of advanced technologies, including high-resolution touchscreens, artificial intelligence, and voice assistants, has significantly improved the user interface and overall functionality of smart displays. Moreover, the rising emphasis on driver safety and the integration of advanced driver assistance systems (ADAS) have further propelled the market growth.
Automotive Smart Display Market Segmentation
The global automotive smart display market segmentation is based on application, display technology, display size, vehicle type, and geography.
Automotive Smart Display Market By Application
- Rear Seat Entertainment
- Centre Stack
- Digital Instrument Cluster
- Head-up Display
According to the automotive smart display industry analysis, the centre stack segment accounted for the largest market share in 2022. The center stack refers to the area in the vehicle's dashboard where the main display screen and various controls are located. It serves as the primary interface for accessing infotainment, navigation, climate control, and other vehicle functions. The growth of the center stack segment can be attributed to the increasing consumer demand for connected cars and advanced infotainment systems has fueled the adoption of larger and more feature-rich display screens in the center stack. Consumers now expect a seamless and intuitive user experience that integrates their smartphones and other devices into the vehicle's display system.
Automotive Smart Display Market By Display Technology
- LCD
- OLED
- TFT-LCD
- Others
In terms of display technology, the TFT-LCD segment is expected to witness significant growth in the coming years. TFT-LCD displays have been widely adopted in the automotive industry due to their excellent picture quality, high resolution, and ability to display vibrant colors. These displays offer a versatile and reliable solution for automotive smart displays, particularly in center stack and instrument cluster applications. The growth of the TFT-LCD segment can be attributed to the increasing demand for advanced infotainment systems and digital instrument clusters in vehicles has driven the need for high-quality displays. TFT-LCD technology provides sharp and clear images, making it well-suited for displaying a wide range of information, including navigation, media, and vehicle performance data.
Automotive Smart Display Market By Display Size
- <5"
- 5" - 10"
- >10"
According to the automotive smart display market forecast, the 5" - 10" segment is expected to witness significant growth in the coming years. Displays in this size range are commonly used for various applications in vehicles, including center stack displays, instrument clusters, and rear-seat entertainment systems. The growth of the 5" - 10" segment can be attributed to the increasing demand for connected cars and advanced infotainment systems has driven the need for larger and more feature-rich displays. Displays in the 5" - 10" range provide a balance between functionality and space requirements in the vehicle, offering a visually appealing interface for accessing multimedia, navigation, and vehicle control features.
Automotive Smart Display Market By Vehicle Type
- Passenger car
- Heavy Commercial Vehicle
- Light Commercial Vehicle
Based on the vehicle type, the passenger car segment is expected to continue its growth trajectory in the coming years. Passenger cars, including sedans, hatchbacks, SUVs, and luxury vehicles, have witnessed a significant increase in the adoption of smart displays due to the rising consumer demand for advanced infotainment systems and connected features. The growth of the passenger car segment in the automotive smart display market can be attributed to the increasing consumer expectations for a seamless and connected driving experience have propelled the demand for advanced infotainment systems. Smart displays provide passengers with access to a wide range of features, including multimedia playback, navigation, smartphone integration, and connectivity options, enhancing their comfort and convenience during the journey.
Automotive Smart Display Market Regional Outlook
North America
- U.S.
- Canada
Europe
- U.K.
- Germany
- France
- Spain
- Rest of Europe
Asia-Pacific
- India
- Japan
- China
- Australia
- South Korea
- Rest of Asia-Pacific
Latin America
- Brazil
- Mexico
- Rest of Latin America
The Middle East & Africa
- South Africa
- GCC Countries
- Rest of the Middle East & Africa (ME&A)

Automotive Smart Display Market Regional Analysis
The Asia-Pacific region dominates the automotive smart display market for several reasons, making it a leading force in terms of market share and growth. Asia-Pacific is home to some of the world's largest automotive markets, including China, Japan, South Korea, and India. These countries have a significant demand for vehicles and have witnessed rapid growth in their automotive industries. The rising middle class, increasing urbanization, and improved living standards in these countries have led to higher purchasing power and a greater appetite for technologically advanced vehicles, including those equipped with smart displays. Moreover, the Asia-Pacific region is known for its strong manufacturing capabilities and a robust ecosystem of automotive component suppliers. The region houses several major automotive OEMs (Original Equipment Manufacturers) as well as a vast network of display manufacturers and technology providers. This has facilitated the availability and affordability of automotive smart displays in the market, giving the region a competitive advantage.
Automotive Smart Display Market Player
Some of the top automotive smart display market companies offered in the professional report includeContinental AG, Panasonic Corporation, Denso Corporation, Visteon Corporation, Robert Bosch GmbH, LG Display Co., Ltd., Magna International Inc., Harman International Industries, Incorporated, Yazaki Corporation, Garmin Ltd., Pioneer Corporation, and Delphi Technologies.
Frequently Asked Questions
What was the market size of the global automotive smart display in 2022?
The market size of automotive smart display was USD 13.1 Billion in 2022.
What is the CAGR of the global automotive smart display market from 2023 to 2032?
The CAGR of automotive smart display is 5.1% during the analysis period of 2023 to 2032.
Which are the key players in the automotive smart display market?
The key players operating in the global market are including Continental AG, Panasonic Corporation, Denso Corporation, Visteon Corporation, Robert Bosch GmbH, LG Display Co., Ltd., Magna International Inc., Harman International Industries, Incorporated, Yazaki Corporation, Garmin Ltd., Pioneer Corporation, and Delphi Technologies.
Which region dominated the global automotive smart display market share?
Asia-Pacific held the dominating position in automotive smart display industry during the analysis period of 2023 to 2032.
Which region registered fastest CAGR from 2023 to 2032?
Europe region exhibited fastest growing CAGR for market of automotive smart display during the analysis period of 2023 to 2032.
What are the current trends and dynamics in the global automotive smart display industry?
The current trends and dynamics in the automotive smart display industry include increasing consumer demand for connected cars and advanced infotainment systems, and growing emphasis on driver safety and integration of advanced driver assistance systems (ADAS).
Which display technology held the maximum share in 2022?
The TFT-LCD display technology held the maximum share of the automotive smart display industry.


