Arachidonic Acid Ara Market | Acumen Research and Consulting
Arachidonic Acid Market Size - Global Industry, Share, Analysis, Trends and Forecast 2024 - 2032
Published :
Report ID:
Pages :
Format : ![]()
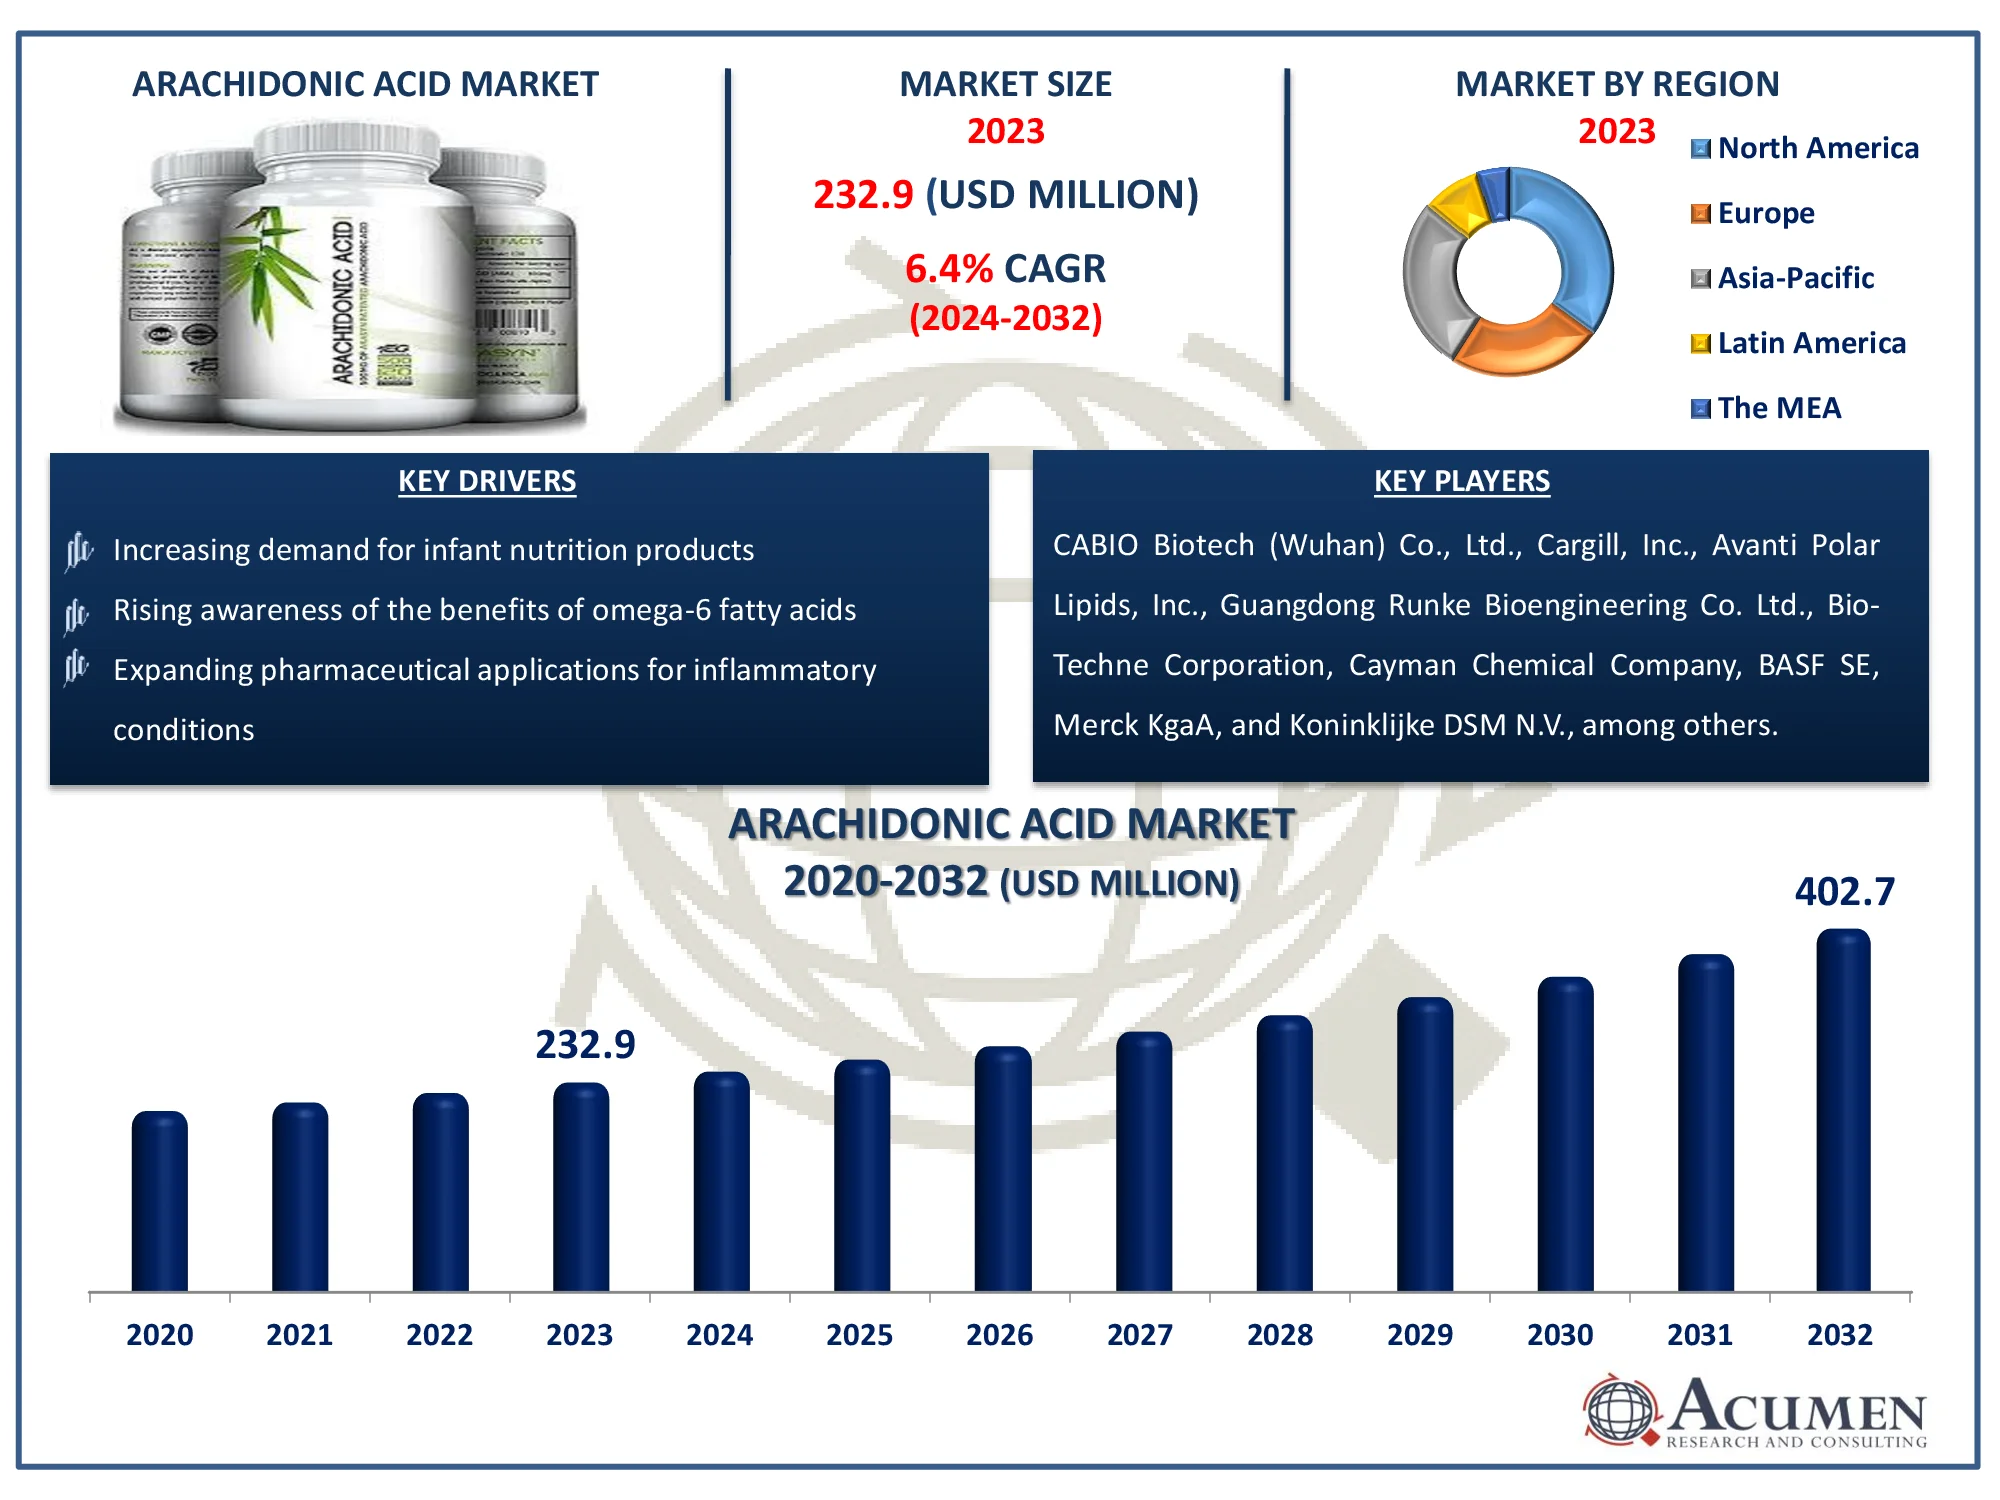
The Global Arachidonic Acid Market Size accounted for USD 232.9 Million in 2023 and is estimated to achieve a market size of USD 402.7 Million by 2032 growing at a CAGR of 6.4% from 2024 to 2032.
Arachidonic Acid Market Highlights
- Global arachidonic acid market revenue is poised to garner USD 402.7 million by 2032 with a CAGR of 6.4% from 2024 to 2032
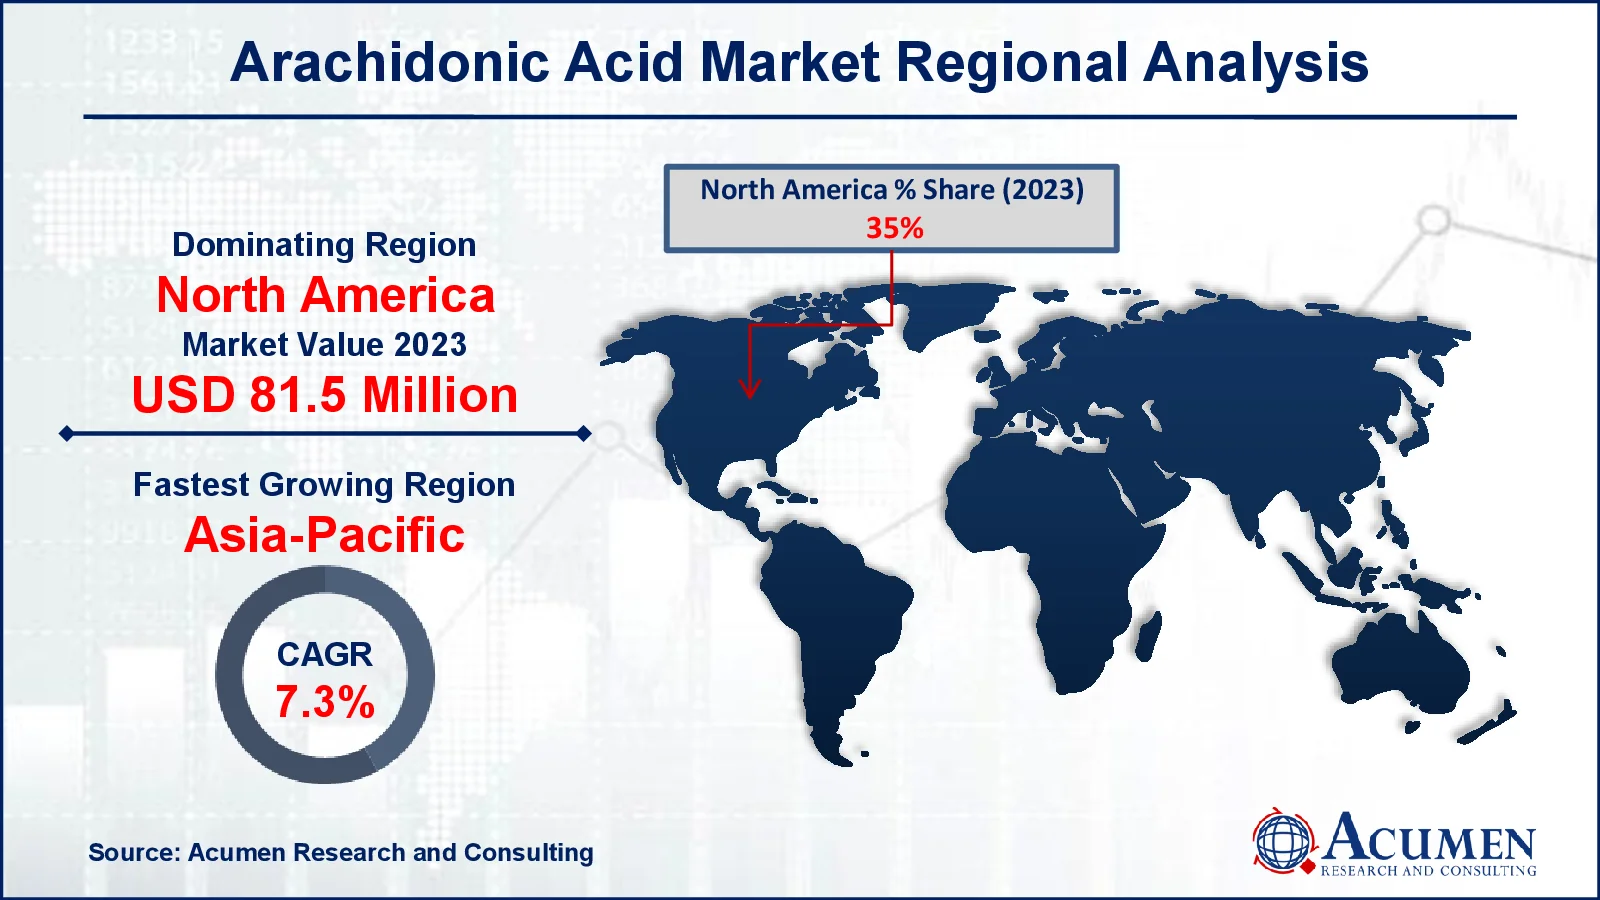
- North America arachidonic acid market value occupied around USD 81.5 million in 2023
- Asia-Pacific arachidonic acid market growth will record a CAGR of more than 7.3% from 2024 to 2032
- Among form, the solvent sub-segment generated more than USD 186.3 million revenue in 2023
- Based on application, the infant formula sub-segment generated around 82% market arachidonic acid share in 2023
- Increasing research into the therapeutic benefits of arachidonic acid is a popular arachidonic acid market trend that fuels the industry demand

Arachidonic acid is a polyunsaturated omega-6 fatty acid that plays a pivotal role in human physiology. As a component of cell membranes, it contributes to their structure and fluidity. However, its significance extends far beyond this fundamental function. This fatty acid is a precursor to a family of potent biological compounds known as eicosanoids, including prostaglandins, thromboxanes, and leukotrienes. These substances regulate a vast array of physiological processes, such as inflammation, blood clotting, blood pressure, and uterine contractions. Consequently, arachidonic acid is intimately involved in immune responses, reproduction, and maintaining homeostasis.
While essential for various bodily functions, an imbalance in arachidonic acid levels can contribute to chronic inflammatory conditions. Excessive production of eicosanoids derived from arachidonic acid has been implicated in diseases such as arthritis, asthma, and cardiovascular disorders. Therefore, understanding the intricate metabolism of arachidonic acid is crucial for developing therapeutic strategies targeting these conditions.
Global Arachidonic Acid Market Dynamics
Market Drivers
- Increasing demand for infant nutrition products
- Rising awareness of the benefits of omega-6 fatty acids
- Growing use in dietary supplements and functional foods
- Expanding pharmaceutical applications for inflammatory conditions
Market Restraints
- High production costs of arachidonic acid
- Regulatory challenges regarding health claims
- Availability of alternative sources of omega-6 fatty acids
Market Opportunities
- Emerging markets in Asia-Pacific for infant nutrition
- Development of new formulations and applications in food and pharma
- Growing trend toward personalized nutrition
Arachidonic Acid Market Report Coverage
| Market | Arachidonic Acid Market |
| Arachidonic Acid Market Size 2022 |
USD 232.9 Million |
| Arachidonic Acid Market Forecast 2032 | USD 402.7 Million |
| Arachidonic Acid Market CAGR During 2023 - 2032 | 6.4% |
| Arachidonic Acid Market Analysis Period | 2020 - 2032 |
| Arachidonic Acid Market Base Year |
2022 |
| Arachidonic Acid Market Forecast Data | 2023 - 2032 |
| Segments Covered | By Form, By Source, By Application, And By Geography |
| Regional Scope | North America, Europe, Asia Pacific, Latin America, and Middle East & Africa |
| Key Companies Profiled | CABIO Biotech (Wuhan) Co., Ltd., Cargill, Inc., Avanti Polar Lipids, Inc., Guangdong Runke Bioengineering Co. Ltd., Bio-Techne Corporation, Cayman Chemical Company, BASF SE, Merck KgaA, Koninklijke DSM N.V., and Suntory Beverage & Food Ltd. |
| Report Coverage |
Market Trends, Drivers, Restraints, Competitive Analysis, Player Profiling, Covid-19 Analysis, Regulation Analysis |
Arachidonic Acid Market Insights
The arachidonic acid (ARA) market is poised for significant growth, driven by the expanding use of ARA in infant food and health supplements. ARA is an essential fatty acid crucial for the development of infants, particularly for brain health and vision. As awareness of the importance of proper infant nutrition increases, the demand for ARA-enriched infant formula is expected to rise. This demand is fueled by the need to provide infants with adequate amounts of ARA and DHA (Docosahexaenoic Acid), both vital for healthy growth and development. The infant formula segment, therefore, is anticipated to witness substantial growth due to the increasing incorporation of ARA in these products.
Furthermore, growing awareness about the benefits of ARA, driven by marketing efforts from major companies, is likely to have a positive impact on market expansion. These companies are educating consumers about the importance of ARA in maintaining nutritional balance, which is leading to increased demand for ARA supplements. The rising instances of ARA deficiency, particularly in certain populations, are creating a need for ARA supplementation through tablets, injections, and syrups.
In addition, the growing focus on maintaining nutritional value in diets is contributing to the global market growth. As consumers become more health-conscious and aware of the long-term benefits of balanced nutrition, the demand for ARA in various forms is expected to increase, driving market development in the arachidonic acid market forecast period.
Arachidonic Acid Market Segmentation
The worldwide market for arachidonic acid is split based on form, source, application, and geography.
Arachidonic Acid Market By Forms
- Solvent
- Solid
According to arachidonic acid industry analysis, the solvent category dominates due to its vast applicability and adaptability. Solvent versions of ARA are widely employed in the food and pharmaceutical industries, where they can be conveniently integrated into products such as infant formula, dietary supplements, and functional meals. The solvent form is favored because it provides greater bioavailability and ease of combining with other components, allowing the ARA to be used effectively in a variety of formulations. This segment's dominance is additionally bolstered by rising demand for ARA-enriched products in health-conscious consumer markets, where the solvent form's compatibility with many product types makes it a popular choice among producers.
Arachidonic Acid Market By Sources
- Plant
- Animal
The arachidonic acid market primarily sources its product from either plant or animal origins. Currently, the animal segment holds the dominant position in the market. Several factors contribute to this dominance. Historically, animal-derived arachidonic acid has been more readily available and extensively studied. Its incorporation into products, particularly infant formulas, has been well-established due to its recognized nutritional benefits. Additionally, the production processes for animal-based arachidonic acid have been optimized over time, leading to higher yields and consistent quality.
While the plant-based segment is growing in interest due to increasing consumer demand for plant-derived ingredients, it still faces challenges in terms of yield, purity, and cost-effectiveness compared to animal sources. However, ongoing research and technological advancements are gradually addressing these issues, potentially leading to increased market share for plant-based arachidonic acid in the arachidonic acid market forecast period.
Arachidonic Acid Market By Applications
- Supplement
- Infant Formula
Infant formula segment drives the general arachidonic acid market bookkeeping (accounting). Polyunsaturated unsaturated fats are known to enhance the child's visual perception and memory, which is a noteworthy driving variable for the ARA market. Moreover, expanding administrative acknowledgment for oil-based products in newborn child sustenance is decidedly affecting this development. Expanding mindfulness with respect to the product benefits in child nourishment developed as an essential explanation for heightening demand in infant formula application.
Arachidonic Acid Market Regional Outlook
North America
- U.S.
- Canada
Europe
- U.K.
- Germany
- France
- Spain
- Rest of Europe
Asia-Pacific
- India
- Japan
- China
- Australia
- South Korea
- Rest of Asia-Pacific
Latin America
- Brazil
- Mexico
- Rest of Latin America
The Middle East & Africa
- South Africa
- GCC Countries
- Rest of the Middle East & Africa (ME&A)

Arachidonic Acid Market Regional Analysis
North America is the largest region in the arachidonic acid industry in 2023. This development was ascribed to the nearness of unmistakable organizations in North America. Asia-Pacific region is additionally expected to enlist a strong CAGR because of fast urbanization, rising working class populace, and anticipated development in the quantity of new-born children over the area. Presences of developing economies, for example, India and China, and accessibility of minimal effort raw materials and work are drawing in worldwide producers to grow their activities in APAC. This will likewise drive the business in APAC area.
Europe likewise holds a prominent offer of the worldwide market. Early appropriation of ARA in the enhancement and new-born child equation is the essential explanation for this development. Elements, for example, exclusive expectations of living and all around created sports nourishment showcase, are additionally driving the provincial business.
Arachidonic Acid Market Players
Some of the top arachidonic acid companies offered in our report include CABIO Biotech (Wuhan) Co., Ltd., Cargill, Inc., Avanti Polar Lipids, Inc., Guangdong Runke Bioengineering Co. Ltd., Bio-Techne Corporation, Cayman Chemical Company, BASF SE, Merck KgaA, Koninklijke DSM N.V., and Suntory Beverage & Food Ltd.
Frequently Asked Questions
How big is the arachidonic acid market?
The arachidonic acid market size was valued at USD 232.9 million in 2023.
What is the CAGR of the global arachidonic acid market from 2024 to 2032?
The CAGR of arachidonic acid is 6.4% during the analysis period of 2024 to 2032.
Which are the key players in the arachidonic acid market?
The key players operating in the global market are including CABIO Biotech (Wuhan) Co., Ltd., Cargill, Inc., Avanti Polar Lipids, Inc., Guangdong Runke Bioengineering Co. Ltd., Bio-Techne Corporation, Cayman Chemical Company, BASF SE, Merck KgaA, Koninklijke DSM N.V., and Suntory Beverage & Food Ltd.
Which region dominated the global arachidonic acid market share?
North America held the dominating position in arachidonic acid industry during the analysis period of 2024 to 2032.
Which region registered fastest CAGR from 2024 to 2032?
Asia-Pacific region exhibited fastest growing CAGR for market of arachidonic acid during the analysis period of 2024 to 2032.
What are the current trends and dynamics in the global arachidonic acid industry?
The current trends and dynamics in the arachidonic Acid industry include increasing demand for infant nutrition products, rising awareness of the benefits of omega-6 fatty acids, growing use in dietary supplements and functional foods, and expanding pharmaceutical applications for inflammatory conditions.
Which source held the maximum share in 2023?
The plant source held the maximum share of the arachidonic acid industry.


