The global agriculture adjuvant market is expected to grow at a CAGR of around 5.9% from 2021 to 2028 and expected to reach the market value of around US$ 5.0 Bn by 2028.
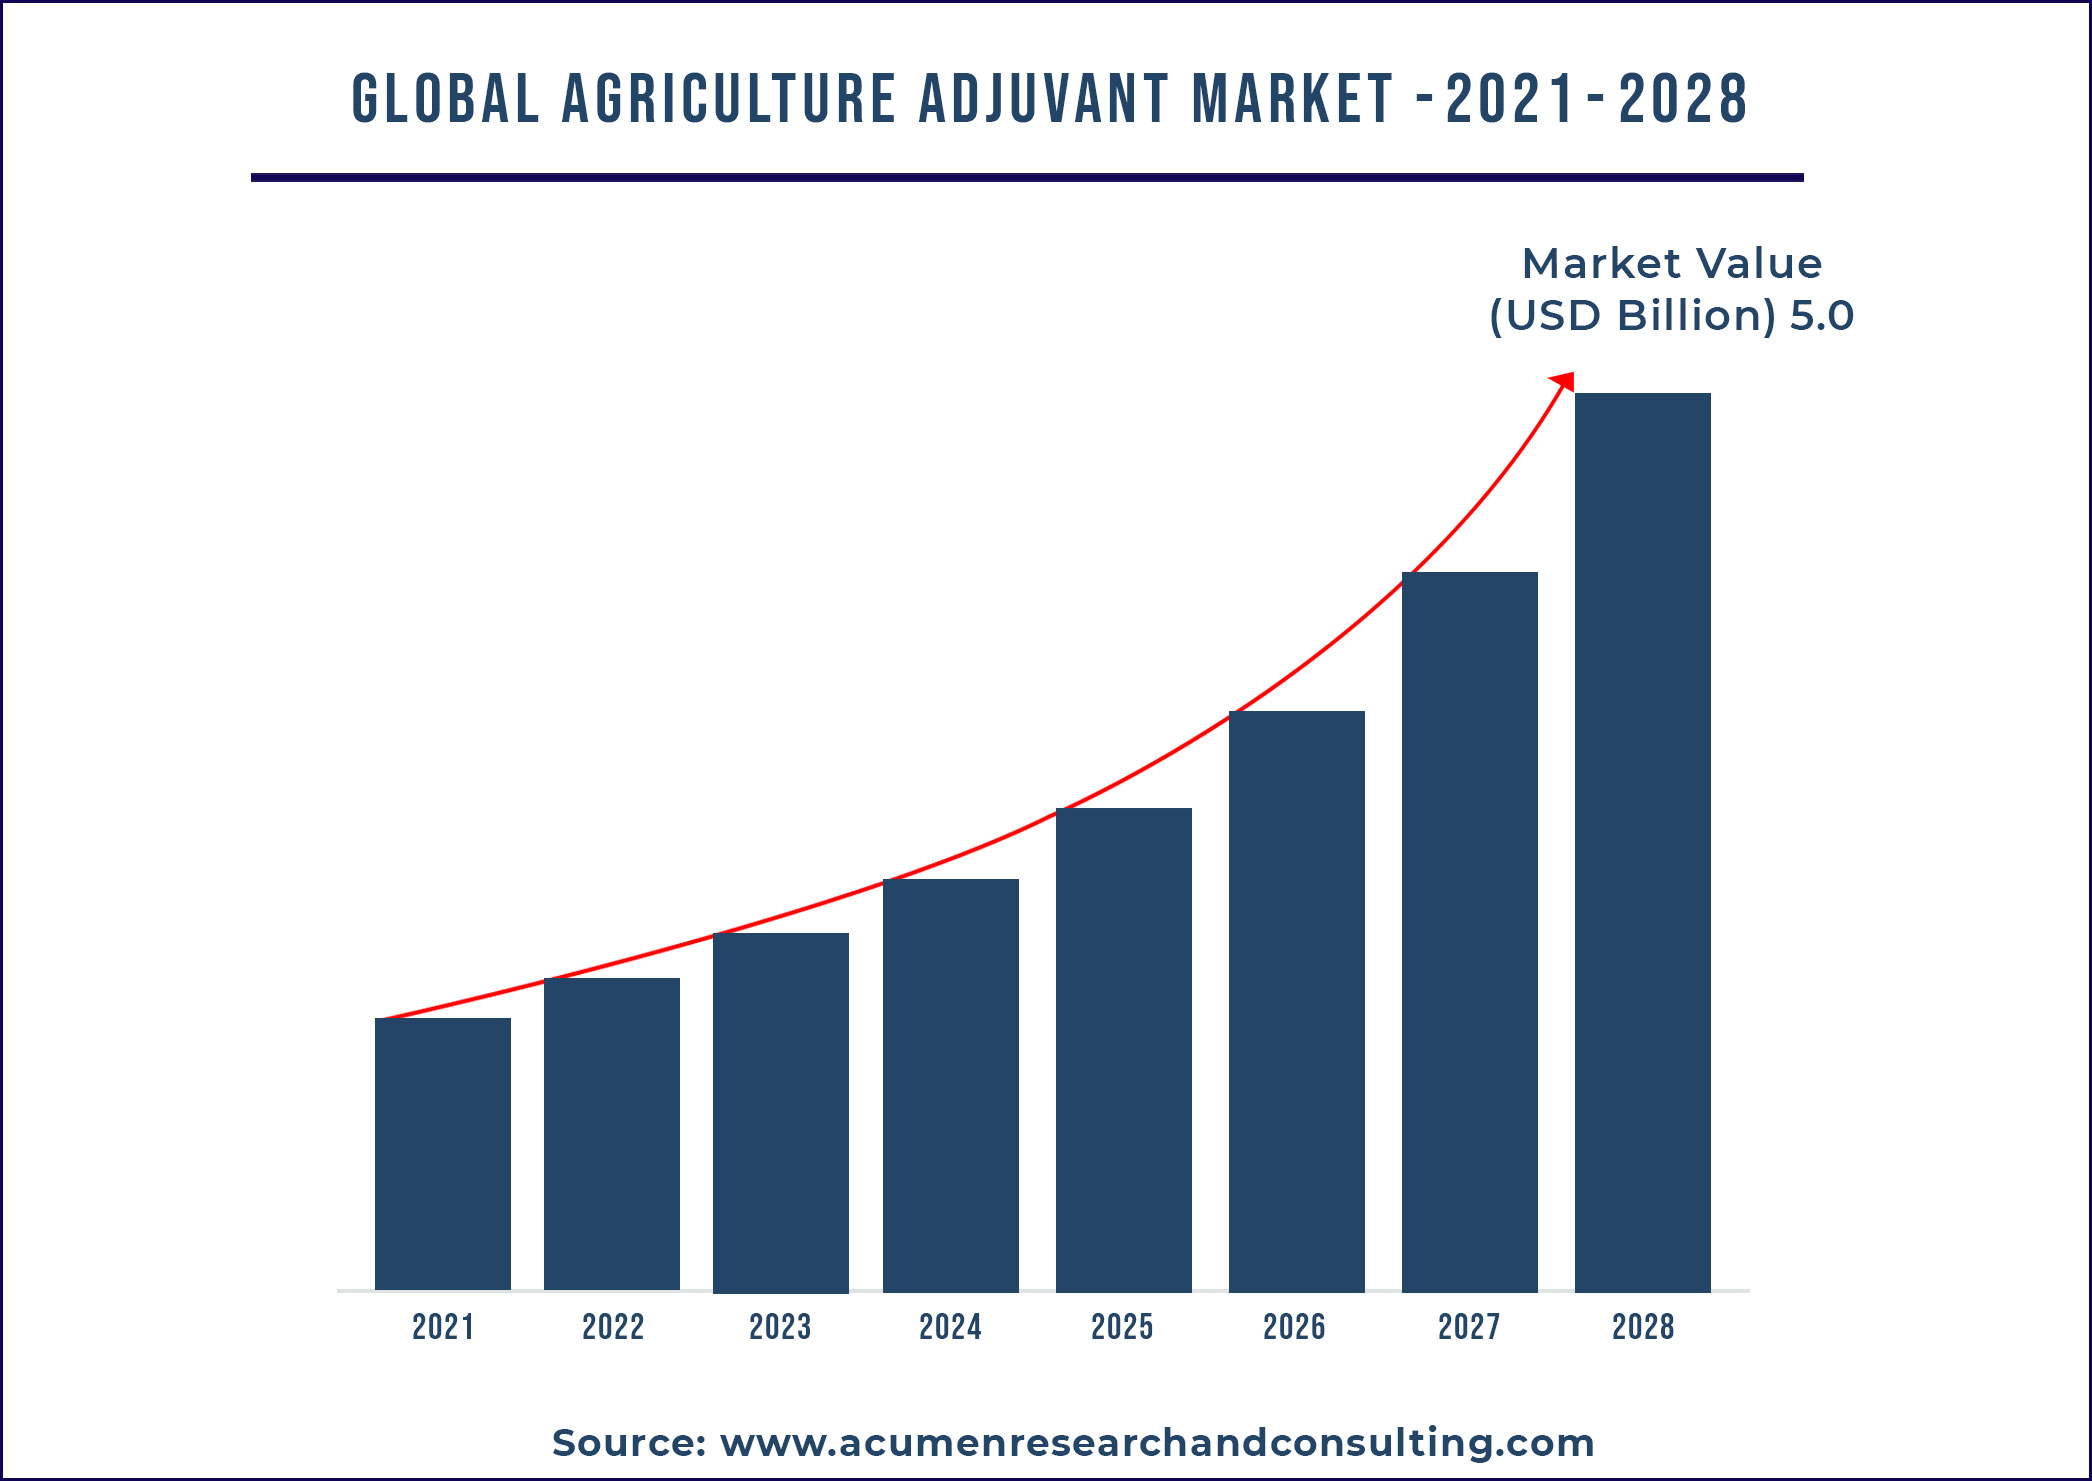
Agricultural adjuvant are surfactants that are added in to agrochemicals to improve the biological effectiveness of foliar sprays by improving spray wetting behavior and/or active ingredient penetration into leaf tissues. Furthermore, adjuvant is added to crop protection products to improve the overall performance and increase the effectiveness of the pesticide, insecticide, or herbicide. Drift control, stickers, wetting agents, water conditioners, and penetrants are examples of additives.
Report coverage
Market |
Agriculture Adjuvant Market |
Analysis Period |
2017 - 2028 |
Base Year |
2020 |
Forecast Data |
2021 - 2028 |
Segments Covered |
By Function, By Application, By Formulation, By Adoption Stage, By Crop Type, and By Region |
Regional Scope |
North America, Europe, Asia Pacific, Latin America, and Middle East & Africa |
Key Companies Profiled |
Clariant AG, AlzChem Group AG, DuPont de Nemours, Inc., Wilbur-Ellis Company Inc., Brandt Consolidated, Inc., BASF SE, Huntsman Corporation, and among others |
Report Coverage
|
Market Trends, Drivers, Restraints, Competitive Analysis, Player Profiling, Regulation Analysis |
Customization Scope |
10 hrs of free customization and expert consultation |
Market Drivers
Government support enhances the growth of global agricultural adjuvant market
Because pesticide active ingredients are widely available, several different types of formulations have been developed, based primarily on the physico-chemical properties of the active ingredients. Currently, the majority of government and regulatory bodies are demanding formulations that pose no safety risks and are used cleaner and safer for the utility, have a low environmental impact, and can be applied at the lowest dose rate. Furthermore, there is a growing demand from government agencies and consumer groups to use safer formulation additives and adjuvant, as well as to reduce pesticide residues on food crops after spraying. All of the aforementioned factors are putting significant strain on the development of improved formulation and adjuvant technologies.
Stringent regulations fuel the growth of global agricultural adjuvant market
According to a report published in 2003 by The Nature Conservancy's Weed Control Methods Handbook, regulatory agencies in the United States used to pay little attention to the regulation of adjuvant for herbicides. Because of the lack of consistent labeling laws, thousands of different adjuvant formulations and brands were marketed and sold without a consistent ingredient list or proper scientific trials. Because of such factors as state-level regulations concerning product quality and government proposals requiring full disclosure of ingredients, the adjuvant industry has begun to self-regulate. Currently, the Chemical Producers and Distributor Association (CDPA) are pushing for a certification process based on 17 labeling and manufacturing standards. Furthermore, these adjuvant manufacturers intend to conduct properly designed experimental trials and make the results available to both herbicide companies and consumers.
Developments of bio-adjuvant for commercial and organic farming bolster the growth of overall market
There is currently an ongoing study comparing traditional organosilicone surfactant and a variety of bio-adjuvant on the leaf surface using methods to study droplet behaviors. The results show that droplet drying time typically increased with droplet volume, but this response varied depending on the adjuvant. Adjuvant made with various pesticides (e.g., fungicide, insecticide, and biofungicide) had a significant impact on the droplet lifetime behavior of different adjuvant when used alone with water. When high moisture retention or good coverage is required for a given pesticide, these factors direct growers to the best bio-adjuvant to use. Furthermore, field free trials will aid in the screening of adjuvant that may be compatible with biopesticides and the assessment of biocontrol effects. These aforementioned factors will ultimately drive the growth of the agricultural adjuvant market as a whole.
Market Segmentation
The global agricultural adjuvant market is segmented based on function, application, formulation, adoption stage, and crop type. Based on function, the market is segmented as activator adjuvant and utility adjuvant. Based on activator adjuvant, the market is sub segmented as surfactants and oil adjuvant. By utility adjuvant, it is further segmented as compatibility agents, buffers/acidifiers, antifoam agents, water conditioning agents, drift control agents, and others. Furthermore, application segment is segregated as herbicides, insecticides, fungicides, and among others. By formulation, the market is classified into suspension concentrate and emulsifiable concentrate. Adoption stage is bifurcated into tank-mix and in-formulation. Crop-type is segmented as cereals and grains, fruits and vegetables, oilseeds and pulses, and other crops.
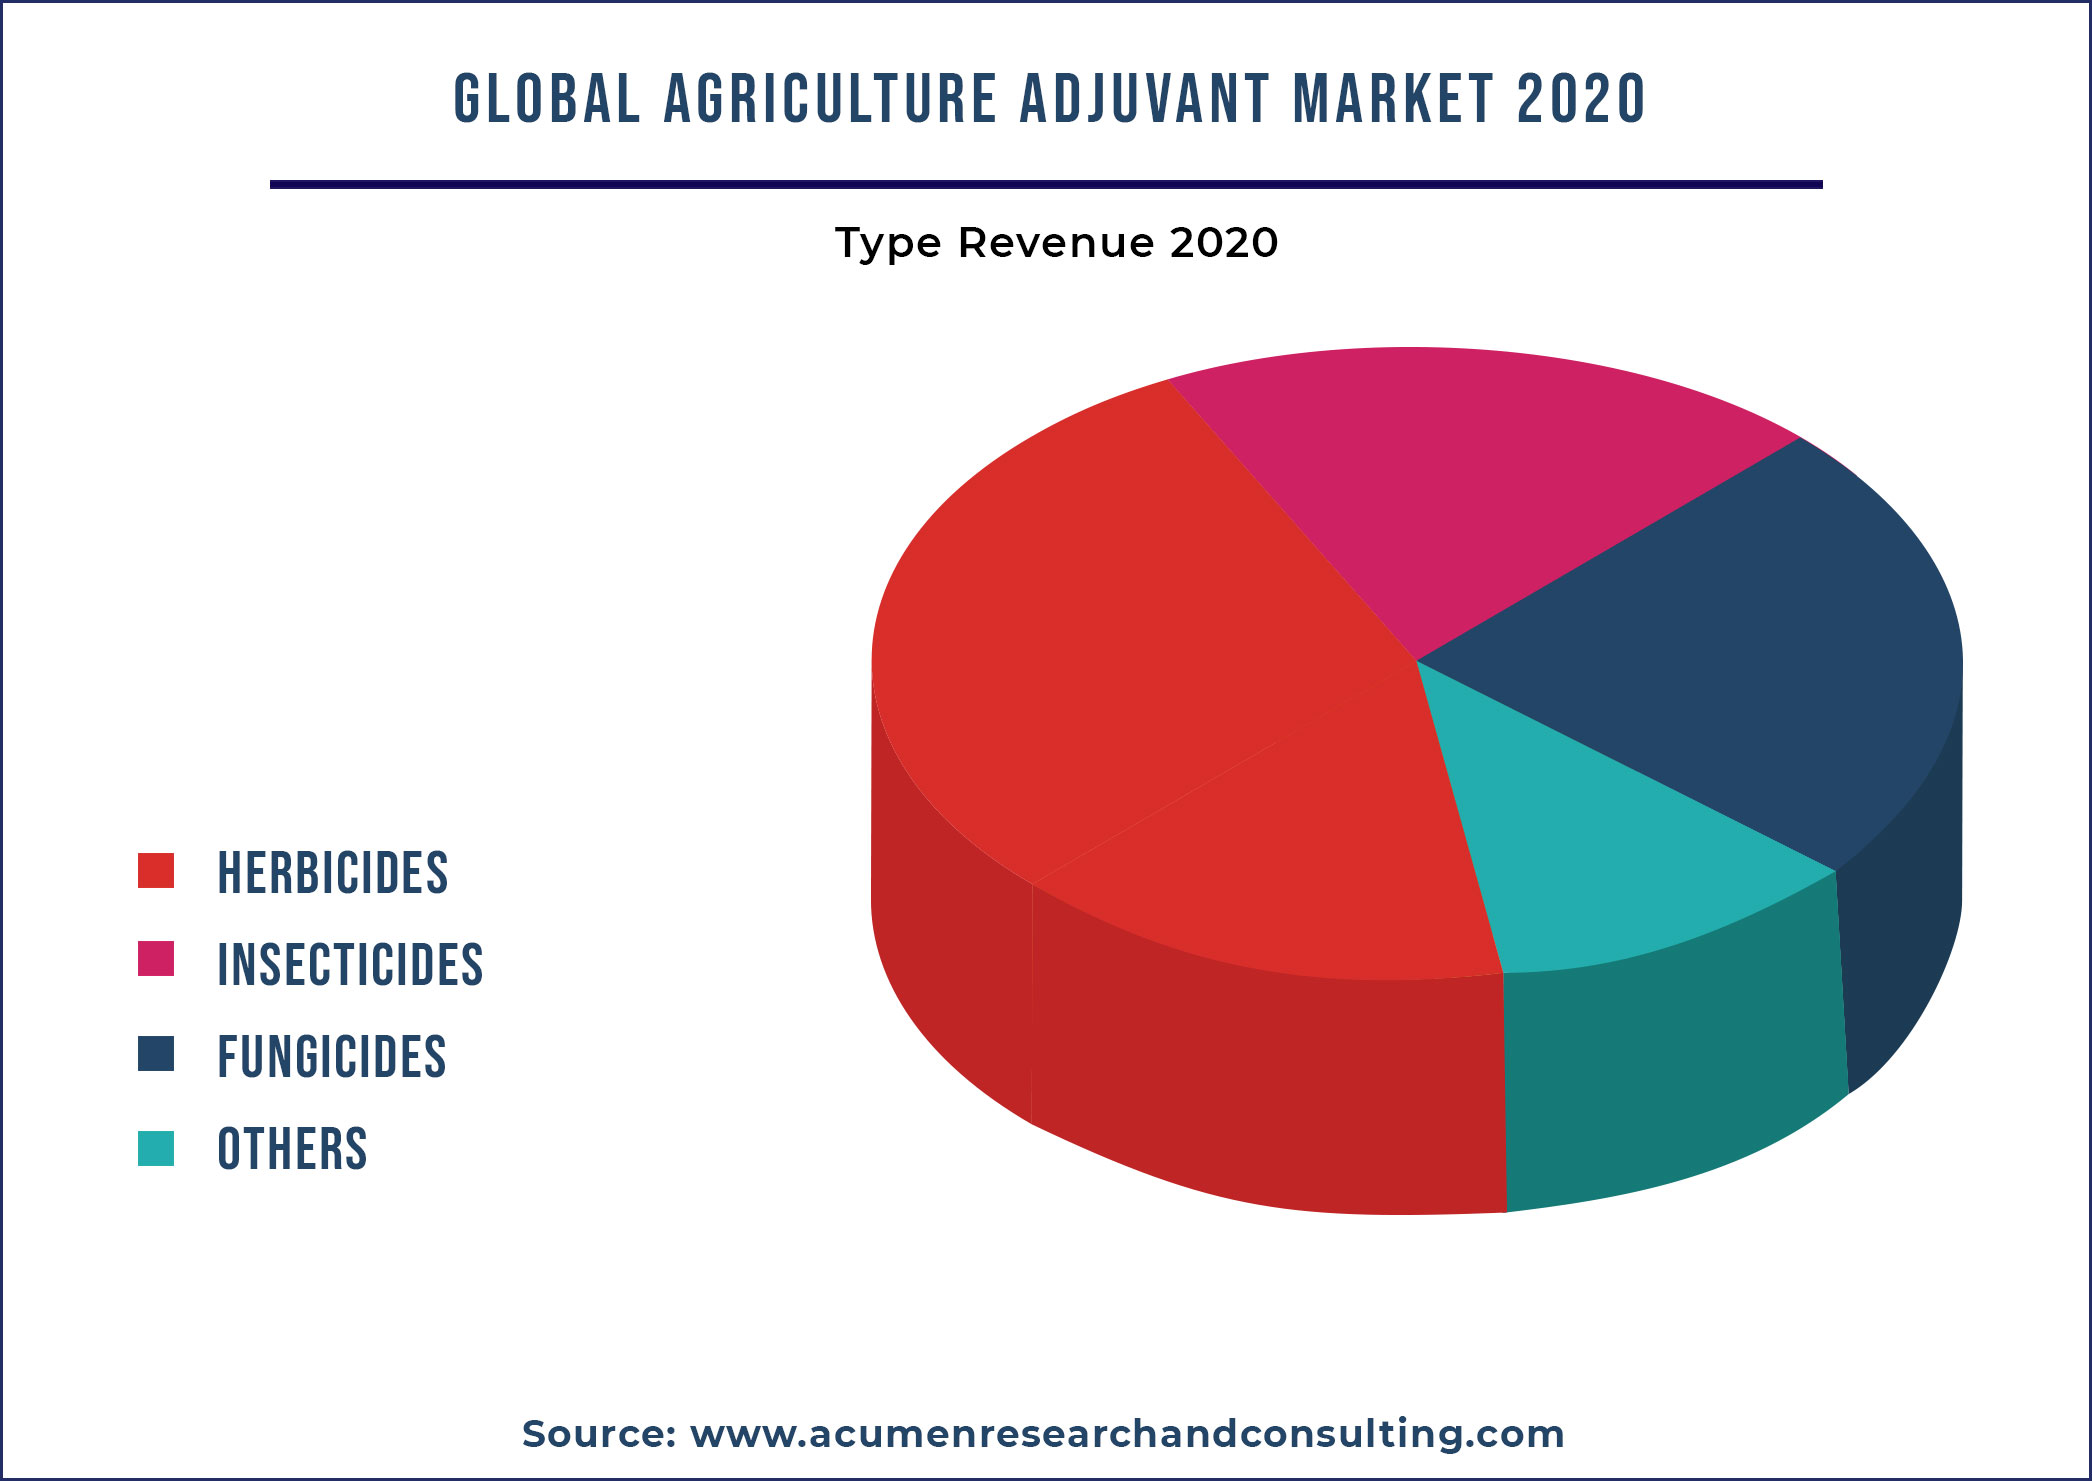
According to the function segment, activator adjuvant is expected to dominate the agricultural adjuvant market in the coming years, accounting for a significant share. According to a JSTOR report, activator adjuvant for herbicides increases herbicide activity by incorporating a wide range of surfactant chemistry. Furthermore, the manufacturer incorporates it into the product formulation or the herbicide applicator tank-mixes it. Activator adjuvant efficiency is determined not only by the adjutant’s function, but also by the herbicide, the specific weed species, and environmental conditions. Such factors have a positive impact on segmental growth, which in turn contributes to market growth overall.
Herbicides, based on application, will provide lucrative opportunities for segmental growth, contributing to market growth overall. Herbicides, according to a USEPA report, are chemicals that have evolved to manipulate or control undesirable vegetation. Because herbicides' potential effects are strongly influenced by their toxic mode of action and method of application, predicting the molecular site of action is difficult, but modes of action are well-established. Such factors are to blame for the overall positive growth of the agricultural adjuvant market.
Suspension concentrate, based on formulation, commands significant attention in the global market, contributing to overall growth. Suspension concentrates, which are essentially water dispersible granules, are useful for pre-mixing and are a very popular formulation used for the majority of pesticides. Such factors have boosted the use of suspension concentrates in the global agricultural adjuvant market.
Regional Landscape
North America dominates agricultural adjuvant market by recording dominant share; Asia Pacific will record fastest growing CAGR in the coming years
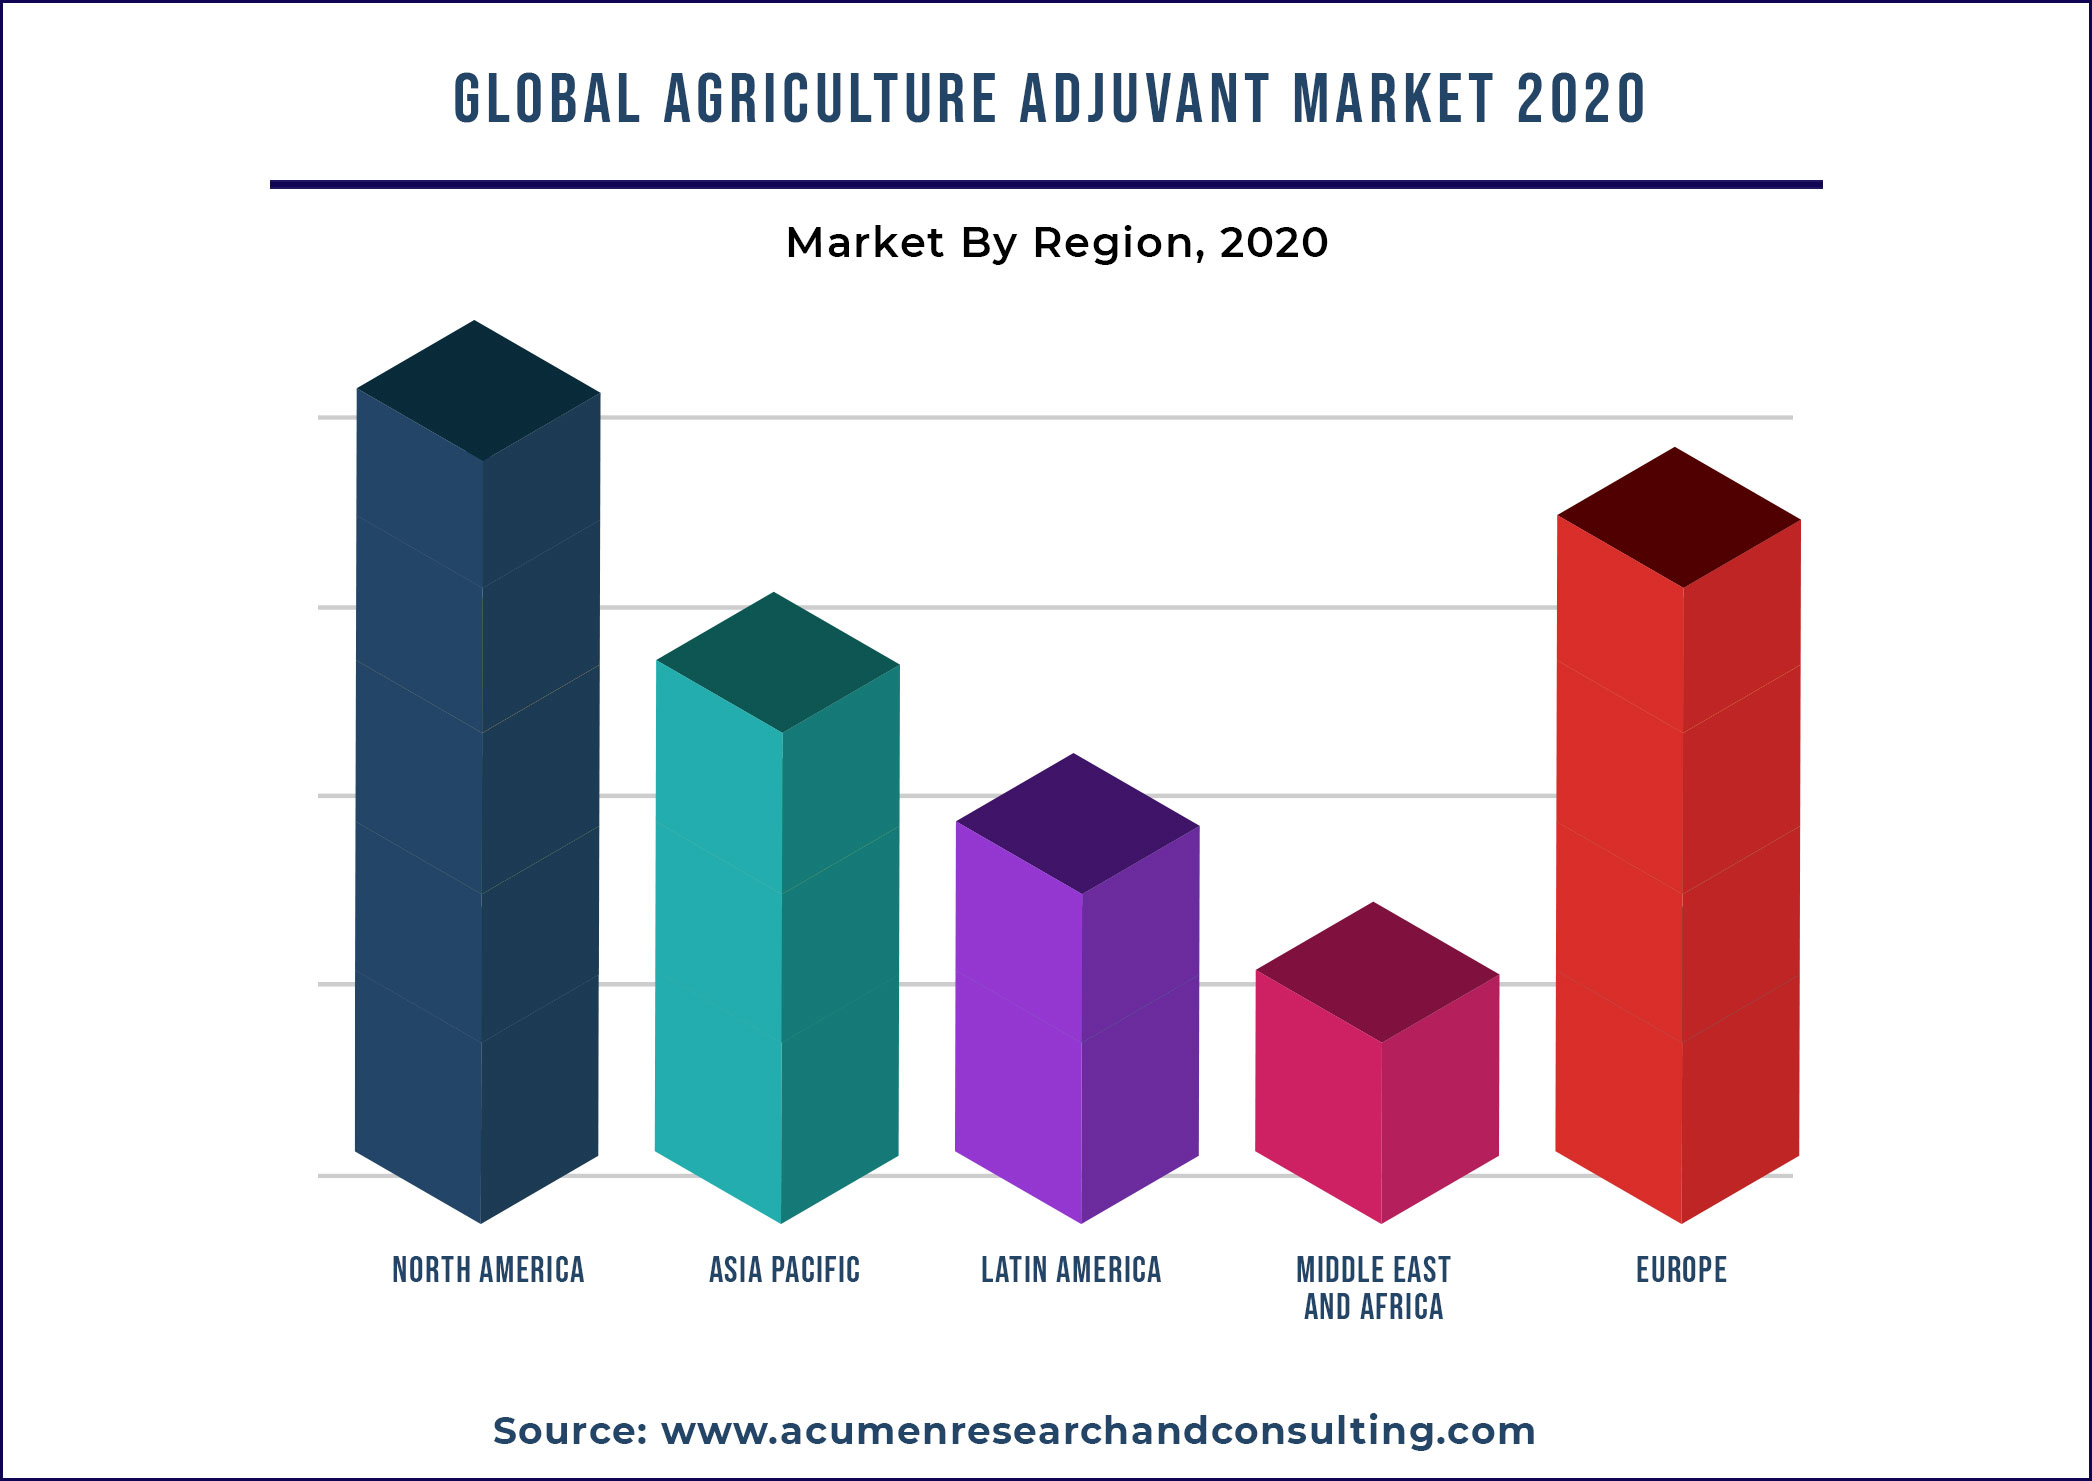
North America has dominated the agricultural adjuvant market since 2020 and will continue to do so throughout the forecast period, owing to a large consumer base for agrochemicals, which are primarily used as adjuvant. Canada is the fastest growing country in North America, contributing to the overall growth of the agricultural adjuvant market in this region.
Competitive Landscape
The prominent players of the global agricultural adjuvant market involve Clariant AG, AlzChem Group AG, DuPont de Nemours, Inc., Wilbur-Ellis Company Inc., Brandt Consolidated, Inc., BASF SE, Huntsman Corporation, and among others
Market Segmentation
Market By Function
Activator Adjuvant
Utility Adjuvant
- Compatibility Agents
- Buffers/Acidifiers
- Antifoam Agents
- Water Conditioning Agents
- Drift Control Agents
- Others
Market By Application
Herbicides
Insecticides
Fungicides
Others
Market By Formulation
Suspension Concentrate
Emulsifiable Concentrate
Market By Adoption Stage
Tank-Mix
In-Formulation
Market By Crop Type
Cereals and Grains
Fruits and Vegetables
Oilseeds and Pulses
Other Crops
Market By Geography
North America
• U.S.
• Canada
Europe
• U.K.
• Germany
• France
• Spain
• Rest of Europe
Asia-Pacific
• China
• Japan
• India
• Australia
• South Korea
• Rest of Asia-Pacific
Latin America
• Brazil
• Mexico
• Rest of Latin America
Middle East & Africa
• GCC
• South Africa
• Rest of Middle East & Africa
CHAPTER 1. Industry Overview of Agriculture Adjuvant
1.1. Definition and Scope
1.1.1. Definition of Agriculture Adjuvant
1.1.2. Market Segmentation
1.1.3. Years Considered for the Study
1.1.4. Assumptions and Acronyms Used
1.1.4.1. Market Assumptions and Market Forecast
1.1.4.2. Acronyms Used in Global Agriculture Adjuvant Market
1.2. Summary
1.2.1. Executive Summary
1.2.2. Agriculture Adjuvant Market By Function
1.2.3. Agriculture Adjuvant Market By Formulation
1.2.4. Agriculture Adjuvant Market By Adoption Stage
1.2.5. Agriculture Adjuvant Market By Application
1.2.6. Agriculture Adjuvant Market By Crop Type
1.2.7. Agriculture Adjuvant Market by Regions
CHAPTER 2. Research Approach
2.1. Methodology
2.1.1. Research Programs
2.1.2. Market Size Estimation
2.1.3. Market Breakdown and Data Triangulation
2.2. Data Source
2.2.1. Secondary Sources
2.2.2. Primary Sources
CHAPTER 3. Market Dynamics And Competition Analysis
3.1. Market Drivers
3.1.1. Driver 1
3.1.2. Driver 2
3.2. Restraints and Challenges
3.2.1. Restrain 1
3.2.2. Restrain 2
3.3. Growth Opportunities
3.3.1. Opportunity 1
3.3.2. Opportunity 2
3.4. Porter’s Five Forces Analysis
3.4.1. Bargaining Power of Suppliers
3.4.2. Bargaining Power of Buyers
3.4.3. Threat of Substitute
3.4.4. Threat of New Entrants
3.4.5. Degree of Competition
3.5. Regulatory Compliance
3.6. Competitive Landscape, 2019
3.6.1. Player Positioning Analysis
3.6.2. Key Strategies Adopted By Leading Players
CHAPTER 4. Agriculture Adjuvant Market By Function
4.1. Introduction
4.2. Agriculture Adjuvant Revenue By Function
4.2.1. Agriculture Adjuvant Revenue (US$ Mn) and Forecast, By Function, 2017-2028
4.2.2. Activator Adjuvant
4.2.2.1. Activator Adjuvant Market Revenue (US$ Mn) and Growth Rate (%), 2017-2028
4.2.2.2. Surfactants
4.2.2.2.1. Surfactants Market Revenue (US$ Mn) and Growth Rate (%), 2017-2028
4.2.2.3. Oil Adjuvant
4.2.2.3.1. Oil Adjuvant Market Revenue (US$ Mn) and Growth Rate (%), 2017-2028
4.2.3. Utility Adjuvant
4.2.3.1. Utility Adjuvant Market Revenue (US$ Mn) and Growth Rate (%), 2017-2028
4.2.3.2. Compatibility Agents
4.2.3.2.1. Compatibility Agents Market Revenue (US$ Mn) and Growth Rate (%), 2017-2028
4.2.3.3. Antifoam Agents
4.2.3.3.1. Antifoam Agents Market Revenue (US$ Mn) and Growth Rate (%), 2017-2028
4.2.3.4. Water Conditioning Agents
4.2.3.4.1. Water Conditioning Agents Market Revenue (US$ Mn) and Growth Rate (%), 2017-2028
4.2.3.5. Drift Control Agents
4.2.3.5.1. Drift Control Agents Market Revenue (US$ Mn) and Growth Rate (%), 2017-2028
4.2.3.6. Others
4.2.3.6.1. Others Market Revenue (US$ Mn) and Growth Rate (%), 2017-2028
CHAPTER 5. Agriculture Adjuvant Market Revenue By Formulation
5.1. Introduction
5.2. Agriculture Adjuvant Revenue (US$ Mn) By Formulation
5.2.1. Agriculture Adjuvant Revenue (US$ Mn) and Forecast By Formulation, 2017-2028
5.2.2. Herbicides
5.2.2.1. Herbicides Market Revenue (US$ Mn) and Growth Rate (%), 2017-2028
5.2.3. Insecticides
5.2.3.1. Insecticides Market Revenue (US$ Mn) and Growth Rate (%), 2017-2028
5.2.4. Fungicides
5.2.4.1. Fungicides Market Revenue (US$ Mn) and Growth Rate (%), 2017-2028
5.2.5. Others
5.2.5.1. Others Market Revenue (US$ Mn) and Growth Rate (%), 2017-2028
CHAPTER 6. Agriculture Adjuvant Market By Adoption Stage
6.1. Introduction
6.2. Agriculture Adjuvant Revenue (US$ Mn) By Adoption Stage
6.2.1. Agriculture Adjuvant Revenue (US$ Mn) and Forecast By Adoption Stage, 2017-2028
6.2.2. Suspension Concentrate
6.2.2.1. Suspension Concentrate Market Revenue (US$ Mn) and Growth Rate (%), 2017-2028
6.2.3. Emulsifiable Concentrate
6.2.3.1. Emulsifiable Concentrate Market Revenue (US$ Mn) and Growth Rate (%), 2017-2028
CHAPTER 7. Agriculture Adjuvant Market By Application
7.1. Introduction
7.2. Agriculture Adjuvant Revenue (US$) By Application
7.2.1. Agriculture Adjuvant Revenue (US$ Mn) and Forecast By Application, 2017-2028
7.3. Tank-Mix
7.3.1. Tank-Mix Market Revenue (US$ Mn) and Growth Rate (%), 2017-2028
7.4. In-Formulation
7.4.1. In-Formulation Market Revenue (US$ Mn) and Growth Rate (%), 2017-2028
CHAPTER 8. Agriculture Adjuvant Market By Crop Type
8.1. Introduction
8.2. Agriculture Adjuvant Revenue (US$) By Crop Type
8.2.1. Agriculture Adjuvant Revenue (US$ Mn) and Forecast By Crop Type, 2017-2028
8.3. Cereals and Grains
8.3.1. Cereals and Grains Market Revenue (US$ Mn) and Growth Rate (%), 2017-2028
8.4. Fruits and Vegetables
8.4.1. Fruits and Vegetables Market Revenue (US$ Mn) and Growth Rate (%), 2017-2028
8.5. Oilseeds and Pulses
8.5.1. Oilseeds and Pulses Market Revenue (US$ Mn) and Growth Rate (%), 2017-2028
8.6. Other Crops
8.6.1. Other Crops Market Revenue (US$ Mn) and Growth Rate (%), 2017-2028
CHAPTER 9. North America Agriculture Adjuvant Market By Country
9.1. North America Agriculture Adjuvant Overview
9.2. U.S.
9.2.1. U.S. Agriculture Adjuvant Market Revenue (US$ Mn) and Forecast By Function, 2017-2028
9.2.2. U.S. Agriculture Adjuvant Market Revenue (US$ Mn) and Forecast By Formulation, 2017-2028
9.2.3. U.S. Agriculture Adjuvant Market Revenue (US$ Mn) and Forecast By Adoption Stage, 2017-2028
9.2.4. U.S. Agriculture Adjuvant Market Revenue (US$ Mn) and Forecast By Application, 2017-2028
9.2.5. U.S. Agriculture Adjuvant Market Revenue (US$ Mn) and Forecast By Crop Type, 2017-2028
9.3. Canada
9.3.1. Canada Agriculture Adjuvant Market Revenue (US$ Mn) and Forecast By Function, 2017-2028
9.3.2. Canada Agriculture Adjuvant Market Revenue (US$ Mn) and Forecast By Formulation, 2017-2028
9.3.3. Canada Agriculture Adjuvant Market Revenue (US$ Mn) and Forecast By Adoption Stage, 2017-2028
9.3.4. Canada Agriculture Adjuvant Market Revenue (US$ Mn) and Forecast By Application, 2017-2028
9.3.5. Canada Agriculture Adjuvant Market Revenue (US$ Mn) and Forecast By Crop Type, 2017-2028
9.4. North America PEST Analysis
CHAPTER 10. Europe Agriculture Adjuvant Market By Country
10.1. Europe Agriculture Adjuvant Market Overview
10.2. U.K.
10.2.1. U.K. Agriculture Adjuvant Market Revenue (US$ Mn) and Forecast By Function, 2017-2028
10.2.2. U.K. Agriculture Adjuvant Market Revenue (US$ Mn) and Forecast By Formulation, 2017-2028
10.2.3. U.K. Agriculture Adjuvant Market Revenue (US$ Mn) and Forecast By Adoption Stage, 2017-2028
10.2.4. U.K. Agriculture Adjuvant Market Revenue (US$ Mn) and Forecast By Application, 2017-2028
10.2.5. U.K. Agriculture Adjuvant Market Revenue (US$ Mn) and Forecast By Crop Type, 2017-2028
10.3. Germany
10.3.1. Germany Agriculture Adjuvant Market Revenue (US$ Mn) and Forecast By Function, 2017-2028
10.3.2. Germany Agriculture Adjuvant Market Revenue (US$ Mn) and Forecast By Formulation, 2017-2028
10.3.3. Germany Agriculture Adjuvant Market Revenue (US$ Mn) and Forecast By Adoption Stage, 2017-2028
10.3.4. Germany Agriculture Adjuvant Market Revenue (US$ Mn) and Forecast By Application, 2017-2028
10.3.5. Germany Agriculture Adjuvant Market Revenue (US$ Mn) and Forecast By Crop Type, 2017-2028
10.4. France
10.4.1. France Agriculture Adjuvant Market Revenue (US$ Mn) and Forecast By Function, 2017-2028
10.4.2. France Agriculture Adjuvant Market Revenue (US$ Mn) and Forecast By Formulation, 2017-2028
10.4.3. France Agriculture Adjuvant Market Revenue (US$ Mn) and Forecast By Adoption Stage, 2017-2028
10.4.4. France Agriculture Adjuvant Market Revenue (US$ Mn) and Forecast By Application, 2017-2028
10.4.5. France Agriculture Adjuvant Market Revenue (US$ Mn) and Forecast By Crop Type, 2017-2028
10.5. Spain
10.5.1. Spain Agriculture Adjuvant Market Revenue (US$ Mn) and Forecast By Function, 2017-2028
10.5.2. Spain Agriculture Adjuvant Market Revenue (US$ Mn) and Forecast By Formulation, 2017-2028
10.5.3. Spain Agriculture Adjuvant Market Revenue (US$ Mn) and Forecast By Adoption Stage, 2017-2028
10.5.4. Spain Agriculture Adjuvant Market Revenue (US$ Mn) and Forecast By Application, 2017-2028
10.5.5. Spain Agriculture Adjuvant Market Revenue (US$ Mn) and Forecast By Crop Type, 2017-2028
10.6. Rest of Europe
10.6.1. Rest of Europe Agriculture Adjuvant Market Revenue (US$ Mn) and Forecast By Function, 2017-2028
10.6.2. Rest of Europe Agriculture Adjuvant Market Revenue (US$ Mn) and Forecast By Formulation, 2017-2028
10.6.3. Rest of Europe Agriculture Adjuvant Market Revenue (US$ Mn) and Forecast By Adoption Stage, 2017-2028
10.6.4. Rest of Europe Agriculture Adjuvant Market Revenue (US$ Mn) and Forecast By Application, 2017-2028
10.6.5. Rest of Europe Agriculture Adjuvant Market Revenue (US$ Mn) and Forecast By Crop Type, 2017-2028
10.7. Europe PEST Analysis
CHAPTER 11. Asia Pacific Agriculture Adjuvant Market By Country
11.1. Asia Pacific Agriculture Adjuvant Market Overview
11.2. China
11.2.1. China Agriculture Adjuvant Market Revenue (US$ Mn) and Forecast By Function, 2017-2028
11.2.2. China Agriculture Adjuvant Market Revenue (US$ Mn) and Forecast By Formulation, 2017-2028
11.2.3. China Agriculture Adjuvant Market Revenue (US$ Mn) and Forecast By Adoption Stage, 2017-2028
11.2.4. China Agriculture Adjuvant Market Revenue (US$ Mn) and Forecast By Application, 2017-2028
11.2.5. China Agriculture Adjuvant Market Revenue (US$ Mn) and Forecast By Crop Type, 2017-2028
11.3. Japan
11.3.1. Japan Agriculture Adjuvant Market Revenue (US$ Mn) and Forecast By Function, 2017-2028
11.3.2. Japan Agriculture Adjuvant Market Revenue (US$ Mn) and Forecast By Formulation, 2017-2028
11.3.3. Japan Agriculture Adjuvant Market Revenue (US$ Mn) and Forecast By Adoption Stage, 2017-2028
11.3.4. Japan Agriculture Adjuvant Market Revenue (US$ Mn) and Forecast By Application, 2017-2028
11.3.5. Japan Agriculture Adjuvant Market Revenue (US$ Mn) and Forecast By Crop Type, 2017-2028
11.4. India
11.4.1. India Agriculture Adjuvant Market Revenue (US$ Mn) and Forecast By Function, 2017-2028
11.4.2. India Agriculture Adjuvant Market Revenue (US$ Mn) and Forecast By Formulation, 2017-2028
11.4.3. India Agriculture Adjuvant Market Revenue (US$ Mn) and Forecast By Adoption Stage, 2017-2028
11.4.4. India Agriculture Adjuvant Market Revenue (US$ Mn) and Forecast By Application, 2017-2028
11.4.5. India Agriculture Adjuvant Market Revenue (US$ Mn) and Forecast By Crop Type, 2017-2028
11.5. Australia
11.5.1. Australia Agriculture Adjuvant Market Revenue (US$ Mn) and Forecast By Function, 2017-2028
11.5.2. Australia Agriculture Adjuvant Market Revenue (US$ Mn) and Forecast By Formulation, 2017-2028
11.5.3. Australia Agriculture Adjuvant Market Revenue (US$ Mn) and Forecast By Adoption Stage, 2017-2028
11.5.4. Australia Agriculture Adjuvant Market Revenue (US$ Mn) and Forecast By Application, 2017-2028
11.5.5. Australia Agriculture Adjuvant Market Revenue (US$ Mn) and Forecast By Crop Type, 2017-2028
11.6. South Korea
11.6.1. South Korea Agriculture Adjuvant Market Revenue (US$ Mn) and Forecast By Function, 2017-2028
11.6.2. South Korea Agriculture Adjuvant Market Revenue (US$ Mn) and Forecast By Formulation, 2017-2028
11.6.3. South Korea Agriculture Adjuvant Market Revenue (US$ Mn) and Forecast By Adoption Stage, 2017-2028
11.6.4. South Korea Agriculture Adjuvant Market Revenue (US$ Mn) and Forecast By Application, 2017-2028
11.6.5. South Korea Agriculture Adjuvant Market Revenue (US$ Mn) and Forecast By Crop Type, 2017-2028
11.7. Rest of Asia-Pacific
11.7.1. Rest of Asia-Pacific Agriculture Adjuvant Market Revenue (US$ Mn) and Forecast By Function, 2017-2028
11.7.2. Rest of Asia-Pacific Agriculture Adjuvant Market Revenue (US$ Mn) and Forecast By Formulation, 2017-2028
11.7.3. Rest of Asia-Pacific Agriculture Adjuvant Market Revenue (US$ Mn) and Forecast By Adoption Stage, 2017-2028
11.7.4. Rest of Asia-Pacific Agriculture Adjuvant Market Revenue (US$ Mn) and Forecast By Application, 2017-2028
11.7.5. Rest of Asia-Pacific Agriculture Adjuvant Market Revenue (US$ Mn) and Forecast By Crop Type, 2017-2028
11.8. Asia Pacific PEST Analysis
CHAPTER 12. Latin America Agriculture Adjuvant Market By Country
12.1. Latin America Agriculture Adjuvant Market Overview
12.2. Brazil
12.2.1. Brazil Agriculture Adjuvant Market Revenue (US$ Mn) and Forecast By Function, 2017-2028
12.2.2. Brazil Agriculture Adjuvant Market Revenue (US$ Mn) and Forecast By Formulation, 2017-2028
12.2.3. Brazil Agriculture Adjuvant Market Revenue (US$ Mn) and Forecast By Adoption Stage, 2017-2028
12.2.4. Brazil Agriculture Adjuvant Market Revenue (US$ Mn) and Forecast By Application, 2017-2028
12.2.5. Brazil Agriculture Adjuvant Market Revenue (US$ Mn) and Forecast By Crop Type, 2017-2028
12.3. Mexico
12.3.1. Mexico Agriculture Adjuvant Market Revenue (US$ Mn) and Forecast By Function, 2017-2028
12.3.2. Mexico Agriculture Adjuvant Market Revenue (US$ Mn) and Forecast By Formulation, 2017-2028
12.3.3. Mexico Agriculture Adjuvant Market Revenue (US$ Mn) and Forecast By Adoption Stage, 2017-2028
12.3.4. Mexico Agriculture Adjuvant Market Revenue (US$ Mn) and Forecast By Application, 2017-2028
12.3.5. Mexico Agriculture Adjuvant Market Revenue (US$ Mn) and Forecast By Crop Type, 2017-2028
12.4. Rest of Latin America
12.4.1. Rest of Latin America Agriculture Adjuvant Market Revenue (US$ Mn) and Forecast By Function, 2017-2028
12.4.2. Rest of Latin America Agriculture Adjuvant Market Revenue (US$ Mn) and Forecast By Formulation, 2017-2028
12.4.3. Rest of Latin America Agriculture Adjuvant Market Revenue (US$ Mn) and Forecast By Adoption Stage, 2017-2028
12.4.4. Rest of Latin America Agriculture Adjuvant Market Revenue (US$ Mn) and Forecast By Application, 2017-2028
12.4.5. Rest of Latin America Agriculture Adjuvant Market Revenue (US$ Mn) and Forecast By Crop Type, 2017-2028
12.5. Latin America PEST Analysis
CHAPTER 13. Middle East & Africa Agriculture Adjuvant Market By Country
13.1. Middle East & Africa Agriculture Adjuvant Market Overview
13.2. Saudi Arabia
13.2.1. Saudi Arabia Agriculture Adjuvant Market Revenue (US$ Mn) and Forecast By Function, 2017-2028
13.2.2. Saudi Arabia Agriculture Adjuvant Market Revenue (US$ Mn) and Forecast By Formulation, 2017-2028
13.2.3. Saudi Arabia Agriculture Adjuvant Market Revenue (US$ Mn) and Forecast By Adoption Stage, 2017-2028
13.2.4. Saudi Arabia Agriculture Adjuvant Market Revenue (US$ Mn) and Forecast By Application, 2017-2028
13.2.5. Saudi Arabia Agriculture Adjuvant Market Revenue (US$ Mn) and Forecast By Crop Type, 2017-2028
13.3. UAE
13.3.1. UAE Agriculture Adjuvant Market Revenue (US$ Mn) and Forecast By Function, 2017-2028
13.3.2. UAE Agriculture Adjuvant Market Revenue (US$ Mn) and Forecast By Formulation, 2017-2028
13.3.3. UAE Agriculture Adjuvant Market Revenue (US$ Mn) and Forecast By Adoption Stage, 2017-2028
13.3.4. UAE Agriculture Adjuvant Market Revenue (US$ Mn) and Forecast By Application, 2017-2028
13.3.5. UAE Agriculture Adjuvant Market Revenue (US$ Mn) and Forecast By Crop Type, 2017-2028
13.4. Rest of Middle East & Africa
13.4.1. Rest of Middle East & Africa Agriculture Adjuvant Market Revenue (US$ Mn) and Forecast By Function, 2017-2028
13.4.2. Rest of Middle East & Africa Agriculture Adjuvant Market Revenue (US$ Mn) and Forecast By Formulation, 2017-2028
13.4.3. Rest of Middle East & Africa Agriculture Adjuvant Market Revenue (US$ Mn) and Forecast By Adoption Stage, 2017-2028
13.4.4. Rest of Middle East & Africa Agriculture Adjuvant Market Revenue (US$ Mn) and Forecast By Application, 2017-2028
13.4.5. Rest of Middle East & Africa Agriculture Adjuvant Market Revenue (US$ Mn) and Forecast By Crop Type, 2017-2028
13.5. Middle East & Africa PEST Analysis
CHAPTER 14. Player Analysis Of Agriculture Adjuvant
14.1. Agriculture Adjuvant Market Company Share Analysis
14.2. Competition Matrix
14.2.1. Competitive Benchmarking of key players by price, presence, market share, and R&D investment
14.2.2. New Product Launches and Product Enhancements
14.2.3. Mergers And Acquisition In Global Agriculture Adjuvant Market
14.2.4. Partnership, Joint Ventures and Strategic Alliances/ Sales Agreements
CHAPTER 15. Company Profile
15.1. Clariant AG
15.1.1. Company Snapshot
15.1.2. Business Overview
15.1.3. Financial Overview
15.1.3.1. Revenue (US$ Mn), 2019
15.1.3.2. Clariant AG 2019 Agriculture Adjuvant Business Regional Distribution
15.1.4. Product/ Service and Specification
15.1.5. Recent Developments & Business Strategy
15.1.6. Manufacturing Plant Footprint Analysis
15.2. AlzChem Group AG
15.3. DuPont de Nemours, Inc.
15.4. Wilbur-Ellis Company Inc.
15.5. Brandt Consolidated, Inc.
15.6. BASF SE
15.7. Huntsman Corporation
15.8. Others