Zero Liquid Discharge Market Size - Global Industry, Share, Analysis, Trends and Forecast 2022 - 2030
Published :
Report ID:
Pages :
Format :
Zero Liquid Discharge Market Size - Global Industry, Share, Analysis, Trends and Forecast 2022 - 2030
Report Coverage
- Industry Dynamics
- Market Size and Forecast Data
- Segment Analysis
- Competitive Landscape
- Regional Analysis with a Niche Focus on Country-Level Data
- High Level Analysis - Porter's, PESTEL, Value Chain, etc.
- Company Profiles of Key Players
- Option to Customize the Report As Per Your Specific Need
Request Sample Report
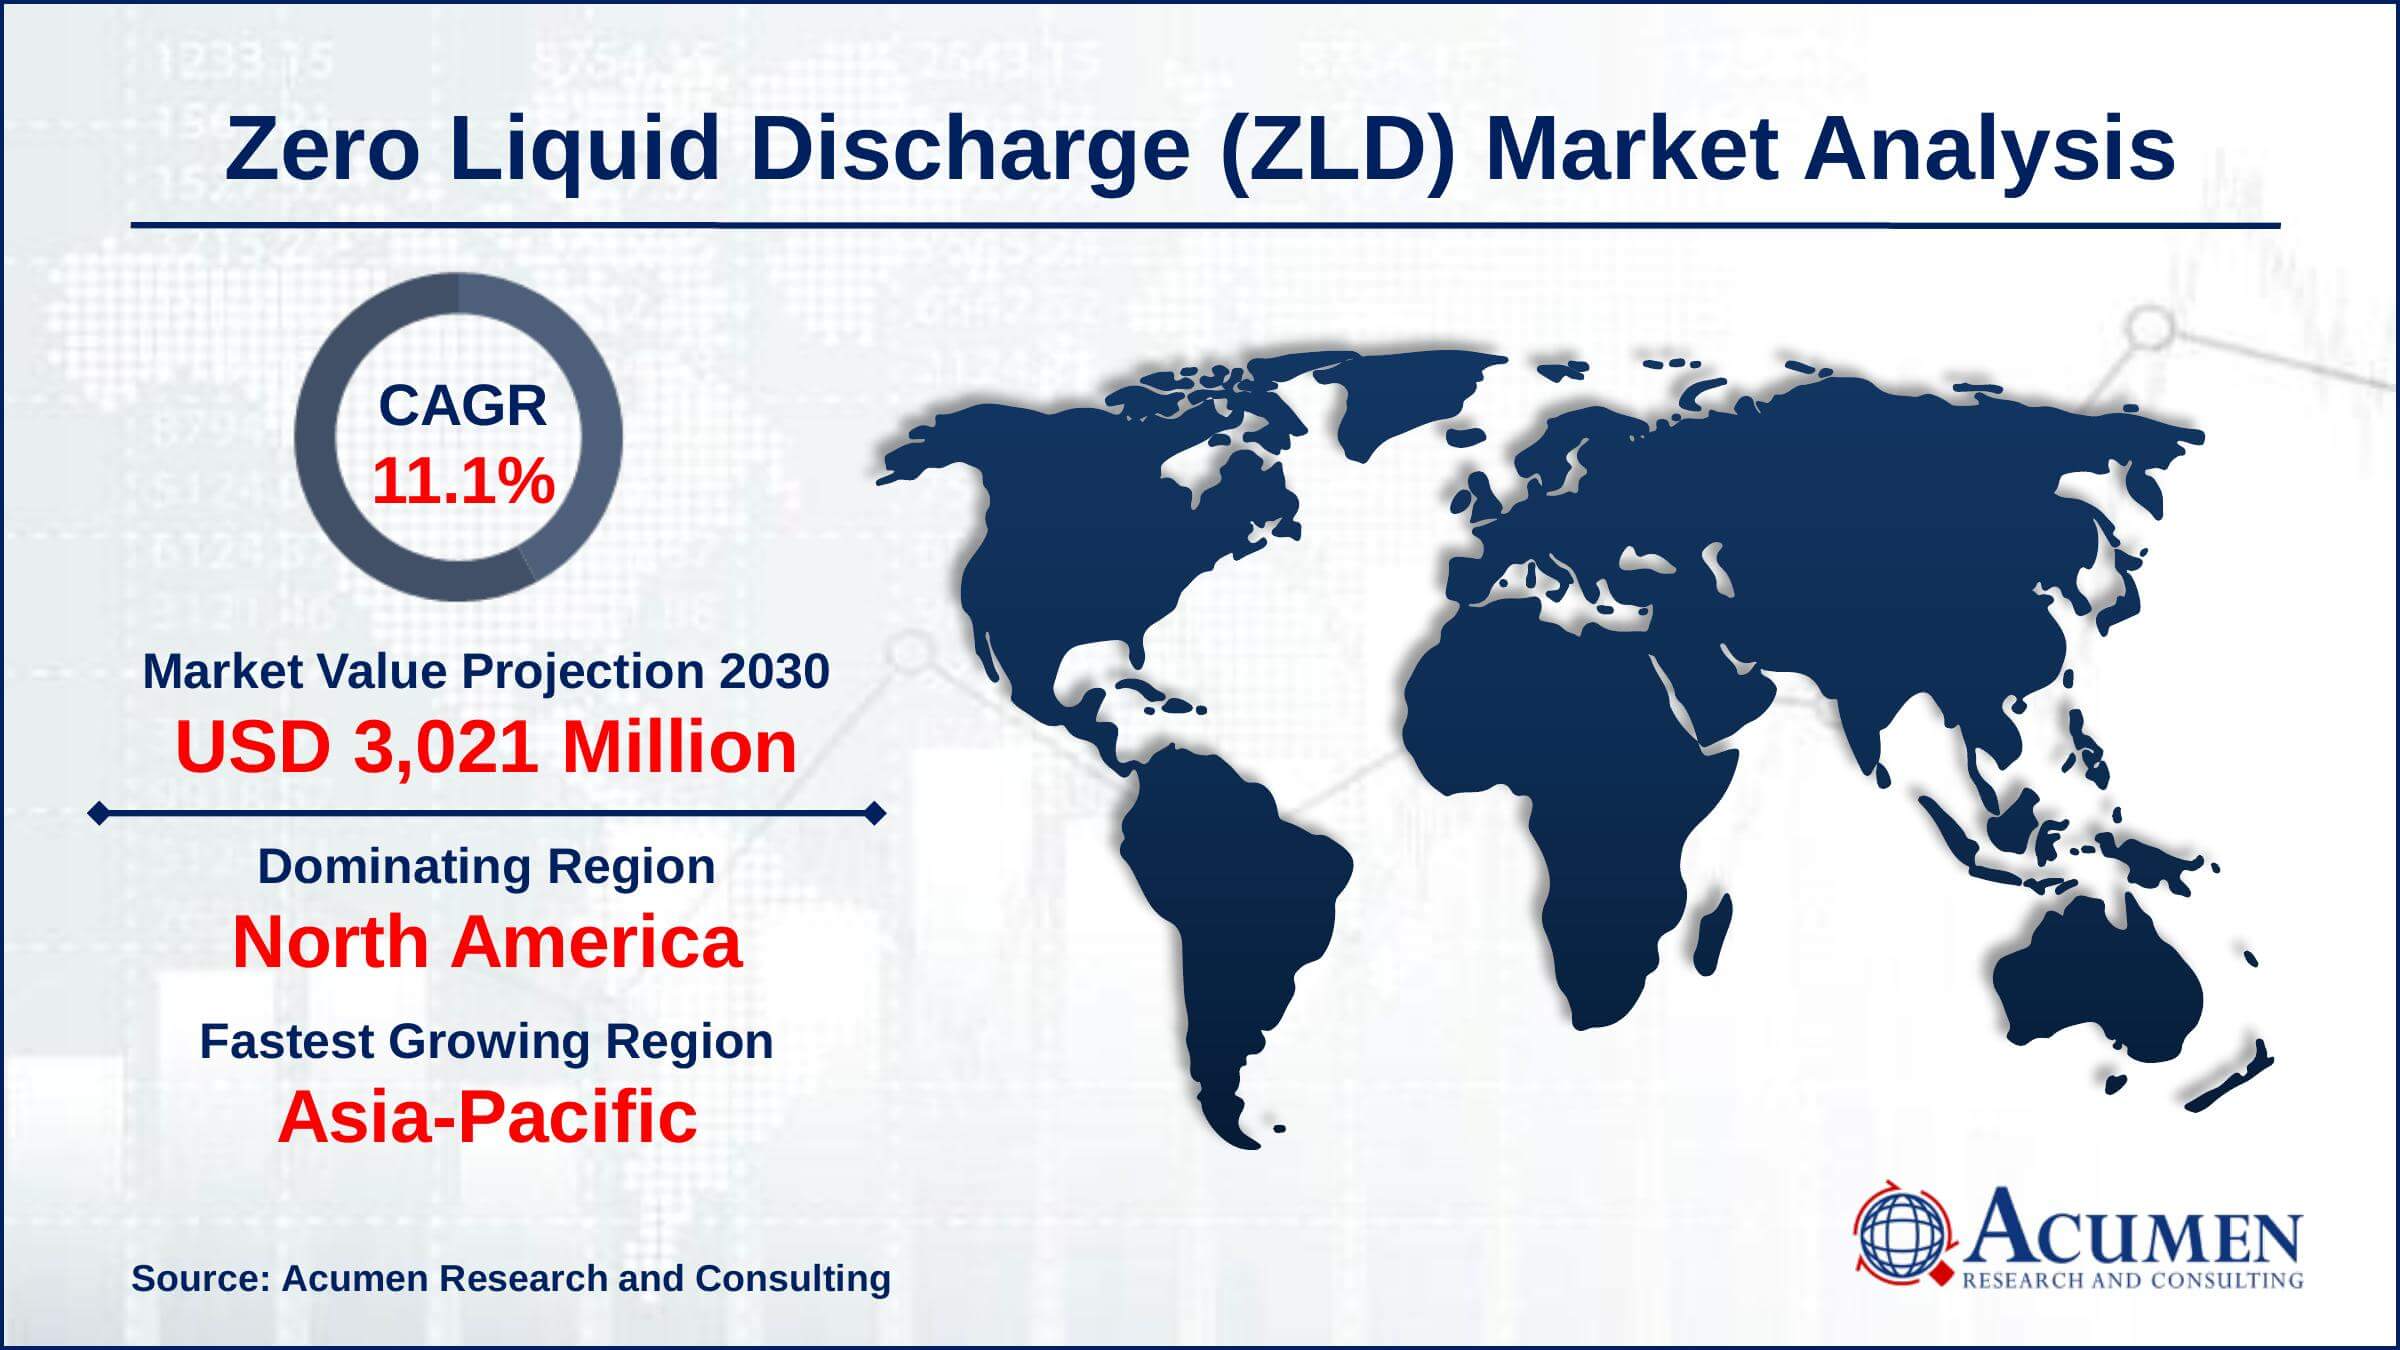
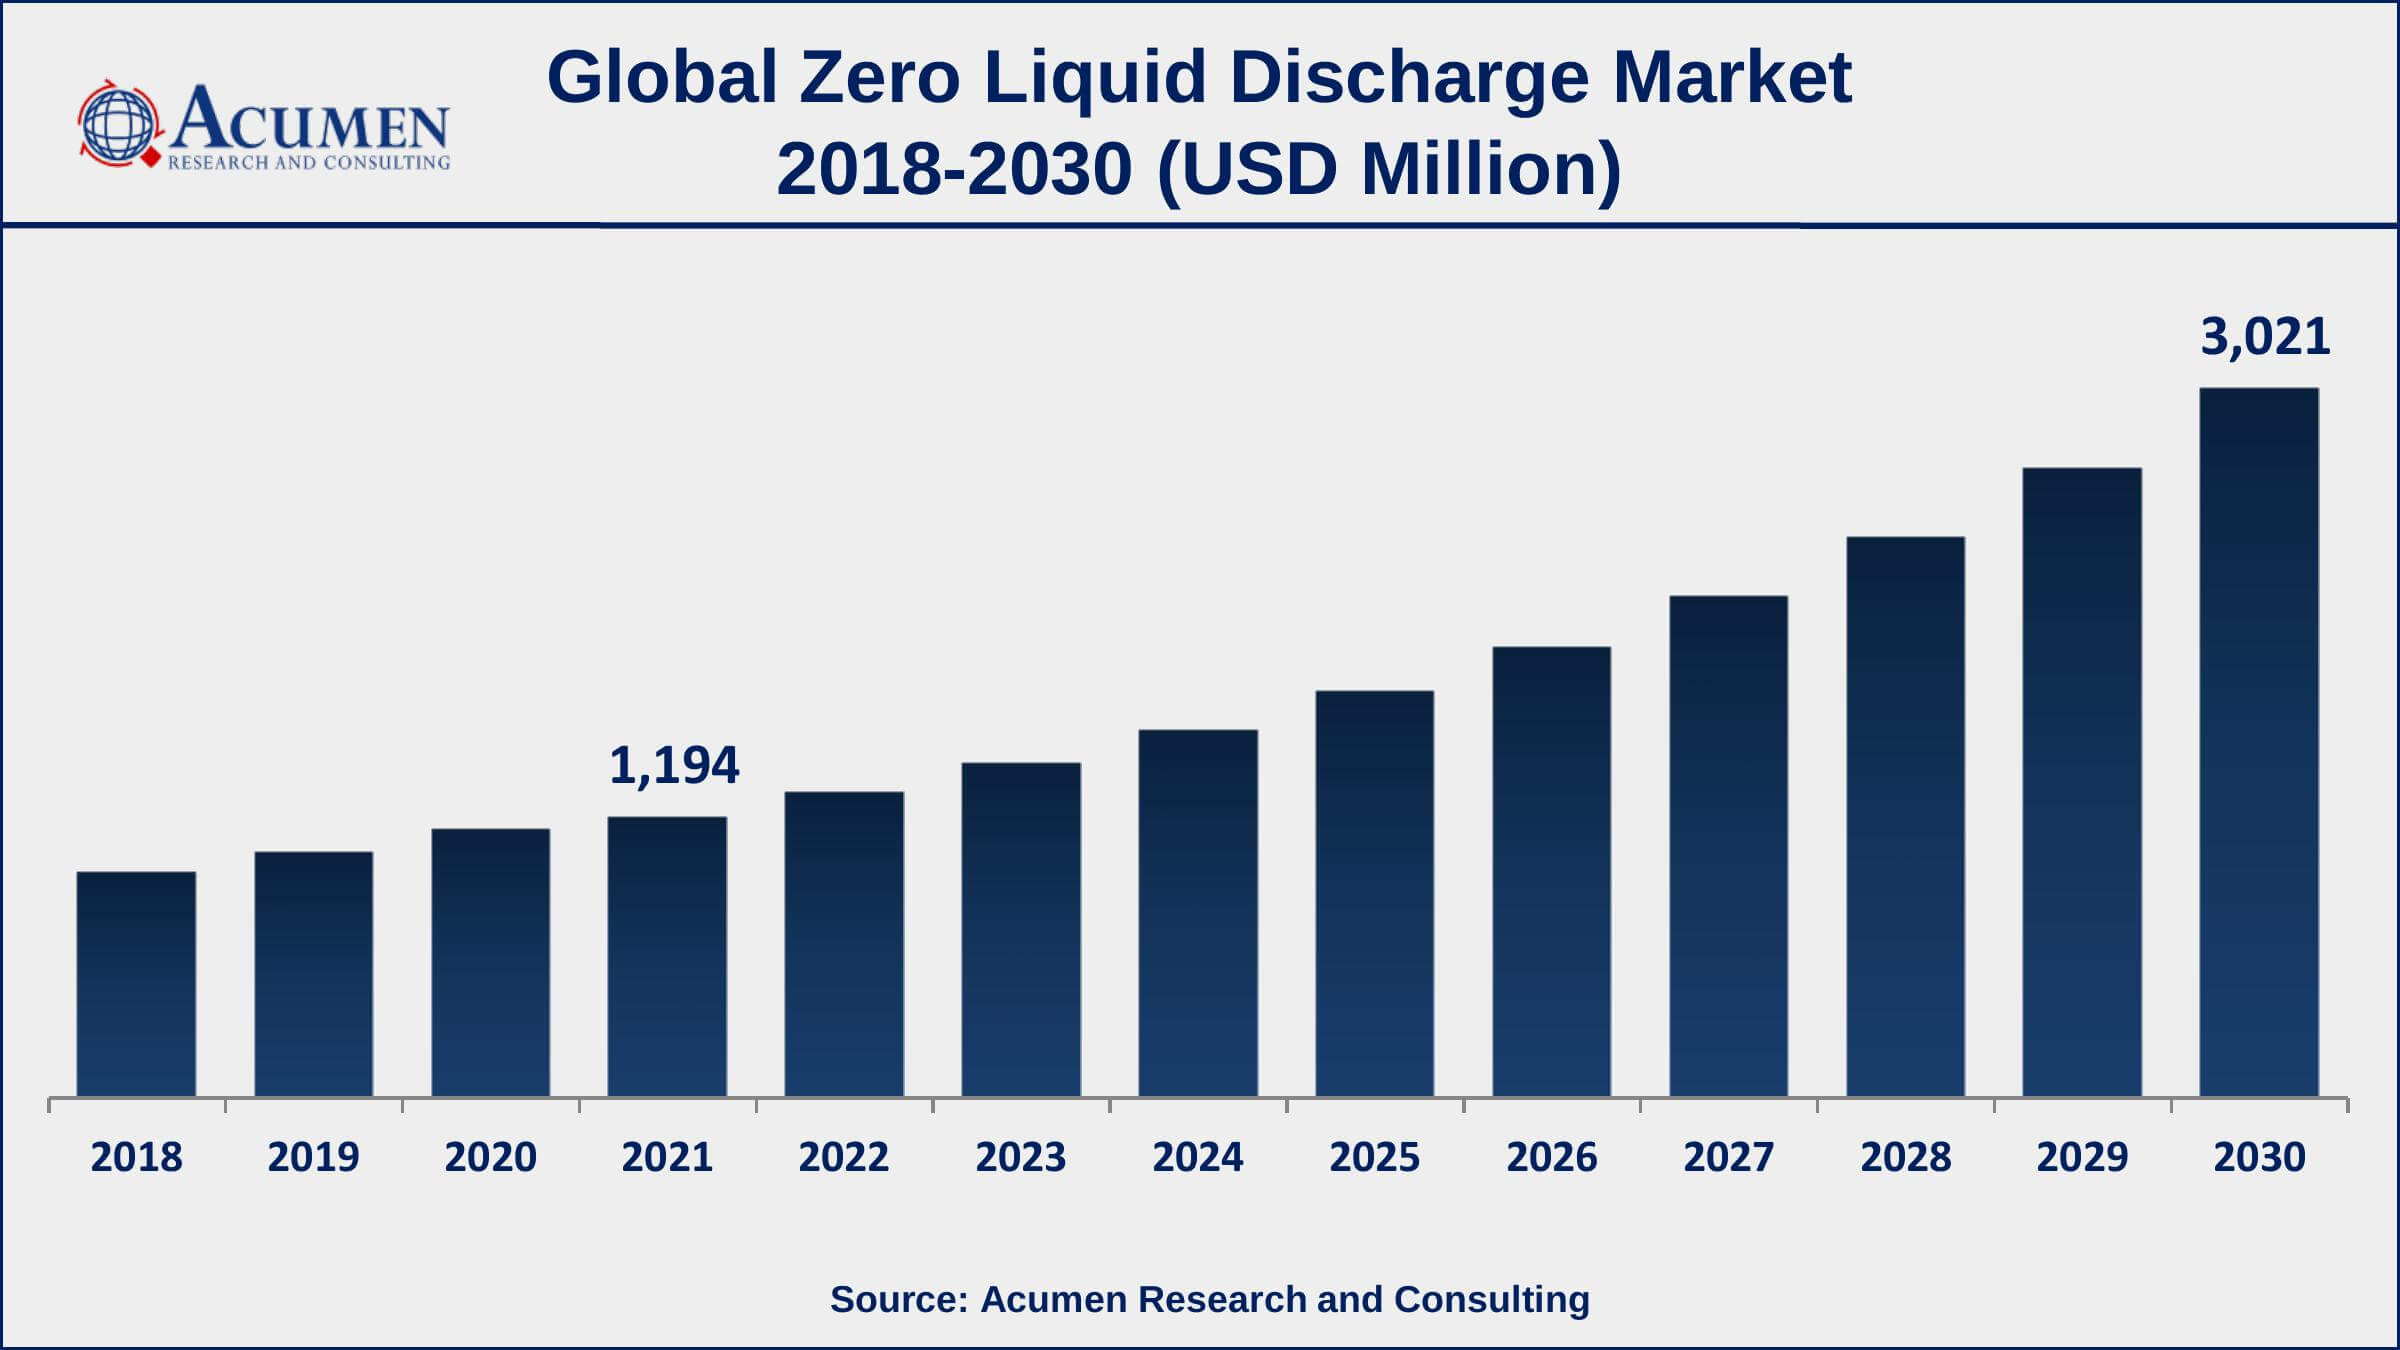
The Global Zero Liquid Discharge Market Size accounted for USD 1,194 Million in 2021 and is estimated to achieve a market size of USD 3,021 Million by 2030 growing at a CAGR of 11.1% from 2022 to 2030. The rapidly increasing demand for freshwater is one of the primary drivers propelling the zero liquid discharge market growth. Furthermore, the increasing use of desalination in various industrial sectors is expected to drive the worldwide zero liquid discharge market value during the forecast period.

Zero Liquid Discharge Market Report Key Highlights
- Global zero liquid discharge market revenue is estimated to expand by USD 3,021 million by 2030, with a 11.1% CAGR from 2022 to 2030.
- North America zero liquid discharge market share accounted for over 36% of total market shares in 2021
- Asia-Pacific zero liquid discharge market growth will observe highest CAGR from 2022 to 2030
- Based on technology, membrane-based segment accounted for over 58% of the overall market share in 2021
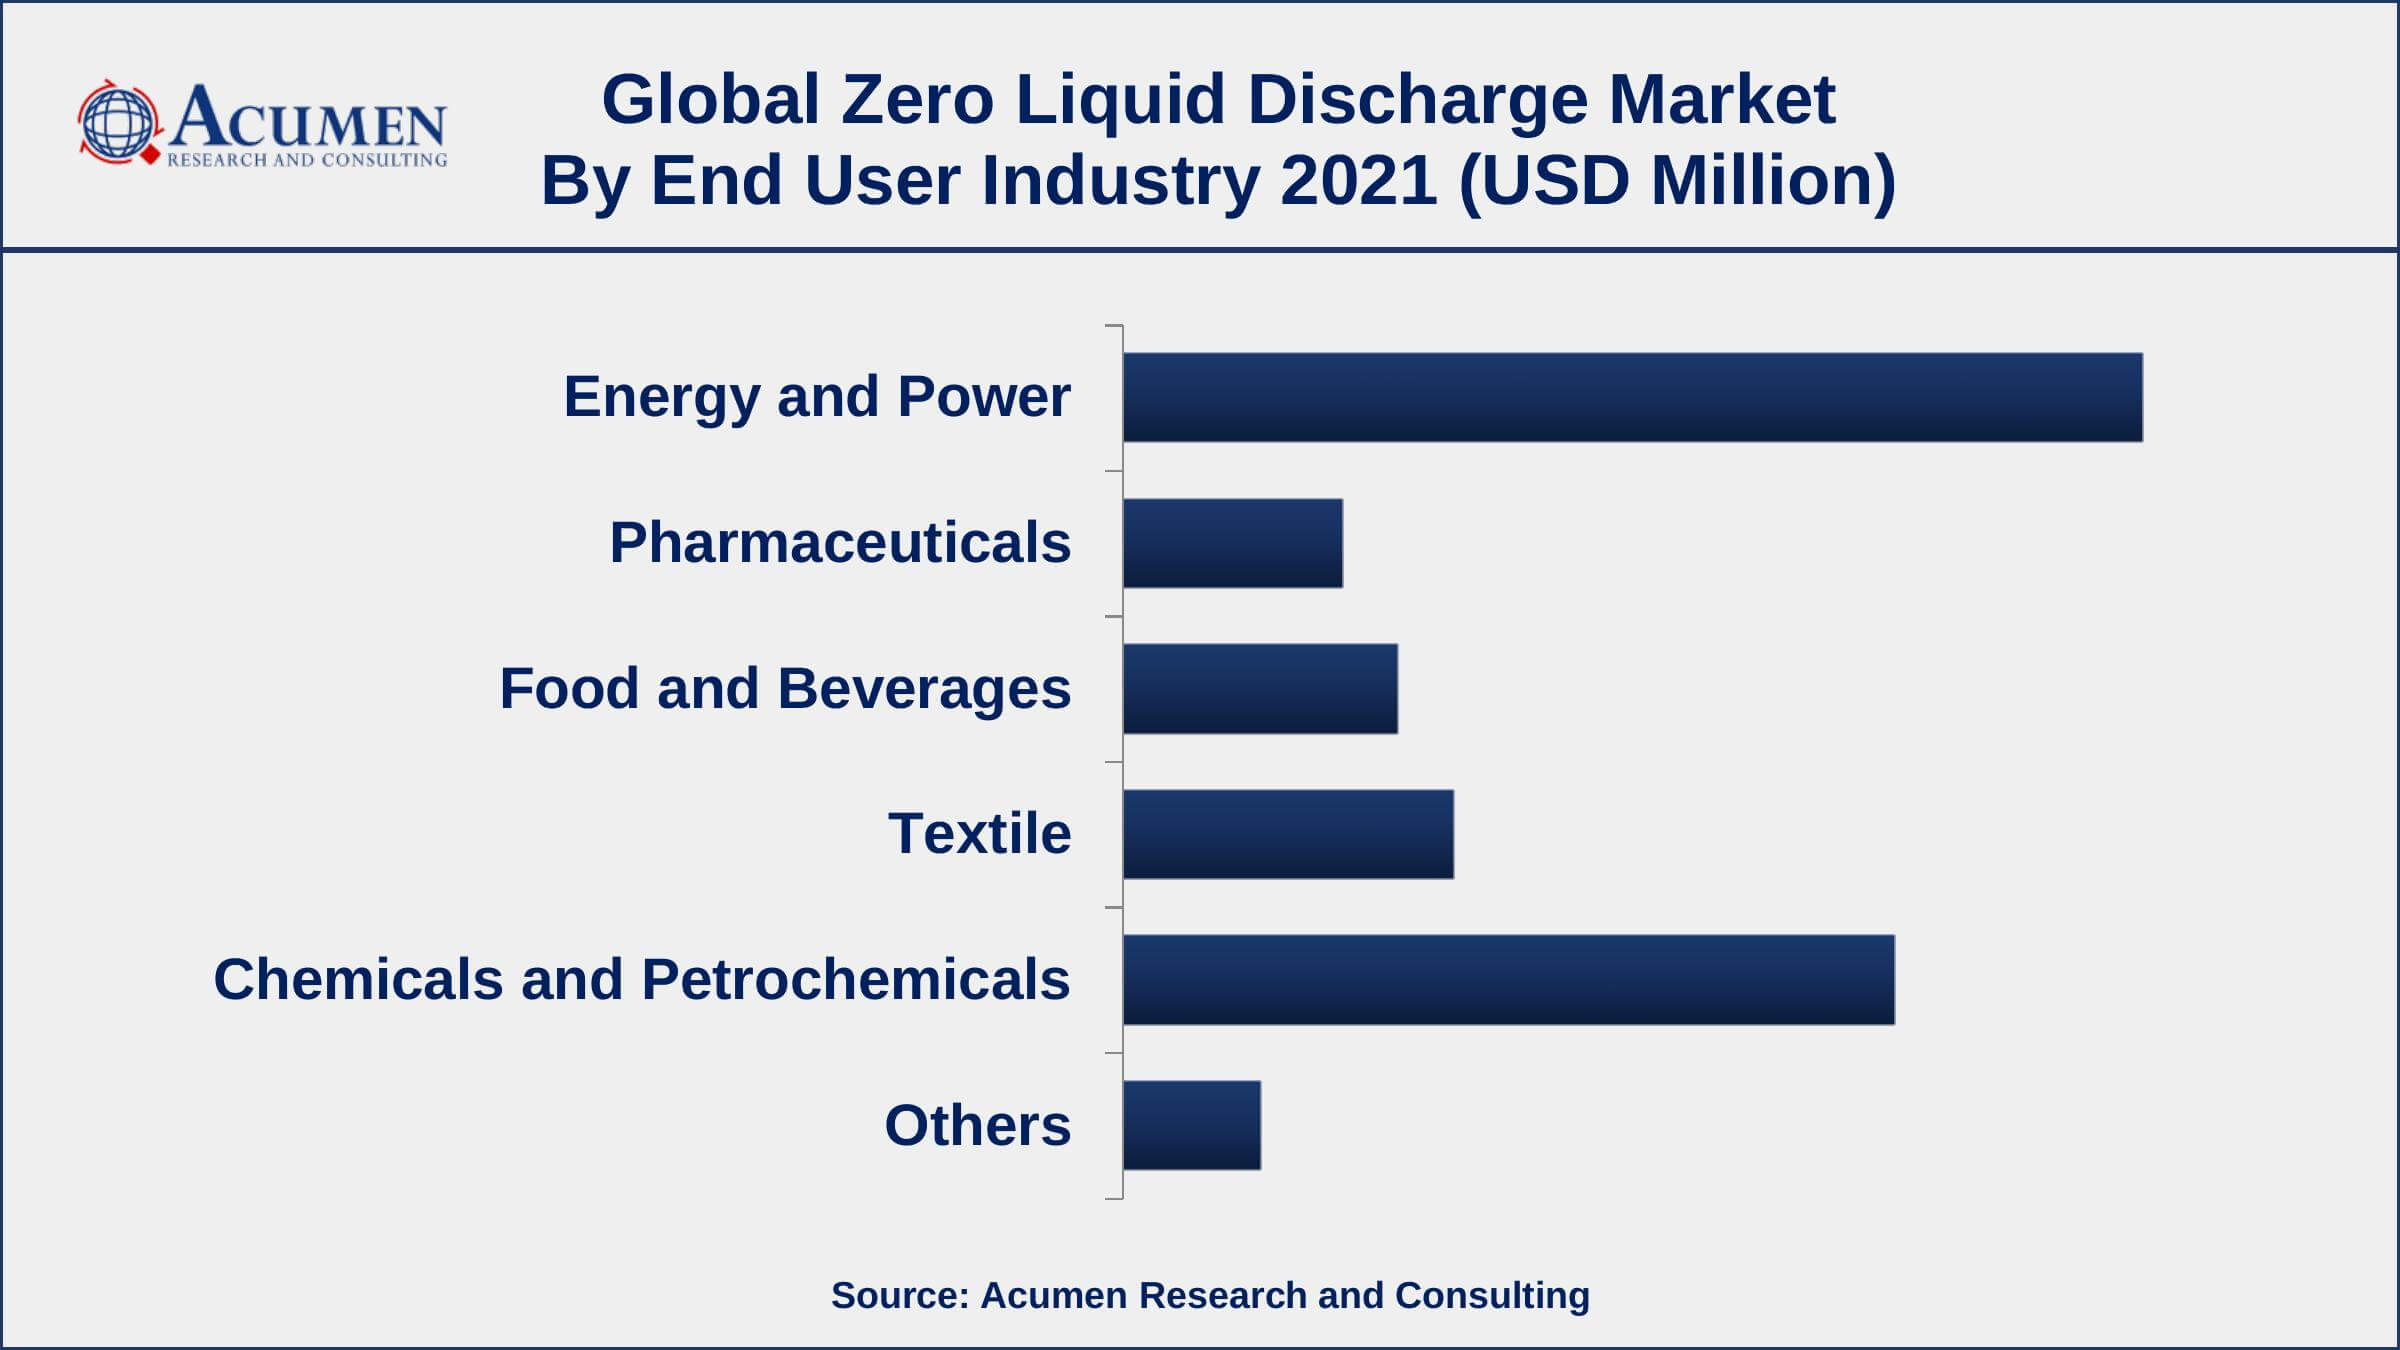
- Among end user industry, energy and power segment engaged more than 37% of the total market share
- Increasing application of desalination processes, drives the zero liquid discharge market size
The zero liquid discharge (ZLD) is a wastewater treatment process and it’s a combination of multiple processes including fractional electrode ionization, reverse osmosis, ultra filtration, and evaporation & crystallization. Using a zero liquid discharge process, recycling and purification of waste water are performed to a significant extent. Approximately 95% of water is reusable in nature when it is purified using the zero liquid discharge method.

Global Zero Liquid Discharge Market Trends
Market Drivers
- Inadequate availability of freshwater across the worldwide
- Rapidly increasing application of desalination processes
- Stringent regulations relating the discharge of particular solutes to water bodies
- Increased freshwater usage in industrial, residential, agricultural, and other sectors
Market Restraints
- High capital investment and operational costs
- availability of suitable alternatives
Market Opportunities
- Rising concern in the disposal of brine concentrate into seawater
- Recovery of precious minerals and chemicals from waste streams
Zero Liquid Discharge Market Report Coverage
| Market | Zero Liquid Discharge Market |
| Zero Liquid Discharge Market Size 2021 | USD 1,194 Million |
| Zero Liquid Discharge Market Forecast 2030 | USD 3,021 Million |
| Zero Liquid Discharge Market CAGR During 2022 - 2030 | 11.1% |
| Zero Liquid Discharge Market Analysis Period | 2018 - 2030 |
| Zero Liquid Discharge Market Base Year | 2021 |
| Zero Liquid Discharge Market Forecast Data | 2022 - 2030 |
| Segments Covered | By Technology, By End User Industry, And By Geography |
| Regional Scope | North America, Europe, Asia Pacific, Latin America, and Middle East & Africa |
| Key Companies Profiled | Aquatech International LLC, ENCON Evaporators, AQUARION AG, Veolia, Thermax Global, Transparent Energy System Private Ltd., Austro Chemicals & Bio Technologies Pvt Ltd, Bionics Advanced Filtration Systems (P) Ltd., GEA Group Aktiengesellschaft, Dew Envirotech Pvt. Ltd, Arvind Envisol Limited, ALFA LAVAL, 3V Green Eagle S.p.A., and Kelvin Water Technologies Pvt. Ltd. |
| Report Coverage |
Market Trends, Drivers, Restraints, Competitive Analysis, Player Profiling, Regulation Analysis |
The global zero liquid discharge market growth is majorly driven by the rising contamination of water utilities due to the disposal of brine concentrates. In addition, the growing demand from emerging economies backed by changing environmental conditions is also expected to fuel the zero liquid discharge (ZLD) market growth.
The rise in water consumption in industrial, residential, agricultural, and other areas is leading to the significant consumption of water resources and simultaneously generation of wastewater and contaminated water in the large amount. Also, the fact freshwater presence is very less almost 3% of the total water present on the earth's surface and this makes it one of the biggest challenges in front of humankind to retain the present resource and achieve sustainable growth for the future generation. In consideration of the above-mentioned factors, wastewater treatment and industrial wastewater recycling are becoming the only options left and this process is implemented using the systems such as zero liquid discharge. Also, due to the evolution in the wastewater treatment process over the past few years, this system has witnessed significant advancements in its functionalities and this has ultimately resulted in the availability of more reliable and efficient water treatment systems for different end-user industries. The governments of different nations are forcing them to process wastewater to eliminate toxins, and contamination, and clear the water content to a significant extent to control the waste of fresh water and maintain an environmental balance. The above-mentioned parameters are expected to fuel the ZLD market value.
Zero Liquid Discharge Market Segmentation
The worldwide zero liquid discharge market segmentation is based on the technology, end user industry, and geography.
Zero Liquid Discharge Market By Technology
- Thermal Based
- Membrane Based

According to zero liquid discharge industry analysis, a membrane-based system leads the market in 2021. This growth is due to improved operational efficiency and industrial preference for such installation compared to thermal-based deployment. The numerous processes utilized in membrane-based installations include reverse osmosis, electrodialysis, nanofiltration, as well as natural evaporation.
Zero Liquid Discharge Market By End User Industry
- Energy and Power
- Pharmaceuticals
- Food and Beverages
- Textile
- Chemicals and Petrochemicals
- Others

According to the zero liquid discharge market forecast, the energy and power segment is expected to grow significantly in the market over the next few years. The increasing population, combined with growing rapid urbanization, has contributed to increased energy consumption worldwide. This has resulted in the construction of more businesses and energy plants. Thermal power generation plants are the most common sector in which zero liquid discharge is used. Thermal power generation plants continue to provide a significant share of the energy supply, and this element undoubtedly promotes zero liquid discharge installations in the industries.
Zero Liquid Discharge Market Regional Outlook
North America
- U.S.
- Canada
Europe
- U.K.
- Germany
- France
- Spain
- Rest of Europe
Asia-Pacific
- India
- Japan
- China
- Australia
- South Korea
- Rest of Asia-Pacific
Latin America
- Brazil
- Mexico
- Rest of Latin America
The Middle East & Africa
- South Africa
- GCC Countries
- Rest of the Middle East & Africa (ME&A)
North America Holds The Largest Share Of The Global Zero Liquid Discharge Market
Among the segmented regions, the North America region is expected to hold the lion's share in the global zero liquid discharge market in 2021 and a similar trend is expected to continue over the forecast period. The region is expected to hold a high growth rate during the forecast period, owing to the increasing demand for zero liquid discharge from developed countries such as the US, Mexico, and Canada. Stringent government regulations are one of the key factors forcing the adoption of Zero Liquid Discharge in these countries. Europe is the second largest market for Zero Liquid Discharge due to the high demand for these systems across different industry verticals in this region. On the other hand, the Asia-Pacific region is expected to be the fastest-growing market in terms of demand for Zero Liquid Discharge over the forecast period and is anticipated to register the highest CAGR growth rate. The rapid industrialization and urbanization in developing economies such as India, China, and others present in this region are expected to fuel demand for Zero Liquid Discharge. Also, the increasing population in this region is creating issues such as scarcity of water in this region, and such parameters are expected to boost the demand for Zero Liquid Discharge is the Asia-Pacific region.
Zero Liquid Discharge Market Players
Some of the top zero liquid discharge market companies offered in the professional report include Aquatech International LLC, ENCON Evaporators, AQUARION AG, Veolia, Thermax Global, Transparent Energy System Private Ltd., Austro Chemicals & Bio Technologies Pvt Ltd, Bionics Advanced Filtration Systems (P) Ltd., GEA Group Aktiengesellschaft, Dew Envirotech Pvt. Ltd, Arvind Envisol Limited, ALFA LAVAL, 3V Green Eagle S.p.A., and Kelvin Water Technologies Pvt. Ltd.
Frequently Asked Questions
What is the size of global zero liquid discharge market in 2021?
The estimated value of global zero liquid discharge market in 2021 was accounted to be USD 1,194 Million.
What is the CAGR of global zero liquid discharge market during forecast period of 2022 to 2030?
The projected CAGR zero liquid discharge market during the analysis period of 2022 to 2030 is 11.1%.
Which are the key players operating in the market?
The prominent players of the global zero liquid discharge market are Aquatech International LLC, ENCON Evaporators, AQUARION AG, Veolia, Thermax Global, Transparent Energy System Private Ltd., Austro Chemicals & Bio Technologies Pvt Ltd, Bionics Advanced Filtration Systems (P) Ltd., GEA Group Aktiengesellschaft, Dew Envirotech Pvt. Ltd, Arvind Envisol Limited, ALFA LAVAL, 3V Green Eagle S.p.A., and Kelvin Water Technologies Pvt. Ltd.
Which region held the dominating position in the global zero liquid discharge market?
North America held the dominating zero liquid discharge during the analysis period of 2022 to 2030.
Which region registered the fastest growing CAGR for the forecast period of 2022 to 2030?
Asia-Pacific region exhibited fastest growing CAGR for zero liquid discharge during the analysis period of 2022 to 2030.
What are the current trends and dynamics in the global zero liquid discharge market?
Inadequate availability of freshwater and rapidly increasing application of desalination processes drives the growth of global zero liquid discharge market.
By end user industry segment, which sub-segment held the maximum share?
Based on end user industry, energy and power segment is expected to hold the maximum share of the zero liquid discharge market.


