Wearable Patch Market Size - Global Industry Share, Analysis, Trends and Forecast 2022 - 2030
Published :
Report ID:
Pages :
Format :
Wearable Patch Market Size - Global Industry Share, Analysis, Trends and Forecast 2022 - 2030
Report Coverage
- Industry Dynamics
- Market Size and Forecast Data
- Segment Analysis
- Competitive Landscape
- Regional Analysis with a Niche Focus on Country-Level Data
- High Level Analysis - Porter's, PESTEL, Value Chain, etc.
- Company Profiles of Key Players
- Option to Customize the Report As Per Your Specific Need
Request Sample Report
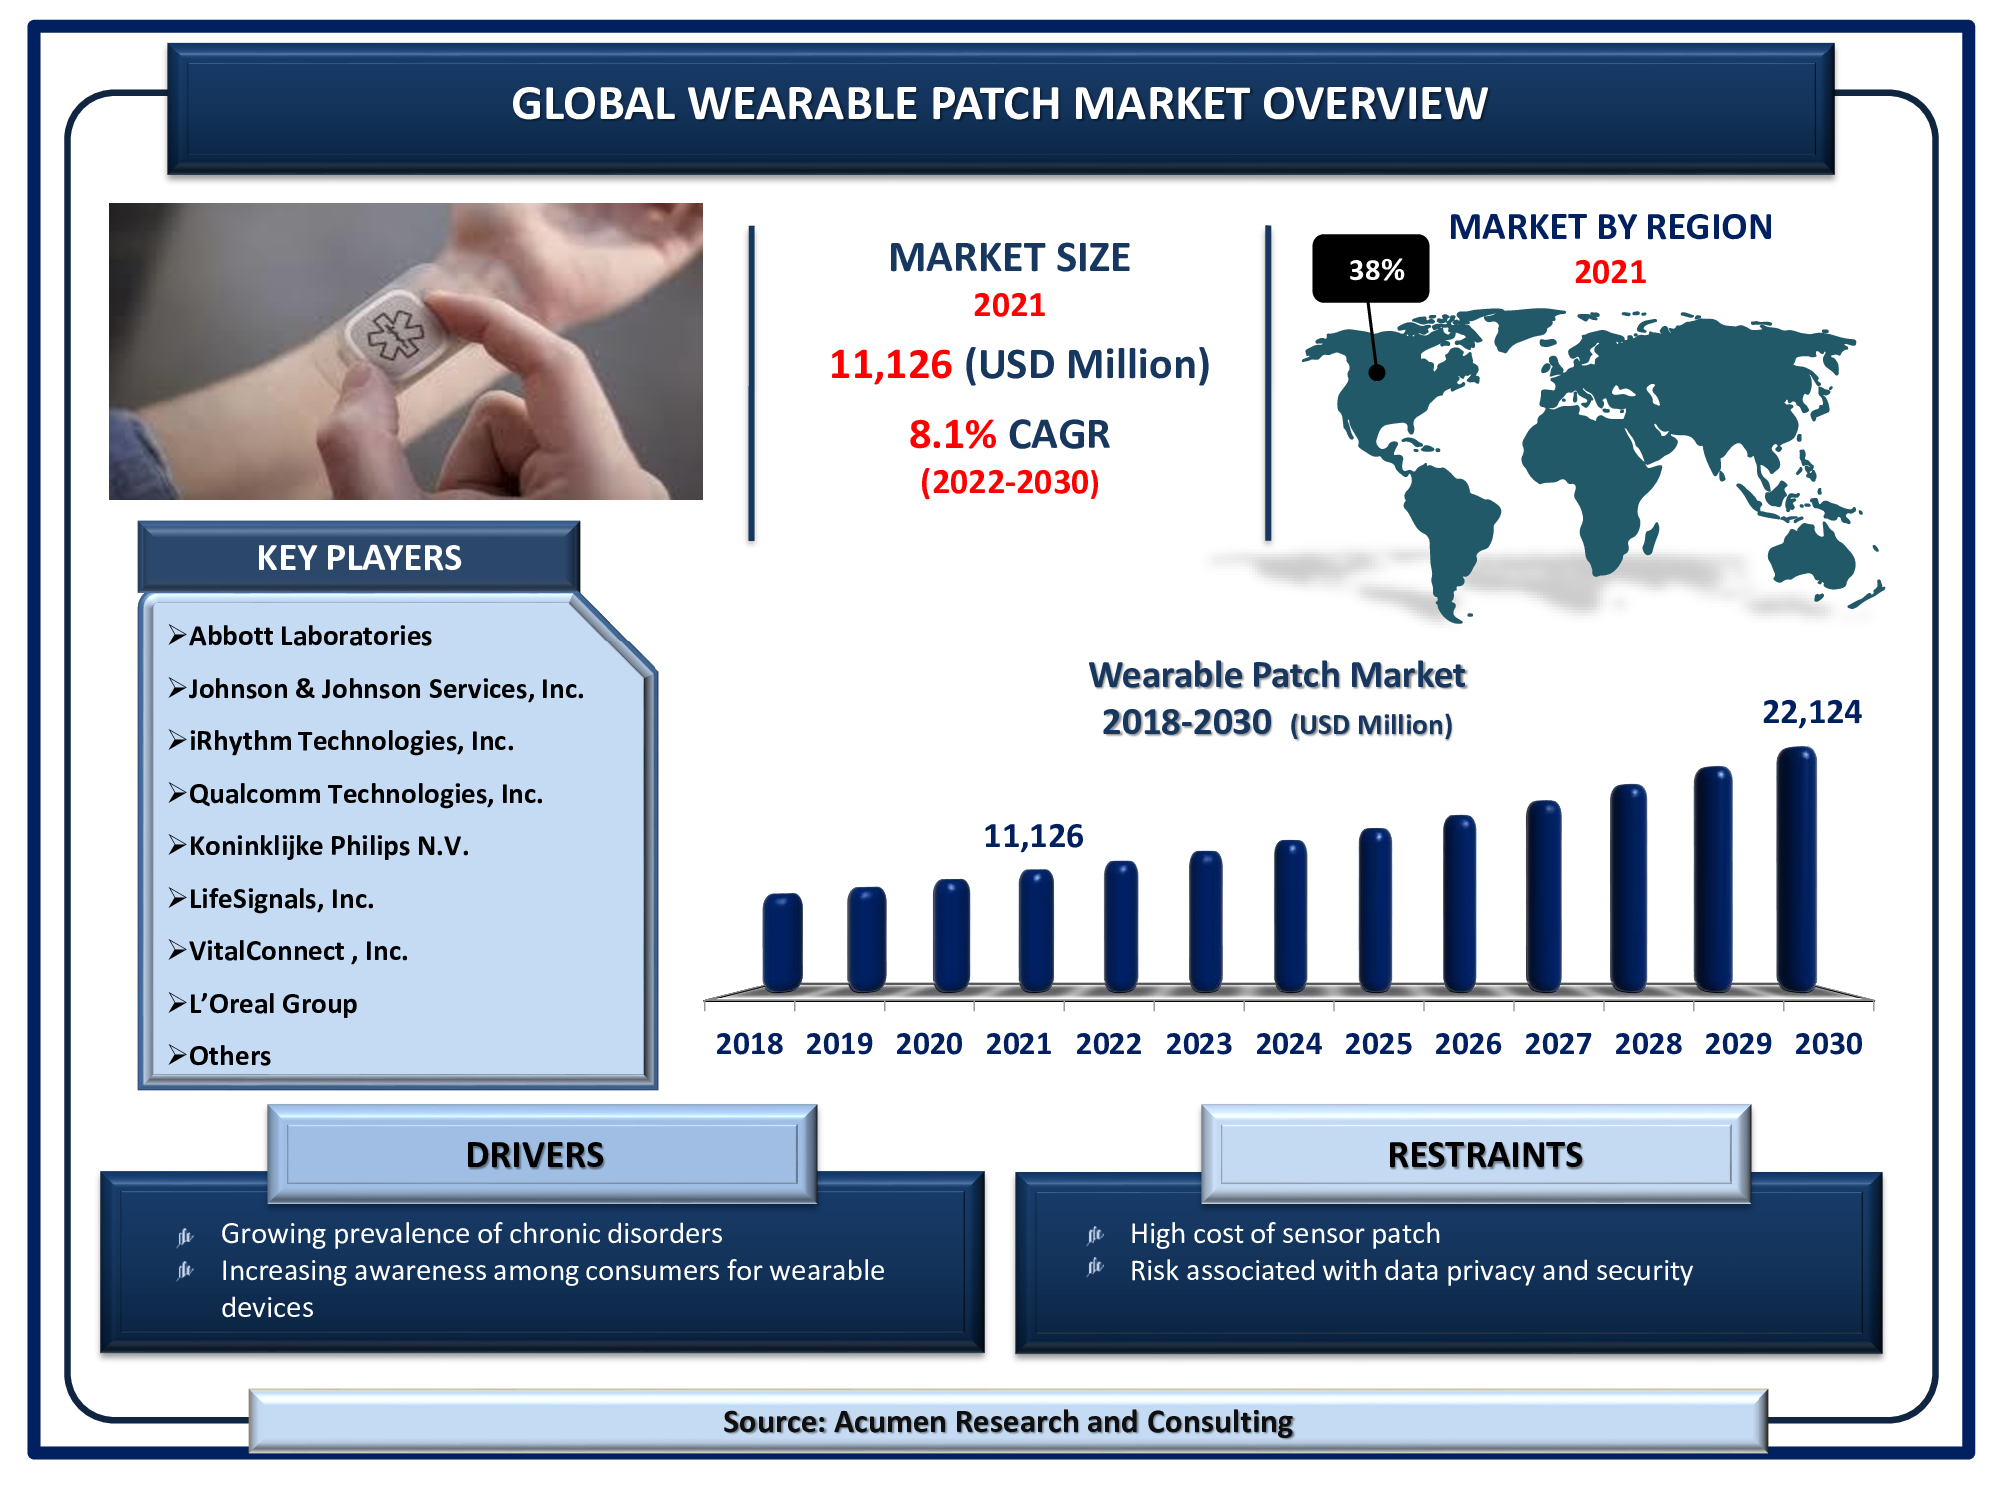
The Global Wearable Patch Market Size is valued at USD 11,126 million in 2021 and is estimated to achieve a market size of USD 22,124 million by 2030; growing at a CAGR of 8.1%.

During the last few years, there is a significant increase in the demand for wearable patches. Though, the market for connected wearable patches is in the initial stages of development but holds great promise and potential to improve the health of patients at a considerably low cost. Connected patches enable patients and providers to manage, diagnose, and treat patients in a simpler, more convenient, and quick way. Being convenient they are widely used by the geriatric population. Technological advancement has been made leading to the incorporation of sensors which has increased the accuracy, comfort, and demonstration in the clinical and non-clinical areas.
Global Wearable Patch Market DRO’s:
Market Drivers:
- Growing prevalence of chronic disorders
- Increasing awareness among consumers for wearable devices
- Rising technological advancements in wearable patches
Market Restraints:
- High cost of sensor patch
- Risk associated with data privacy and security
Market Opportunities:
- Growing adoption of telehealth
- Advent of remote patient monitoring
Wearable Patch Market Report Coverage:
| Market | Wearable Patch Market |
| Wearable Patch Market Size 2021 | USD 11,126 Million |
| Wearable Patch Market Forecast 2030 | USD 22,124 Million |
| Wearable Patch Market CAGR During 2022 - 2030 | 8.1% |
| Wearable Patch Market Analysis Period | 2018 - 2030 |
| Wearable Patch Market Base Year | 2021 |
| Wearable Patch Market Forecast Data | 2022 - 2030 |
| Segments Covered | By Type, By Application, By End-User, And By Region |
| Wearable Patch Market Regional Scope | North America, Europe, Asia Pacific, Latin America, and Middle East & Africa |
| Key Companies Profiled | Abbott Laboratories, Johnson & Johnson Services, Inc., iRhythm Technologies, Inc., Qualcomm Technologies, Inc., Koninklijke Philips N.V., LifeSignals, Inc., VitalConnect, Inc., L’Oreal Group, Medtronic plc (Zephyr Technology Corporation), and VivaLNK. |
| Report Coverage |
Market Trends, Drivers, Restraints, Competitive Analysis, Player Profiling, Regulation Analysis |
The global wearable patch market is majorly driven by the increasing prevalence of various chronic diseases like diabetes, cancer, immunological disease, and others. In 2014, according to the WHO, approximately 422 million people across the globe were suffering from diabetes. Additionally, increasing demand for a better and more convenient route of administration for the medication will support the growth of the market. Moreover, increasing awareness among the people, rising per capita income, and increased demand for better treatment options coupled with increasing government support have boosted the growth of the market during the forecast period. On the other hand, all drugs are not suitable for such mode of route of administration which is the major factor hindering the growth of the market.
Wearable Patch Market Segmentation
The market can be bifurcated on the basis of type, application, end-user, and region.
Wearable Patch Market by Type
- Connected
- Regular

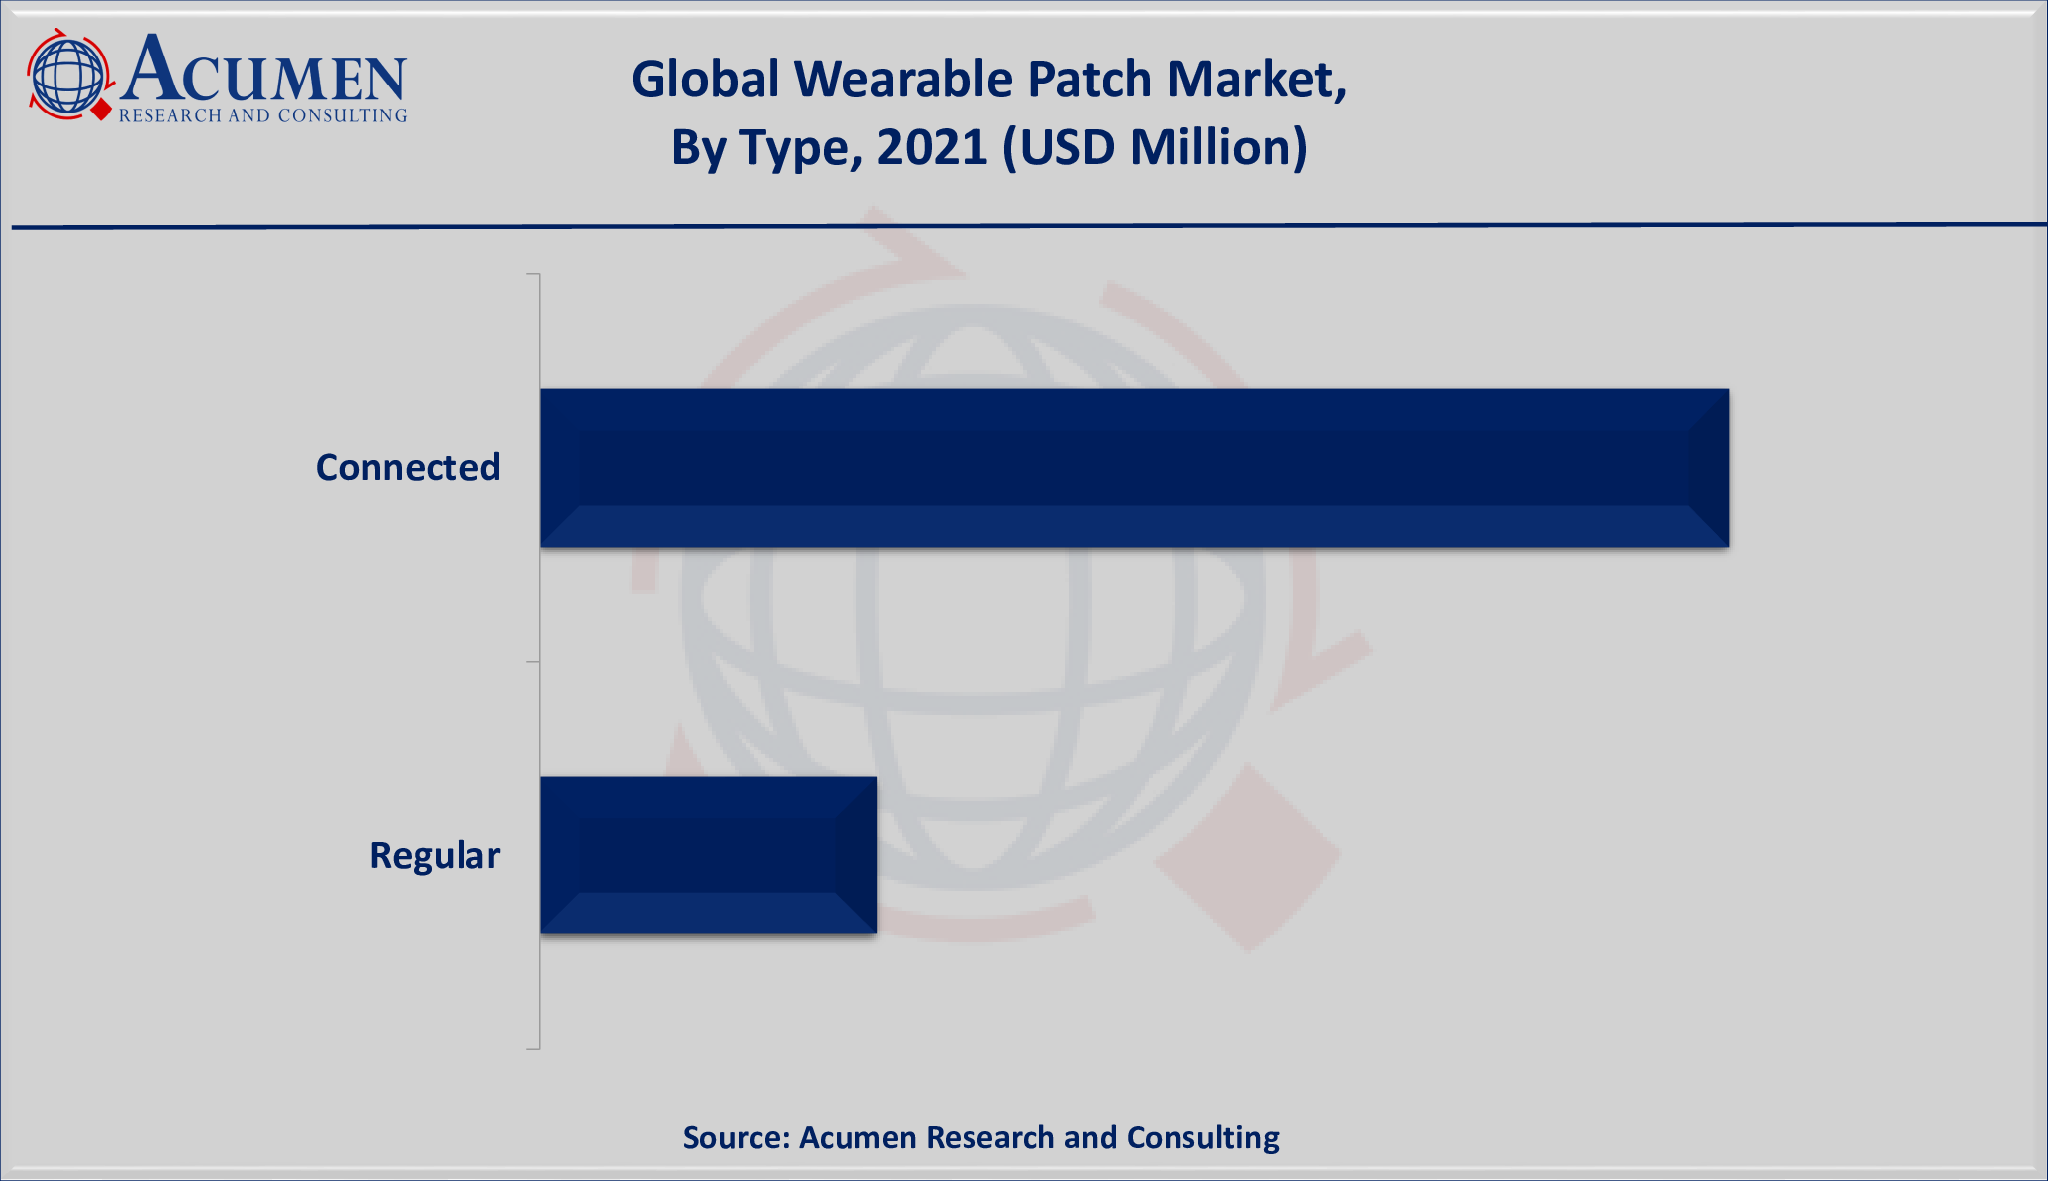
According to our wearable patch industry analysis, connected wearable patches sub-segment accounted for the majority of the share in 2021 and is expected to continue its trend during the projected timeframe 2022 – 2030. The growing prevalence of chronic disorders, and rapidly growing geriatric population are the two major factors driving the wearable patch market. Additionally, technological advances in the connected patches and surging demand for these products in technologically advanced nations are also supporting the connected wearable patch market.
Wearable Patch Market by Application
- Clinical
- Non-Clinical

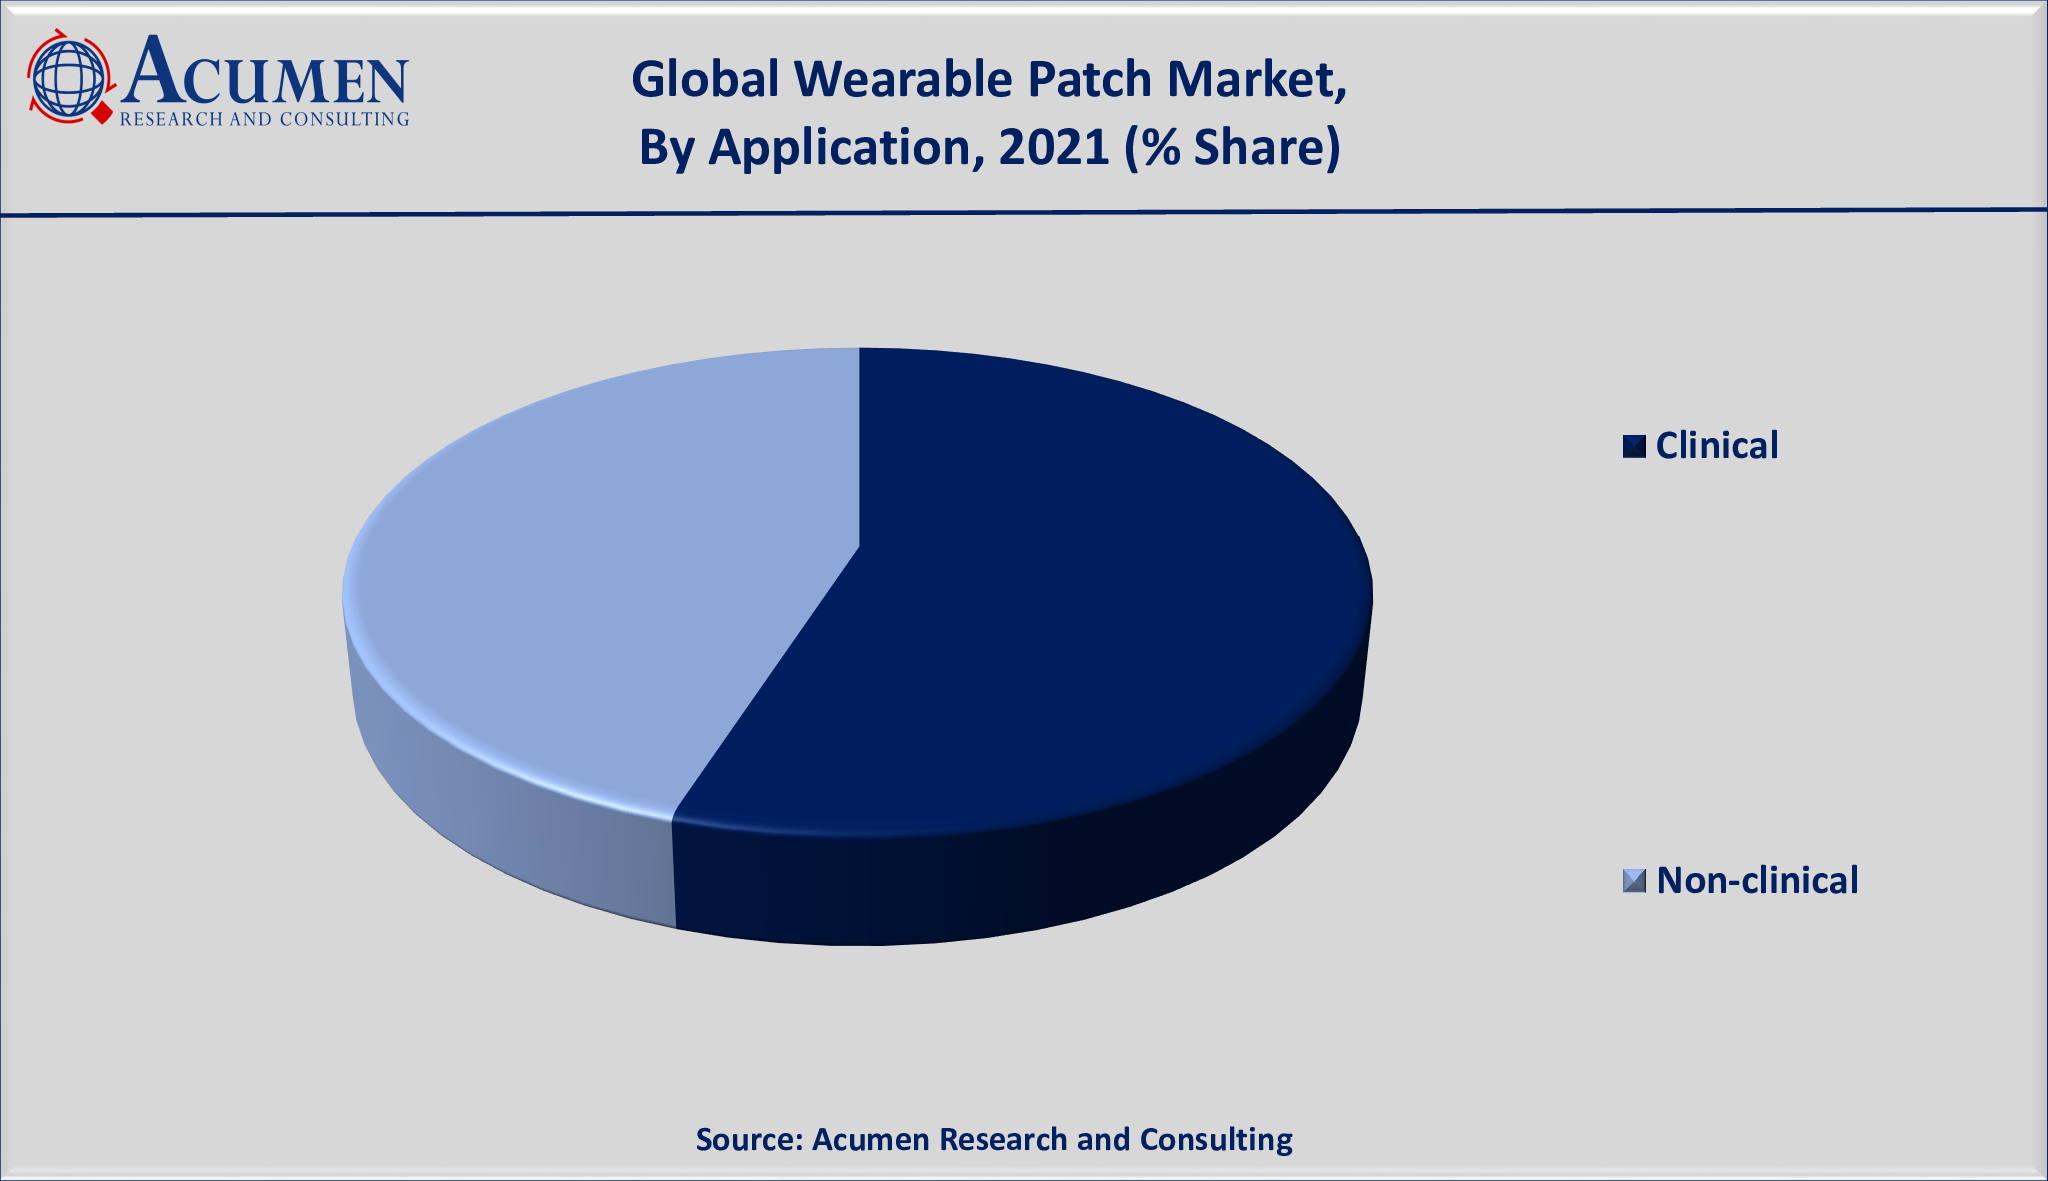
Among application, the clinical sub-segment gathered significant amount of share throughout the forecasted years from 2022 to 2030. The increasing base of patients, the surging awareness for wearables as a medical device, and rising investments in the research & development of wearable patch will spur the clinical application demand. Advent of COVID-19 pandemic has awakened more population about the importance of wearable patches and how they can measure blood pressure, SPO2, heart rate, and many other health activities.
Wearable Patch Market by End-User
- Hospital & Clinics
- Ambulatory Centers
- Others
According to our wearable patch market forecast, the hospital & clinics would capture a notable market share from 2022 to 2030. The majority of people visiting hospitals & clinics for health checkups is primarily driving the segmental growth. Presence of technologically advanced tools in hospitals, presence of expert healthcare providers, and supportive infrastructure to wearable patches are also supporting the hospitals & clinics segment in the coming future.
Wearable Patch Market Regional Outlook
North America
- U.S.
- Canada
Europe
- U.K.
- Germany
- France
- Spain
- Rest of Europe
Latin America
- Mexico
- Brazil
- Rest of Latin America
Asia-Pacific
- India
- Japan
- China
- Australia
- South Korea
- Rest of Asia-Pacific
The Middle East & Africa (MEA)
- Gulf Cooperation Council (GCC)
- South Africa
- Rest of the Middle East & Africa
Increasing prevalence of chronic diseases in US and Canada fuels the North America wearable patch market value
North America is expected to hold the major share of the market growth owing to the increasing demand for various medications and the increasing prevalence of the various diseases in this region. Additionally, well-developed technology and huge government support have supported the growth of the market. Europe accounts for the second leading position in the market followed by Asia-Pacific. The Asia-Pacific is estimated to be the fastest growing region during the forecast period owing to the presence of emerging economies, increasing government support, and rising per capita income of the people. China and India are the major contributors to the market. On the other hand, Latin America and the MEA are expected to witness steady growth owing to the poor economic condition and limited government support.
Wearable Patch Market Players
Some of the global wearable patch companies profiled in the report include Abbott Laboratories, Johnson & Johnson Services, Inc., iRhythm Technologies, Inc., Qualcomm Technologies, Inc., Koninklijke Philips N.V., LifeSignals, Inc., VitalConnect, Inc., L’Oreal Group, Medtronic plc (Zephyr Technology Corporation), and VivaLNK.
On May 20, 2022 – Koninklijke Philips N.V. received FDA clearance for its wearable biosensor (Philips Biosensor BX100) to help facilitate confirmed and suspected COVID-19 patients in the hospital. The lightweight, disposable biosensor is a single-use, 5-day wearable patch that can be linked to a configurable hub to monitor multiple patients in different rooms.
Frequently Asked Questions
How much was the size of the global wearable patch market in 2021?
The global wearable patch market size in 2021 was accounted to be USD 11,126 Million.
What will be the projected CAGR for global wearable patch market during forecast period of 2022 to 2030?
The projected CAGR wearable patch market during the analysis period of 2022 to 2030 is 8.1%.
Which are the prominent competitors operating in the market?
The prominent players of the global wearable patch market are Abbott Laboratories, Johnson & Johnson Services, Inc., iRhythm Technologies, Inc., Qualcomm Technologies, Inc., Koninklijke Philips N.V., LifeSignals, Inc., VitalConnect, Inc., L�Oreal Group, Medtronic plc (Zephyr Technology Corporation), and VivaLNK.
Which region held the dominating position in the global wearable patch market?
North America held the dominating wearable patch during the analysis period of 2022 to 2030.
Which region exhibited the fastest growing CAGR for the forecast period of 2022 to 2030?
Asia-Pacific region exhibited fastest growing CAGR for wearable patch during the analysis period of 2022 to 2030.
What are the current trends and dynamics in the global wearable patch market?
Growing prevalence of chronic disorders, increasing awareness among consumers for wearable devices, and rising technological advancements in wearable patches drives the growth of global wearable patch market.
By type segment, which sub-segment held the maximum share?
Based on type, connected segment held the maximum share wearable patch market in 2021.


