The global virtual desktop infrastructure (VDI) market accounted for US$ 14,961 Mn in 2021 and is expected to reach US$ 78,163 Mn by 2030 with a considerable CAGR of 20.5% during the forecast timeframe of 2022 to 2030.
Virtual desktop infrastructure (VDI) refers to the use of virtual servers to supply and manage virtual displays. VDI provides central software applications and makes them accessible to end-users on demand. It has a number of advantages, including enhanced accessibility, mobility support, versatility, and privacy. Its modestly improved capabilities previously made it difficult and costly to integrate into older systems, making it more difficult for many organizations. However, the growing corporate acceptance of hyper-converged infrastructures offers a solution that provides scalability and high performance at a lower cost. VDI manages desktops on the main system and delivers them to target consumer’s on-demand over an access point using an endpoint device such as a laptop, laptop, tablet, or smartphone. The widespread adoption of cloud computing services, and advancements in virtualization technologies, are expected to drive the rise of the virtual desktop infrastructure market.
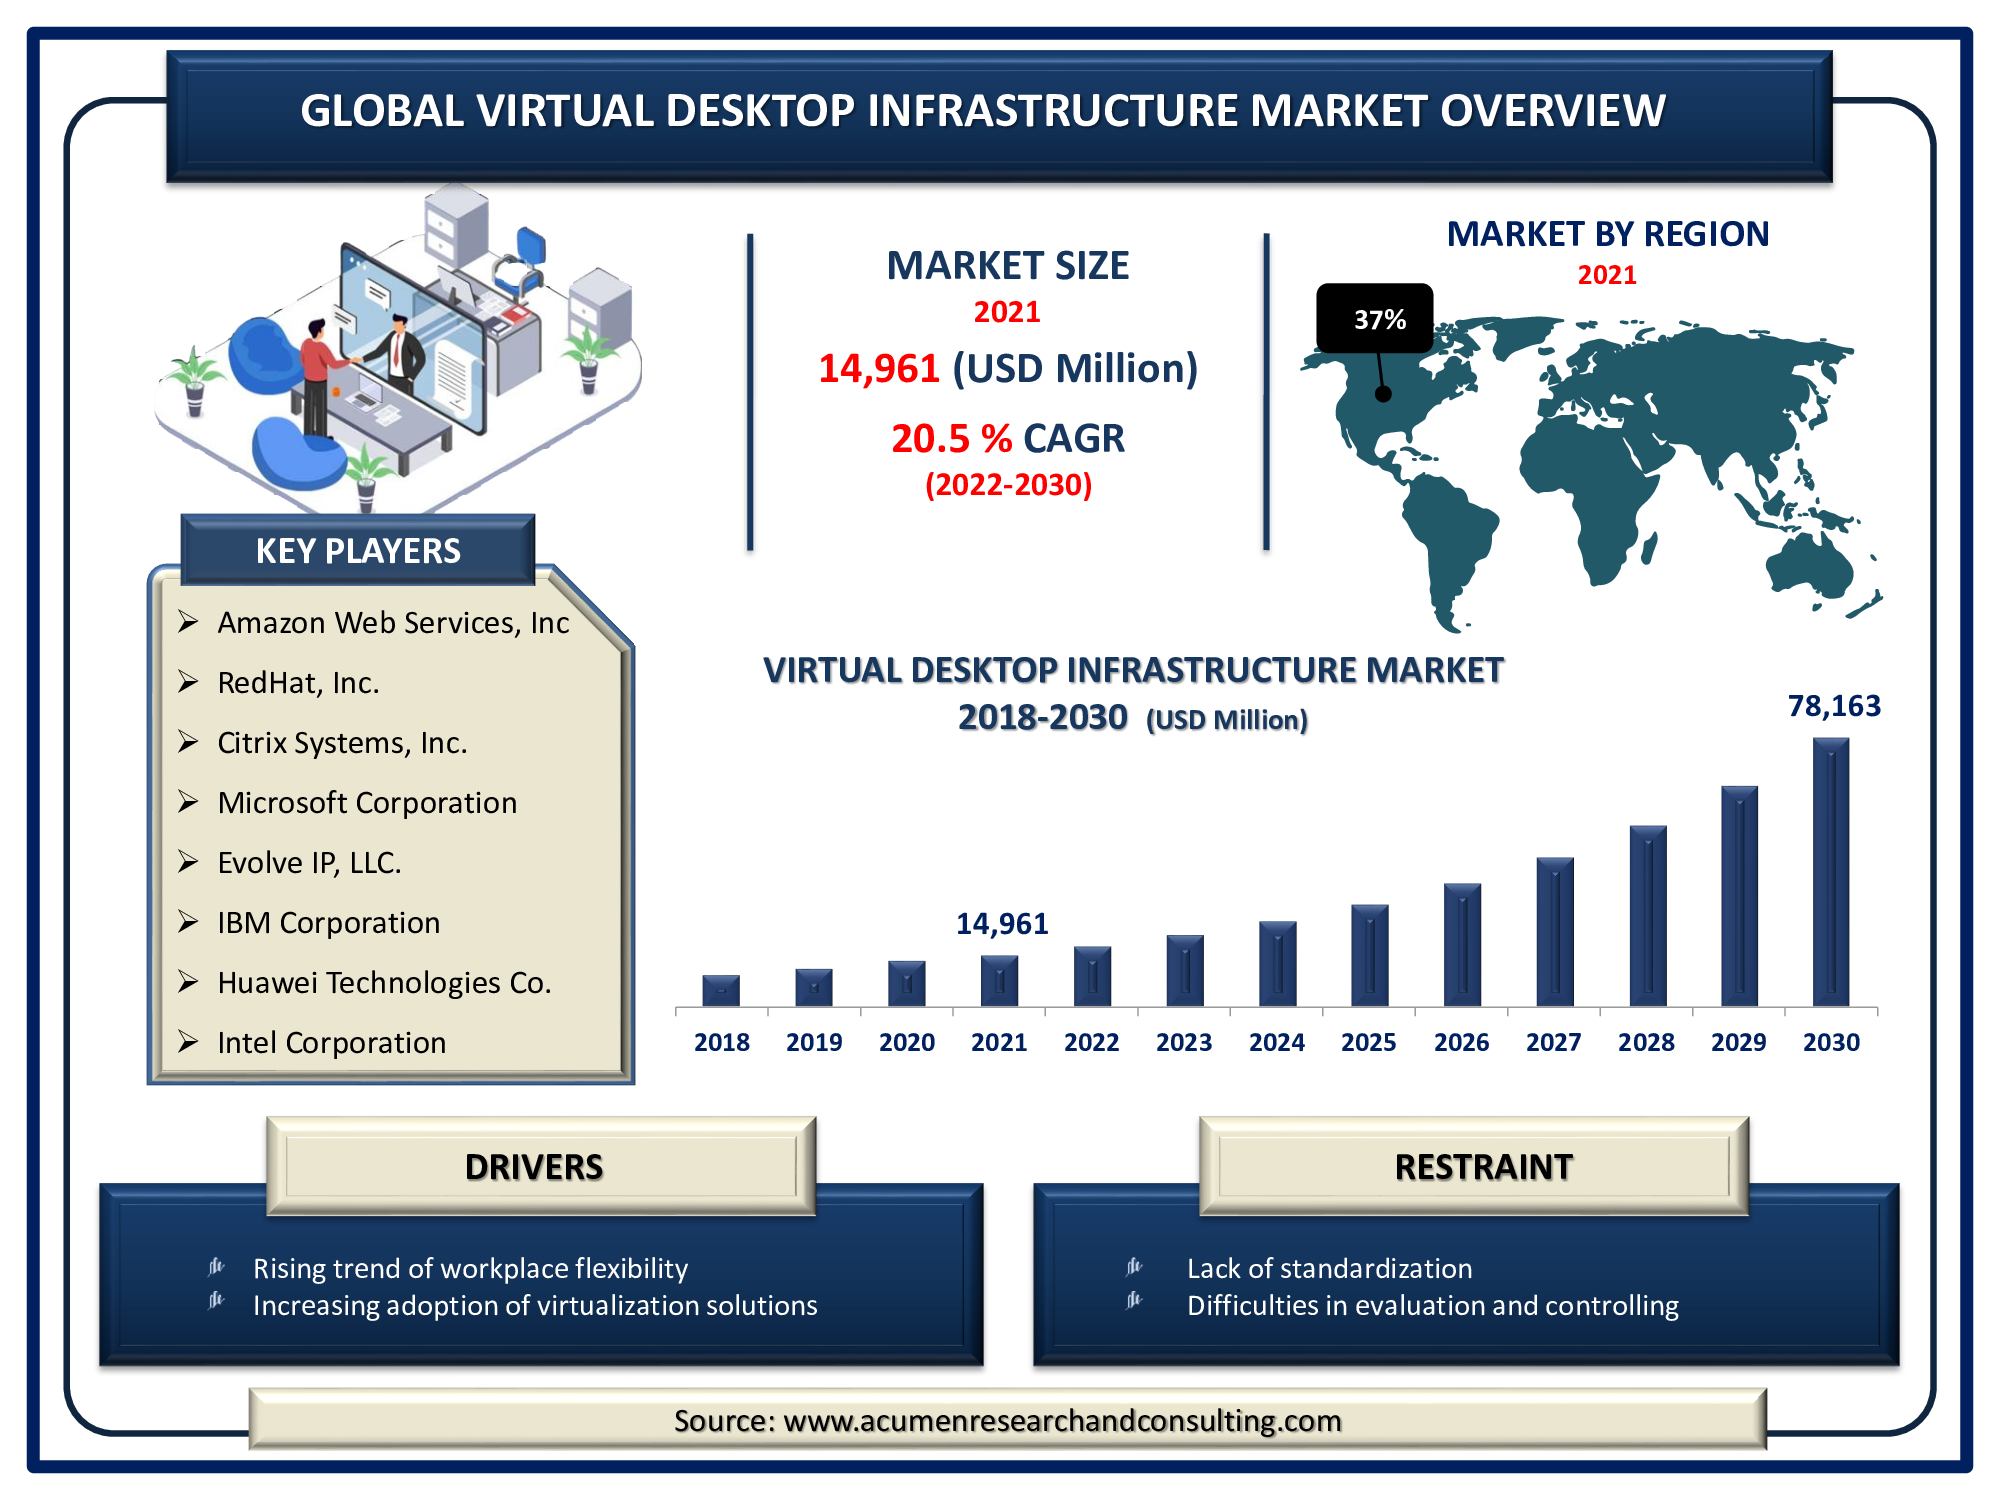
Drivers
- Growing demands for BYOD trend across the enterprises
- Rising trend of workplace flexibility
- Increasing adoption of virtualization solutions
- Rapidly increasing absorption of cloud computing services
Restraints
- Lack of standardization
- Difficulties in evaluation and controlling
Opportunity
- Growing the number of smart city projects in emerging economies
- Increasing adoption of the IoT technology
Report Coverage
Market |
Virtual Desktop Infrastructure (VDI) Market |
Market Size 2021 |
US$ 14,961 Mn |
Market Forecast 2028 |
US$ 78,163 Mn |
CAGR |
20.5% During 2022 - 2030 |
Analysis Period |
2018 - 2030 |
Base Year |
2021 |
Forecast Data |
2022 - 2030 |
Segments Covered |
By Type, By Component, By Deployment Model, By Application, And By Geography
|
Regional Scope |
North America, Europe, Asia Pacific, Latin America, and Middle East & Africa |
Key Companies Profiled |
Amazon Web Services, Inc., RedHat, Inc., Citrix Systems, Inc., Microsoft Corporation, Evolve IP, LLC., IBM Corporation, Huawei Technologies Co., Ltd., Intel Corporation, HP Enterprise Co., Nutanix, Inc., Ericom Software, Inc., and Cisco Systems, Inc. |
Report Coverage
|
Market Trends, Drivers, Restraints, Competitive Analysis, Player Profiling, Regulation Analysis |
Customization Scope |
10 hrs of free customization and expert consultation
|
Virtual Desktop Infrastructure (VDI) Market Dynamics
Virtual Desktop Infrastructure (VDI) is a technology package that allows the deployment of desktop systems through the use of virtual servers. These virtual desktops are managed centrally and offered on-demand in a virtualized infrastructure. This helps organizations with data movement and cloud-based remote access to individuals. VDI also enables entrepreneurs in managing digital workspace activities as well as sophisticated security procedures. VDI simplifies the administration, management, and implementation of endpoints such as portable devices, laptops, and tablets, driving the virtual desktop infrastructure market size. VDIs provide a centralized administrative framework that allows administrators to update, patch, and modify all duplicated desktops from a single location. Furthermore, because the applications run on the server computer in the network infrastructure rather than the client device, businesses may maintain complete confidentiality. As a result, such technology will boom the market and drive the VDI market revenue in the coming years.
Market Segmentation
Market By Type
- Persistent VDI
- Non-persistent VDI
Based on the type, the persistent VDI segment accounted for the majority of market shares in 2021. Persistent virtual desktop infrastructure (VDI) is a configuration in which each user has their virtual environment, with their settings and customizations available at all times. Consumers can get used to these desktop computers more quickly because of the constancy of the customer experience and the access to customizations. Each consumer has a workstation with individual settings and applications, which may require 25-35 GB per desktop. However, when compared to non-persistent desktops, the provisioning technique of persistent desktops increases storage utilization.
Market By Component
- Hardware
- Server-side hardware
- Client-side hardware
- Platform
- Service
- Implementation
- Consulting
- Maintenance & Support
Based on the components, the platform segment is predicted to have the largest market share over the forecasted years. This expansion could be attributed to the increased use of BYOD and cloud-based technology. Businesses around the globe are embracing BYOD in order to boost corporate productivity while also providing their employees with independence. Increased emphasis on lowering capital costs and improving productivity will boost industry growth. Furthermore, the service segment is expected to rise with considerable market shares in the coming years. During the service segment, the service provider manages software and maintenance, relieving the organization of hardware system firmware and software validation and saving the company time and money.
Market By Deployment Model
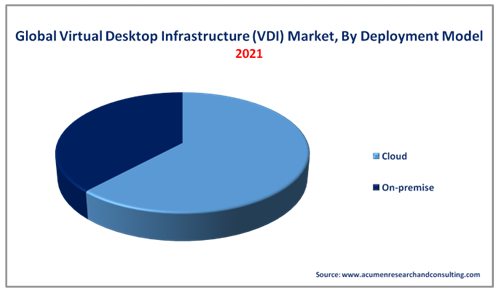
Based on the deployment model, the cloud segment will dominate the market in 2021. A cloud-based virtual desktop infrastructure (VDI) system enables users to access virtual desktop software packages or applications from anywhere. As a result, the cloud segment is driving the market. Cloud VDI is also known as Desktop-as-a-Service (DaaS). Cloud service providers throughout the world are delivering unique cloud services to their customers. The global development of telecom infrastructure facilities is expected to drive segment growth. Furthermore, cloud computing allows access to data and programs from any point on the globe and from any internet-connected device. Similarly, it delivers scalable computing resources to organizations, cutting the cost of acquiring and maintaining them.
Market By Application
Based on the application, the IT and telecom segment is expected to increase at the fastest rate in the industry over the next several years. IT and telecom companies are implementing VDI solutions for system operators to allow remote employees to access the company's assets. Similarly, VDI helps organizations reduce the expenditures and operational overhead expenses associated with physical network infrastructure. VDI solutions from Microsoft, Citrix, VMware, and others meet technological and commercial requirements by allowing users to remotely access reliable virtual desktops.
Virtual Desktop Infrastructure (VDI) Market Regional Overview
North America
Europe
- U.K.
- Germany
- France
- Spain
- Rest of Europe
Latin America
- Mexico
- Brazil
- Rest of Latin America
Asia-Pacific
- India
- Japan
- China
- Australia
- South Korea
- Rest of Asia-Pacific
Middle East & Africa (MEA)
- Gulf Cooperation Council (GCC)
- South Africa
- Rest of the Middle East & Africa
North America is expected to dominate the worldwide virtual desktop infrastructure (VDI) market. Aspects such as the presence of technological superiority, an increase in the use of intelligent machines and IoT, and an exponentially growing ICT industry are propelling market growth in this region. Europe is also expected to provide a sizable part of the market. This is due to the rise in cloud computing adoption, an increase in BYOD policies imposed by various organizations, and a surge in people's willingness to work remotely. The Asia-Pacific market, on the other hand, is expected to grow at a quicker rate throughout the forecast period. Factors such as increased use of cloud services, a growing trend of digitalization, and a surge in virtual learning platforms are all driving industrial growth in the region.
Competitive Landscape
Some of the prominent players in global virtual desktop infrastructure (VDI) market are Amazon Web Services, Inc., RedHat, Inc., Citrix Systems, Inc., Microsoft Corporation, Evolve IP, LLC., IBM Corporation, Huawei Technologies Co., Ltd., Intel Corporation, HP Enterprise Co., Nutanix, Inc., Ericom Software, Inc., and Cisco Systems, Inc.
CHAPTER 1. Industry Overview of Virtual Desktop Infrastructure (VDI) Market
1.1. Definition and Scope
1.1.1. Definition of Virtual Desktop Infrastructure (VDI)
1.1.2. Market Segmentation
1.1.3. Years Considered for the Study
1.1.4. Assumptions and Acronyms Used
1.1.4.1. Market Assumptions and Market Forecast
1.1.4.2. Acronyms Used in Global Virtual Desktop Infrastructure (VDI) Market
1.2. Summary
1.2.1. Executive Summary
1.2.2. Virtual Desktop Infrastructure (VDI) Market By Type
1.2.3. Virtual Desktop Infrastructure (VDI) Market By Component
1.2.4. Virtual Desktop Infrastructure (VDI) Market By Deployment Model
1.2.5. Virtual Desktop Infrastructure (VDI) Market By Application
1.2.6. Virtual Desktop Infrastructure (VDI) Market By Regions
CHAPTER 2. Research Approach
2.1. Methodology
2.1.1. Research Programs
2.1.2. Market Size Estimation
2.1.3. Market Breakdown and Data Triangulation
2.2. Data Source
2.2.1. Secondary Source
2.2.2. Primary Source
CHAPTER 3. Market Dynamics And Competition Analysis
3.1. Market Drivers
3.1.1. Driver 1
3.1.2. Driver 2
3.2. Restraints and Challenges
3.2.1. Restraint 1
3.2.2. Restraint 2
3.3. Growth Opportunities
3.3.1. Opportunity 1
3.3.2. Opportunity 2
3.4. Porter’s Five Forces Analysis
3.4.1. Bargaining Power of Suppliers
3.4.2. Bargaining Power of Buyers
3.4.3. Threat of Substitute
3.4.4. Threat of New Entrants
3.4.5. Degree of Competition
3.5. Market Concentration Ratio and Market Maturity Analysis of Virtual Desktop Infrastructure (VDI) Market
3.5.1. Go To Market Strategy
3.5.1.1. Introduction
3.5.1.2. Growth
3.5.1.3. Maturity
3.5.1.4. Saturation
3.5.1.5. Possible Development
3.6. Technological Roadmap for Virtual Desktop Infrastructure (VDI) Market
3.7. Value Chain Analysis
3.7.1. List of Key Manufacturers
3.7.2. List of Customers
3.7.3. Level of Integration
3.8. Cost Structure Analysis
3.8.1. Price Trend of Key Raw Materials
3.8.2. Raw Material Suppliers
3.9. Regulatory Compliance
3.10. Competitive Landscape, 2021
3.10.1. Player Positioning Analysis
3.10.2. Key Strategies Adopted By Leading Players
CHAPTER 4. Manufacturing Plant Analysis
4.1. Manufacturing Plant Location and Establish Date of Major Manufacturers in 2021
4.2. R&D Status of Virtual Desktop Infrastructure (VDI) Major Manufacturers in 2021
CHAPTER 5. Virtual Desktop Infrastructure (VDI) Market By Type
5.1. Introduction
5.2. Virtual Desktop Infrastructure (VDI) Market Revenue By Type
5.2.1. Virtual Desktop Infrastructure (VDI) Market Revenue (US$ Mn) and Forecast, By Type, 2018-2030
5.2.2. Persistent VDI
5.2.2.1. Persistent VDI Market Revenue (US$ Mn) and Growth Rate (%), 2018-2030
5.2.3. Non-persistent VDI
5.2.3.1. Non-persistent VDI Market Revenue (US$ Mn) and Growth Rate (%), 2018-2030
CHAPTER 6. Virtual Desktop Infrastructure (VDI) Market Revenue By Component
6.1. Introduction
6.2. Virtual Desktop Infrastructure (VDI) Market Revenue (US$ Mn) By Component
6.2.1. Virtual Desktop Infrastructure (VDI) Market Revenue (US$ Mn) and Forecast By Component, 2018-2030
6.2.2. Hardware
6.2.2.1. Hardware Market Revenue (US$ Mn) and Growth Rate (%), 2018-2030
6.2.2.2. Server-Side Hardware
6.2.2.2.1. Server-Side Hardware Market Revenue (US$ Mn) and Growth Rate (%), 2018-2030
6.2.2.3. Client-Side Hardware
6.2.2.3.1. Client-Side Hardware Market Revenue (US$ Mn) and Growth Rate (%), 2018-2030
6.2.3. Platform
6.2.3.1. Platform Market Revenue (US$ Mn) and Growth Rate (%), 2018-2030
6.2.4. Service
6.2.4.1. Service Market Revenue (US$ Mn) and Growth Rate (%), 2018-2030
6.2.4.2. Implementation
6.2.4.2.1. Implementation Market Revenue (US$ Mn) and Growth Rate (%), 2018-2030
6.2.4.3. Consulting
6.2.4.3.1. Consulting Market Revenue (US$ Mn) and Growth Rate (%), 2018-2030
6.2.4.4. Maintenance & Support
6.2.4.4.1. Maintenance & Support Market Revenue (US$ Mn) and Growth Rate (%), 2018-2030
CHAPTER 7. Virtual Desktop Infrastructure (VDI) Market Revenue By Deployment Model
7.1. Introduction
7.2. Virtual Desktop Infrastructure (VDI) Market Revenue (US$ Mn) By Deployment Model
7.2.1. Virtual Desktop Infrastructure (VDI) Market Revenue (US$ Mn) and Forecast By Deployment Model, 2018-2030
7.2.2. Cloud
7.2.2.1. Cloud Market Revenue (US$ Mn) and Growth Rate (%), 2018-2030
7.2.3. On-premise
7.2.3.1. On-premise Market Revenue (US$ Mn) and Growth Rate (%), 2018-2030
CHAPTER 8. Virtual Desktop Infrastructure (VDI) Market Revenue By Application
8.1. Introduction
8.2. Virtual Desktop Infrastructure (VDI) Market Revenue (US$ Mn) By Application
8.2.1. Virtual Desktop Infrastructure (VDI) Market Revenue (US$ Mn) and Forecast By Application, 2018-2030
8.2.2. BFSI
8.2.2.1. BFSI Market Revenue (US$ Mn) and Growth Rate (%), 2018-2030
8.2.3. Aerospace and Defense
8.2.3.1. Aerospace and Defense Market Revenue (US$ Mn) and Growth Rate (%), 2018-2030
8.2.4. IT & Telecom
8.2.4.1. IT & Telecom Market Revenue (US$ Mn) and Growth Rate (%), 2018-2030
8.2.5. Government
8.2.5.1. Government Market Revenue (US$ Mn) and Growth Rate (%), 2018-2030
8.2.6. Education
8.2.6.1. Education Market Revenue (US$ Mn) and Growth Rate (%), 2018-2030
8.2.7. Manufacturing
8.2.7.1. Manufacturing Market Revenue (US$ Mn) and Growth Rate (%), 2018-2030
8.2.8. Retail
8.2.8.1. Retail Market Revenue (US$ Mn) and Growth Rate (%), 2018-2030
8.2.9. Transportation
8.2.9.1. Transportation Market Revenue (US$ Mn) and Growth Rate (%), 2018-2030
8.2.10. Others
8.2.10.1. Others Market Revenue (US$ Mn) and Growth Rate (%), 2018-2030
CHAPTER 9. North America Virtual Desktop Infrastructure (VDI) Market By Country
9.1. North America Virtual Desktop Infrastructure (VDI) Market Overview
9.2. U.S.
9.2.1. U.S. Virtual Desktop Infrastructure (VDI) Market Revenue (US$ Mn) and Forecast By Type, 2018-2030
9.2.2. U.S. Virtual Desktop Infrastructure (VDI) Market Revenue (US$ Mn) and Forecast By Component, 2018-2030
9.2.3. U.S. Virtual Desktop Infrastructure (VDI) Market Revenue (US$ Mn) and Forecast By Deployment Model, 2018-2030
9.2.4. U.S. Virtual Desktop Infrastructure (VDI) Market Revenue (US$ Mn) and Forecast By Application, 2018-2030
9.3. Canada
9.3.1. Canada Virtual Desktop Infrastructure (VDI) Market Revenue (US$ Mn) and Forecast By Type, 2018-2030
9.3.2. Canada Virtual Desktop Infrastructure (VDI) Market Revenue (US$ Mn) and Forecast By Component, 2018-2030
9.3.3. Canada Virtual Desktop Infrastructure (VDI) Market Revenue (US$ Mn) and Forecast By Deployment Model, 2018-2030
9.3.4. Canada Virtual Desktop Infrastructure (VDI) Market Revenue (US$ Mn) and Forecast By Application, 2018-2030
9.4. North America PEST Analysis
CHAPTER 10. Europe Virtual Desktop Infrastructure (VDI) Market By Country
10.1. Europe Virtual Desktop Infrastructure (VDI) Market Overview
10.2. U.K.
10.2.1. U.K. Virtual Desktop Infrastructure (VDI) Market Revenue (US$ Mn) and Forecast By Type, 2018-2030
10.2.2. U.K. Virtual Desktop Infrastructure (VDI) Market Revenue (US$ Mn) and Forecast By Component, 2018-2030
10.2.3. U.K. Virtual Desktop Infrastructure (VDI) Market Revenue (US$ Mn) and Forecast By Deployment Model, 2018-2030
10.2.4. U.K. Virtual Desktop Infrastructure (VDI) Market Revenue (US$ Mn) and Forecast By Application, 2018-2030
10.3. Germany
10.3.1. Germany Virtual Desktop Infrastructure (VDI) Market Revenue (US$ Mn) and Forecast By Type, 2018-2030
10.3.2. Germany Virtual Desktop Infrastructure (VDI) Market Revenue (US$ Mn) and Forecast By Component, 2018-2030
10.3.3. Germany Virtual Desktop Infrastructure (VDI) Market Revenue (US$ Mn) and Forecast By Deployment Model, 2018-2030
10.3.4. Germany Virtual Desktop Infrastructure (VDI) Market Revenue (US$ Mn) and Forecast By Application, 2018-2030
10.4. France
10.4.1. France Virtual Desktop Infrastructure (VDI) Market Revenue (US$ Mn) and Forecast By Type, 2018-2030
10.4.2. France Virtual Desktop Infrastructure (VDI) Market Revenue (US$ Mn) and Forecast By Component, 2018-2030
10.4.3. France Virtual Desktop Infrastructure (VDI) Market Revenue (US$ Mn) and Forecast By Deployment Model, 2018-2030
10.4.4. France Virtual Desktop Infrastructure (VDI) Market Revenue (US$ Mn) and Forecast By Application, 2018-2030
10.5. Spain
10.5.1. Spain Virtual Desktop Infrastructure (VDI) Market Revenue (US$ Mn) and Forecast By Type, 2018-2030
10.5.2. Spain Virtual Desktop Infrastructure (VDI) Market Revenue (US$ Mn) and Forecast By Component, 2018-2030
10.5.3. Spain Virtual Desktop Infrastructure (VDI) Market Revenue (US$ Mn) and Forecast By Deployment Model, 2018-2030
10.5.4. Spain Virtual Desktop Infrastructure (VDI) Market Revenue (US$ Mn) and Forecast By Application, 2018-2030
10.6. Rest of Europe
10.6.1. Rest of Europe Virtual Desktop Infrastructure (VDI) Market Revenue (US$ Mn) and Forecast By Type, 2018-2030
10.6.2. Rest of Europe Virtual Desktop Infrastructure (VDI) Market Revenue (US$ Mn) and Forecast By Component, 2018-2030
10.6.3. Rest of Europe Virtual Desktop Infrastructure (VDI) Market Revenue (US$ Mn) and Forecast By Deployment Model, 2018-2030
10.6.4. Rest of Europe Virtual Desktop Infrastructure (VDI) Market Revenue (US$ Mn) and Forecast By Application, 2018-2030
10.7. Europe PEST Analysis
CHAPTER 11. Asia-Pacific Virtual Desktop Infrastructure (VDI) Market By Country
11.1. Asia-Pacific Virtual Desktop Infrastructure (VDI) Market Overview
11.2. China
11.2.1. China Virtual Desktop Infrastructure (VDI) Market Revenue (US$ Mn) and Forecast By Type, 2018-2030
11.2.2. China Virtual Desktop Infrastructure (VDI) Market Revenue (US$ Mn) and Forecast By Component, 2018-2030
11.2.3. China Virtual Desktop Infrastructure (VDI) Market Revenue (US$ Mn) and Forecast By Deployment Model, 2018-2030
11.2.4. China Virtual Desktop Infrastructure (VDI) Market Revenue (US$ Mn) and Forecast By Application, 2018-2030
11.3. Japan
11.3.1. Japan Virtual Desktop Infrastructure (VDI) Market Revenue (US$ Mn) and Forecast By Type, 2018-2030
11.3.2. Japan Virtual Desktop Infrastructure (VDI) Market Revenue (US$ Mn) and Forecast By Component, 2018-2030
11.3.3. Japan Virtual Desktop Infrastructure (VDI) Market Revenue (US$ Mn) and Forecast By Deployment Model, 2018-2030
11.3.4. Japan Virtual Desktop Infrastructure (VDI) Market Revenue (US$ Mn) and Forecast By Application, 2018-2030
11.4. India
11.4.1. India Virtual Desktop Infrastructure (VDI) Market Revenue (US$ Mn) and Forecast By Type, 2018-2030
11.4.2. India Virtual Desktop Infrastructure (VDI) Market Revenue (US$ Mn) and Forecast By Component, 2018-2030
11.4.3. India Virtual Desktop Infrastructure (VDI) Market Revenue (US$ Mn) and Forecast By Deployment Model, 2018-2030
11.4.4. India Virtual Desktop Infrastructure (VDI) Market Revenue (US$ Mn) and Forecast By Application, 2018-2030
11.5. Australia
11.5.1. Australia Virtual Desktop Infrastructure (VDI) Market Revenue (US$ Mn) and Forecast By Type, 2018-2030
11.5.2. Australia Virtual Desktop Infrastructure (VDI) Market Revenue (US$ Mn) and Forecast By Component, 2018-2030
11.5.3. Australia Virtual Desktop Infrastructure (VDI) Market Revenue (US$ Mn) and Forecast By Deployment Model, 2018-2030
11.5.4. Australia Virtual Desktop Infrastructure (VDI) Market Revenue (US$ Mn) and Forecast By Application, 2018-2030
11.6. South Korea
11.6.1. South Korea Virtual Desktop Infrastructure (VDI) Market Revenue (US$ Mn) and Forecast By Type, 2018-2030
11.6.2. South Korea Virtual Desktop Infrastructure (VDI) Market Revenue (US$ Mn) and Forecast By Component, 2018-2030
11.6.3. South Korea Virtual Desktop Infrastructure (VDI) Market Revenue (US$ Mn) and Forecast By Deployment Model, 2018-2030
11.6.4. South Korea Virtual Desktop Infrastructure (VDI) Market Revenue (US$ Mn) and Forecast By Application, 2018-2030
11.7. Rest of Asia-Pacific
11.7.1. Rest of Asia-Pacific Virtual Desktop Infrastructure (VDI) Market Revenue (US$ Mn) and Forecast By Type, 2018-2030
11.7.2. Rest of Asia-Pacific Virtual Desktop Infrastructure (VDI) Market Revenue (US$ Mn) and Forecast By Component, 2018-2030
11.7.3. Rest of Asia-Pacific Virtual Desktop Infrastructure (VDI) Market Revenue (US$ Mn) and Forecast By Deployment Model, 2018-2030
11.7.4. Rest of Asia-Pacific Virtual Desktop Infrastructure (VDI) Market Revenue (US$ Mn) and Forecast By Application, 2018-2030
11.8. Asia Pacific PEST Analysis
CHAPTER 12. Latin America Virtual Desktop Infrastructure (VDI) Market By Country
12.1. Latin America Virtual Desktop Infrastructure (VDI) Market Overview
12.2. Brazil
12.2.1. Brazil Virtual Desktop Infrastructure (VDI) Market Revenue (US$ Mn) and Forecast By Type, 2018-2030
12.2.2. Brazil Virtual Desktop Infrastructure (VDI) Market Revenue (US$ Mn) and Forecast By Component, 2018-2030
12.2.3. Brazil Virtual Desktop Infrastructure (VDI) Market Revenue (US$ Mn) and Forecast By Deployment Model, 2018-2030
12.2.4. Brazil Virtual Desktop Infrastructure (VDI) Market Revenue (US$ Mn) and Forecast By Application, 2018-2030
12.3. Mexico
12.3.1. Mexico Virtual Desktop Infrastructure (VDI) Market Revenue (US$ Mn) and Forecast By Type, 2018-2030
12.3.2. Mexico Virtual Desktop Infrastructure (VDI) Market Revenue (US$ Mn) and Forecast By Component, 2018-2030
12.3.3. Mexico Virtual Desktop Infrastructure (VDI) Market Revenue (US$ Mn) and Forecast By Deployment Model, 2018-2030
12.3.4. Mexico Virtual Desktop Infrastructure (VDI) Market Revenue (US$ Mn) and Forecast By Application, 2018-2030
12.4. Rest of Latin America
12.4.1. Rest of Latin America Virtual Desktop Infrastructure (VDI) Market Revenue (US$ Mn) and Forecast By Type, 2018-2030
12.4.2. Rest of Latin America Virtual Desktop Infrastructure (VDI) Market Revenue (US$ Mn) and Forecast By Component, 2018-2030
12.4.3. Rest of Latin America Virtual Desktop Infrastructure (VDI) Market Revenue (US$ Mn) and Forecast By Deployment Model, 2018-2030
12.4.4. Rest of Latin America Virtual Desktop Infrastructure (VDI) Market Revenue (US$ Mn) and Forecast By Application, 2018-2030
12.5. Latin America PEST Analysis
CHAPTER 13. Middle East & Africa Virtual Desktop Infrastructure (VDI) Market By Country
13.1. Middle East & Africa Virtual Desktop Infrastructure (VDI) Market Overview
13.2. GCC
13.2.1. GCC Virtual Desktop Infrastructure (VDI) Market Revenue (US$ Mn) and Forecast By Type, 2018-2030
13.2.2. GCC Virtual Desktop Infrastructure (VDI) Market Revenue (US$ Mn) and Forecast By Component, 2018-2030
13.2.3. GCC Virtual Desktop Infrastructure (VDI) Market Revenue (US$ Mn) and Forecast By Deployment Model, 2018-2030
13.2.4. GCC Virtual Desktop Infrastructure (VDI) Market Revenue (US$ Mn) and Forecast By Application, 2018-2030
13.3. South Africa
13.3.1. South Africa Virtual Desktop Infrastructure (VDI) Market Revenue (US$ Mn) and Forecast By Type, 2018-2030
13.3.2. South Africa Virtual Desktop Infrastructure (VDI) Market Revenue (US$ Mn) and Forecast By Component, 2018-2030
13.3.3. South Africa Virtual Desktop Infrastructure (VDI) Market Revenue (US$ Mn) and Forecast By Deployment Model, 2018-2030
13.3.4. South Africa Virtual Desktop Infrastructure (VDI) Market Revenue (US$ Mn) and Forecast By Application, 2018-2030
13.4. Rest of Middle East & Africa
13.4.1. Rest of Middle East & Africa Virtual Desktop Infrastructure (VDI) Market Revenue (US$ Mn) and Forecast By Type, 2018-2030
13.4.2. Rest of Middle East & Africa Virtual Desktop Infrastructure (VDI) Market Revenue (US$ Mn) and Forecast By Component, 2018-2030
13.4.3. Rest of Middle East & Africa Virtual Desktop Infrastructure (VDI) Market Revenue (US$ Mn) and Forecast By Deployment Model, 2018-2030
13.4.4. Rest of Middle East & Africa Virtual Desktop Infrastructure (VDI) Market Revenue (US$ Mn) and Forecast By Application, 2018-2030
13.5. Middle East & Africa PEST Analysis
CHAPTER 14. Player Analysis Of Virtual Desktop Infrastructure (VDI)
14.1. Virtual Desktop Infrastructure (VDI) Company Share Analysis
14.2. Competition Matrix
14.2.1. Competitive Benchmarking of Key Players by Price, Presence, Market Share, and R&D Investment
14.2.2. Product Launches and Product Enhancements
14.2.3. Mergers And Acquisition In Global Virtual Desktop Infrastructure (VDI) Market
14.2.4. Partnership, Joint Ventures and Strategic Alliances/ Sales Agreements
CHAPTER 15. Company Profile
15.1. Amazon Web Services, Inc.
15.1.1. Company Snapshot
15.1.2. Business Overview
15.1.3. Financial Overview
15.1.3.1. Market Revenue (US$ Mn), 2021
15.1.3.2. Amazon Web Services, Inc. 2021 Virtual Desktop Infrastructure (VDI) Business Regional Distribution
15.1.4. Product/service and Specification
15.1.5. Recent Developments & Business Strategy
15.2. RedHat, Inc.
15.3. Citrix Systems, Inc.
15.4. Microsoft Corporation
15.5. Evolve IP, LLC.
15.6. IBM Corporation
15.7. Huawei Technologies Co., Ltd.
15.8. Intel Corporation
15.9. HP Enterprise Co.
15.10. Nutanix, Inc.
15.11. Ericom Software, Inc.
15.12. Cisco Systems, Inc.