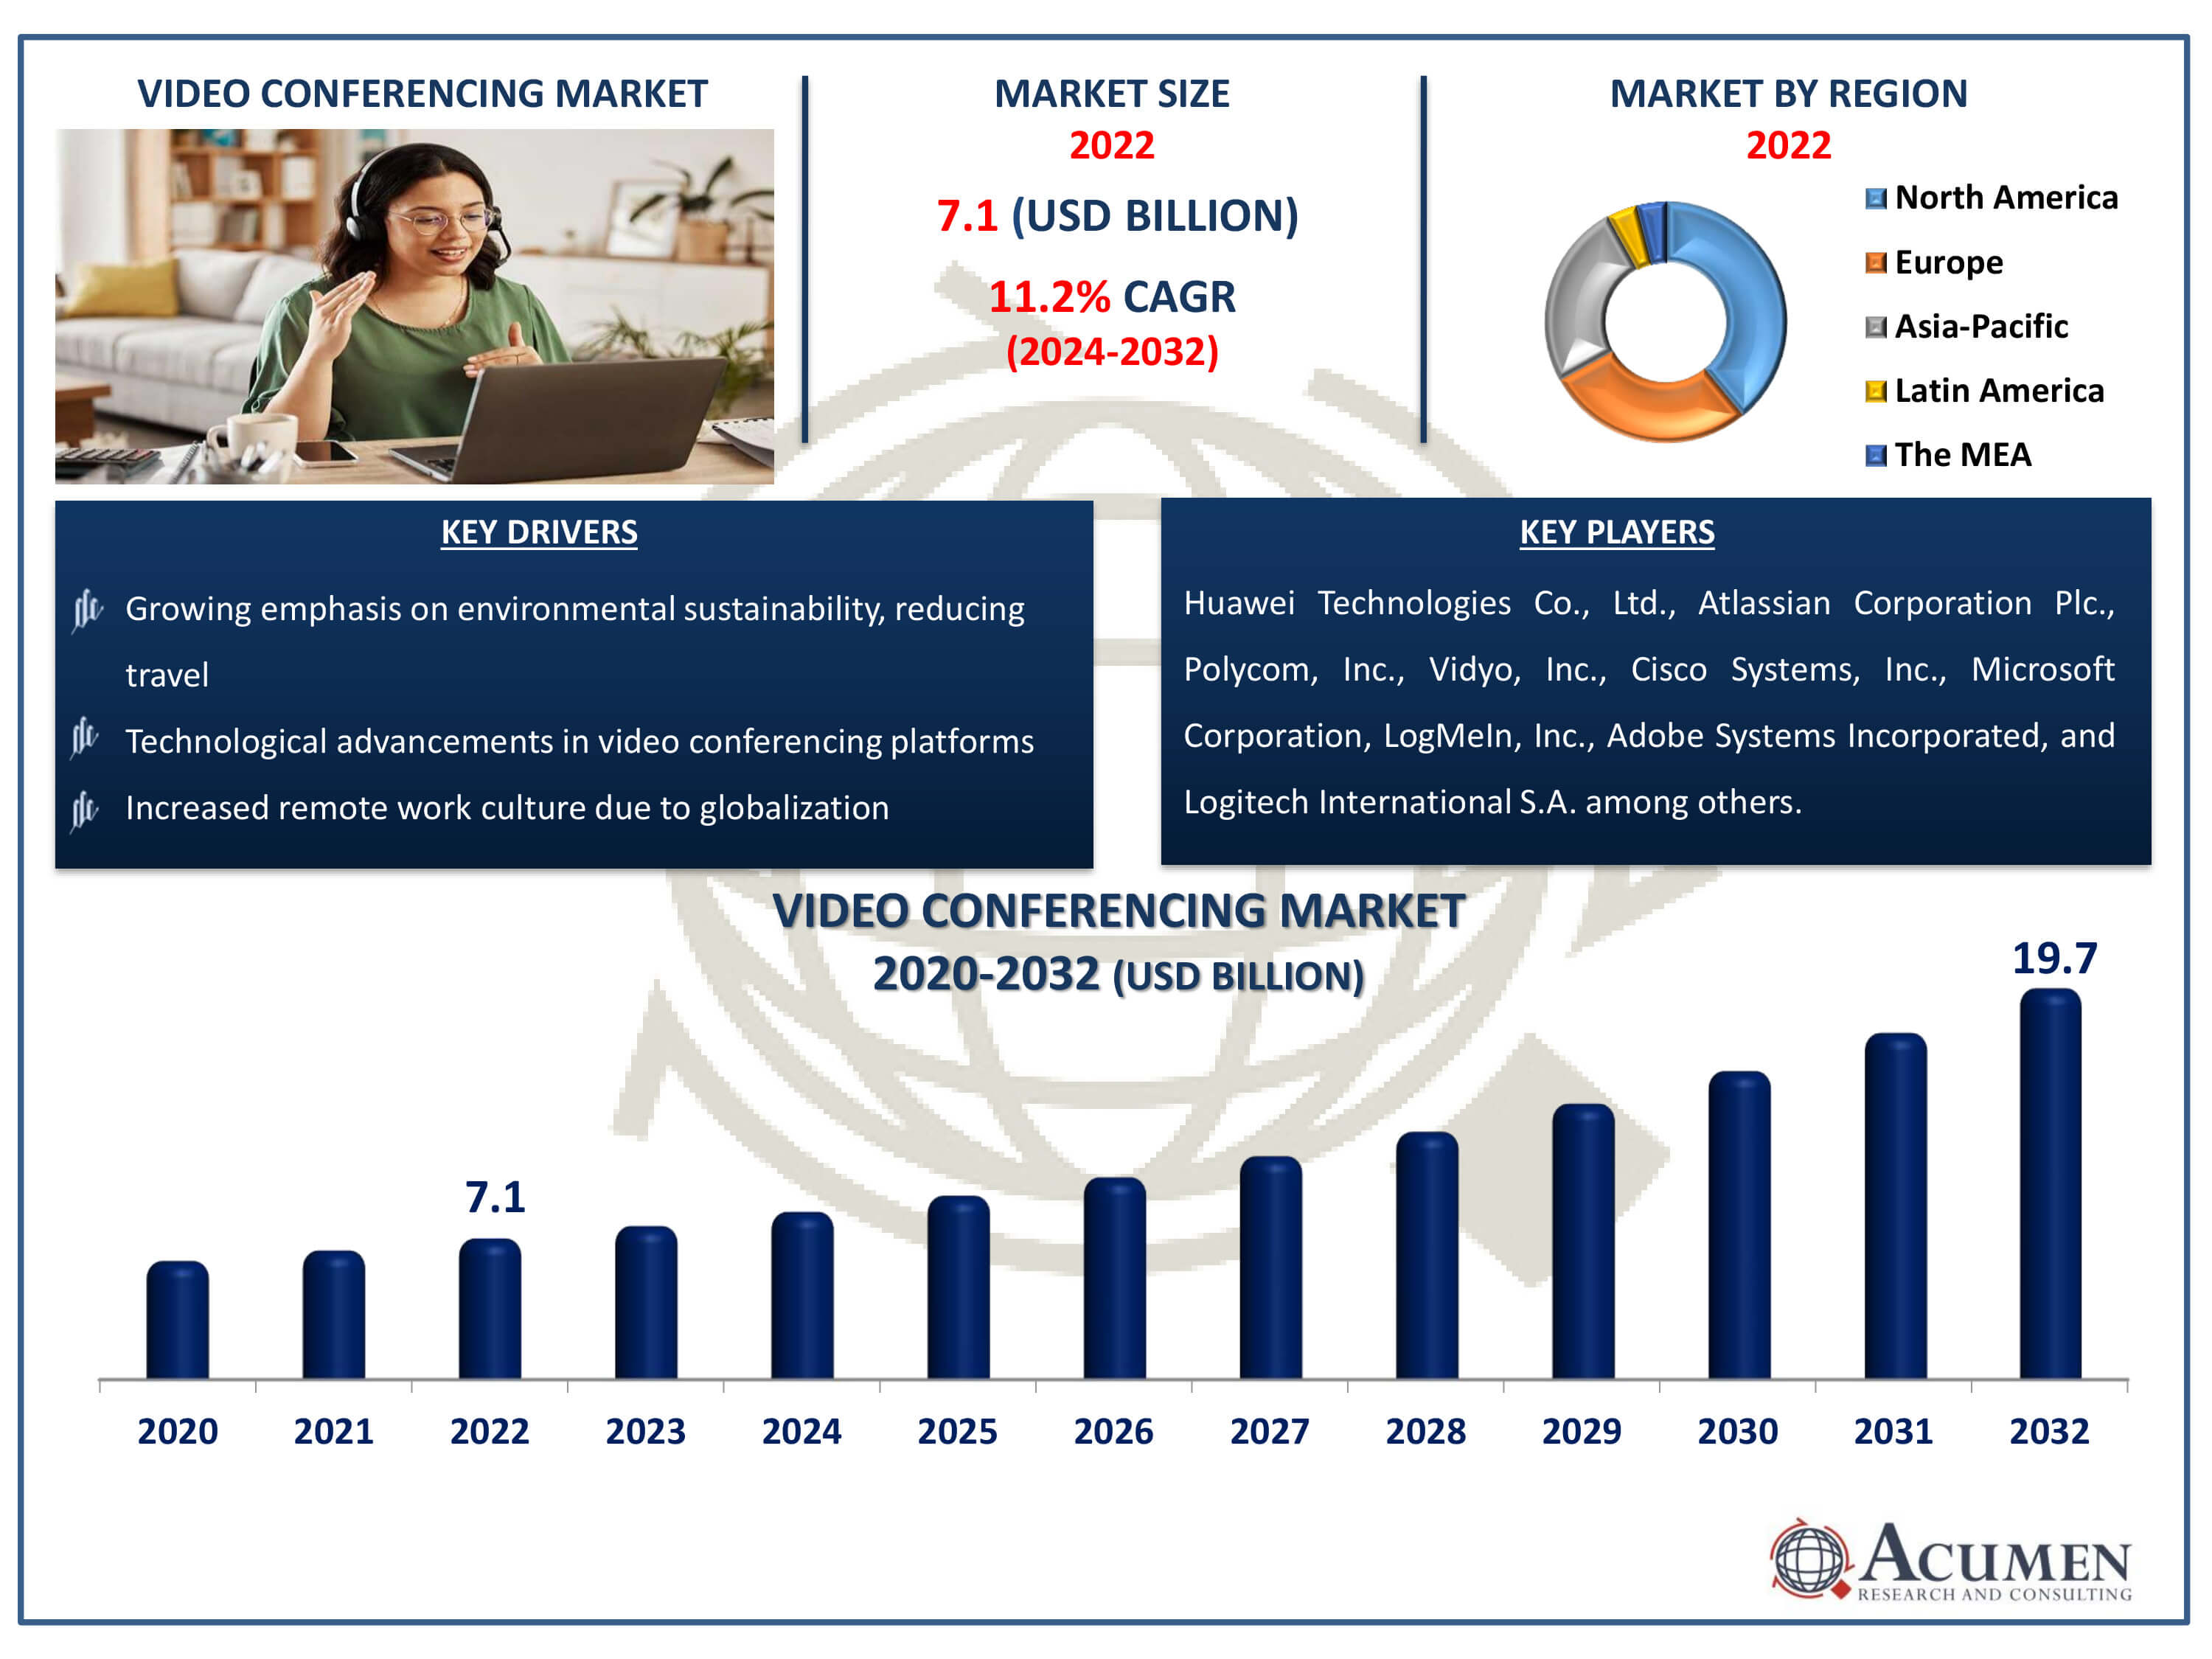
The Video Conferencing Market Size accounted for USD 7.1 Billion in 2022 and is estimated to achieve a market size of USD 19.7 Billion by 2032 growing at a CAGR of 11.2% Billion from 2024 to 2032.
Video Conferencing Market Highlights
- Global video conferencing market revenue is poised to garner USD 19.7 billion by 2032 with a CAGR of 11.2% from 2024 to 2032
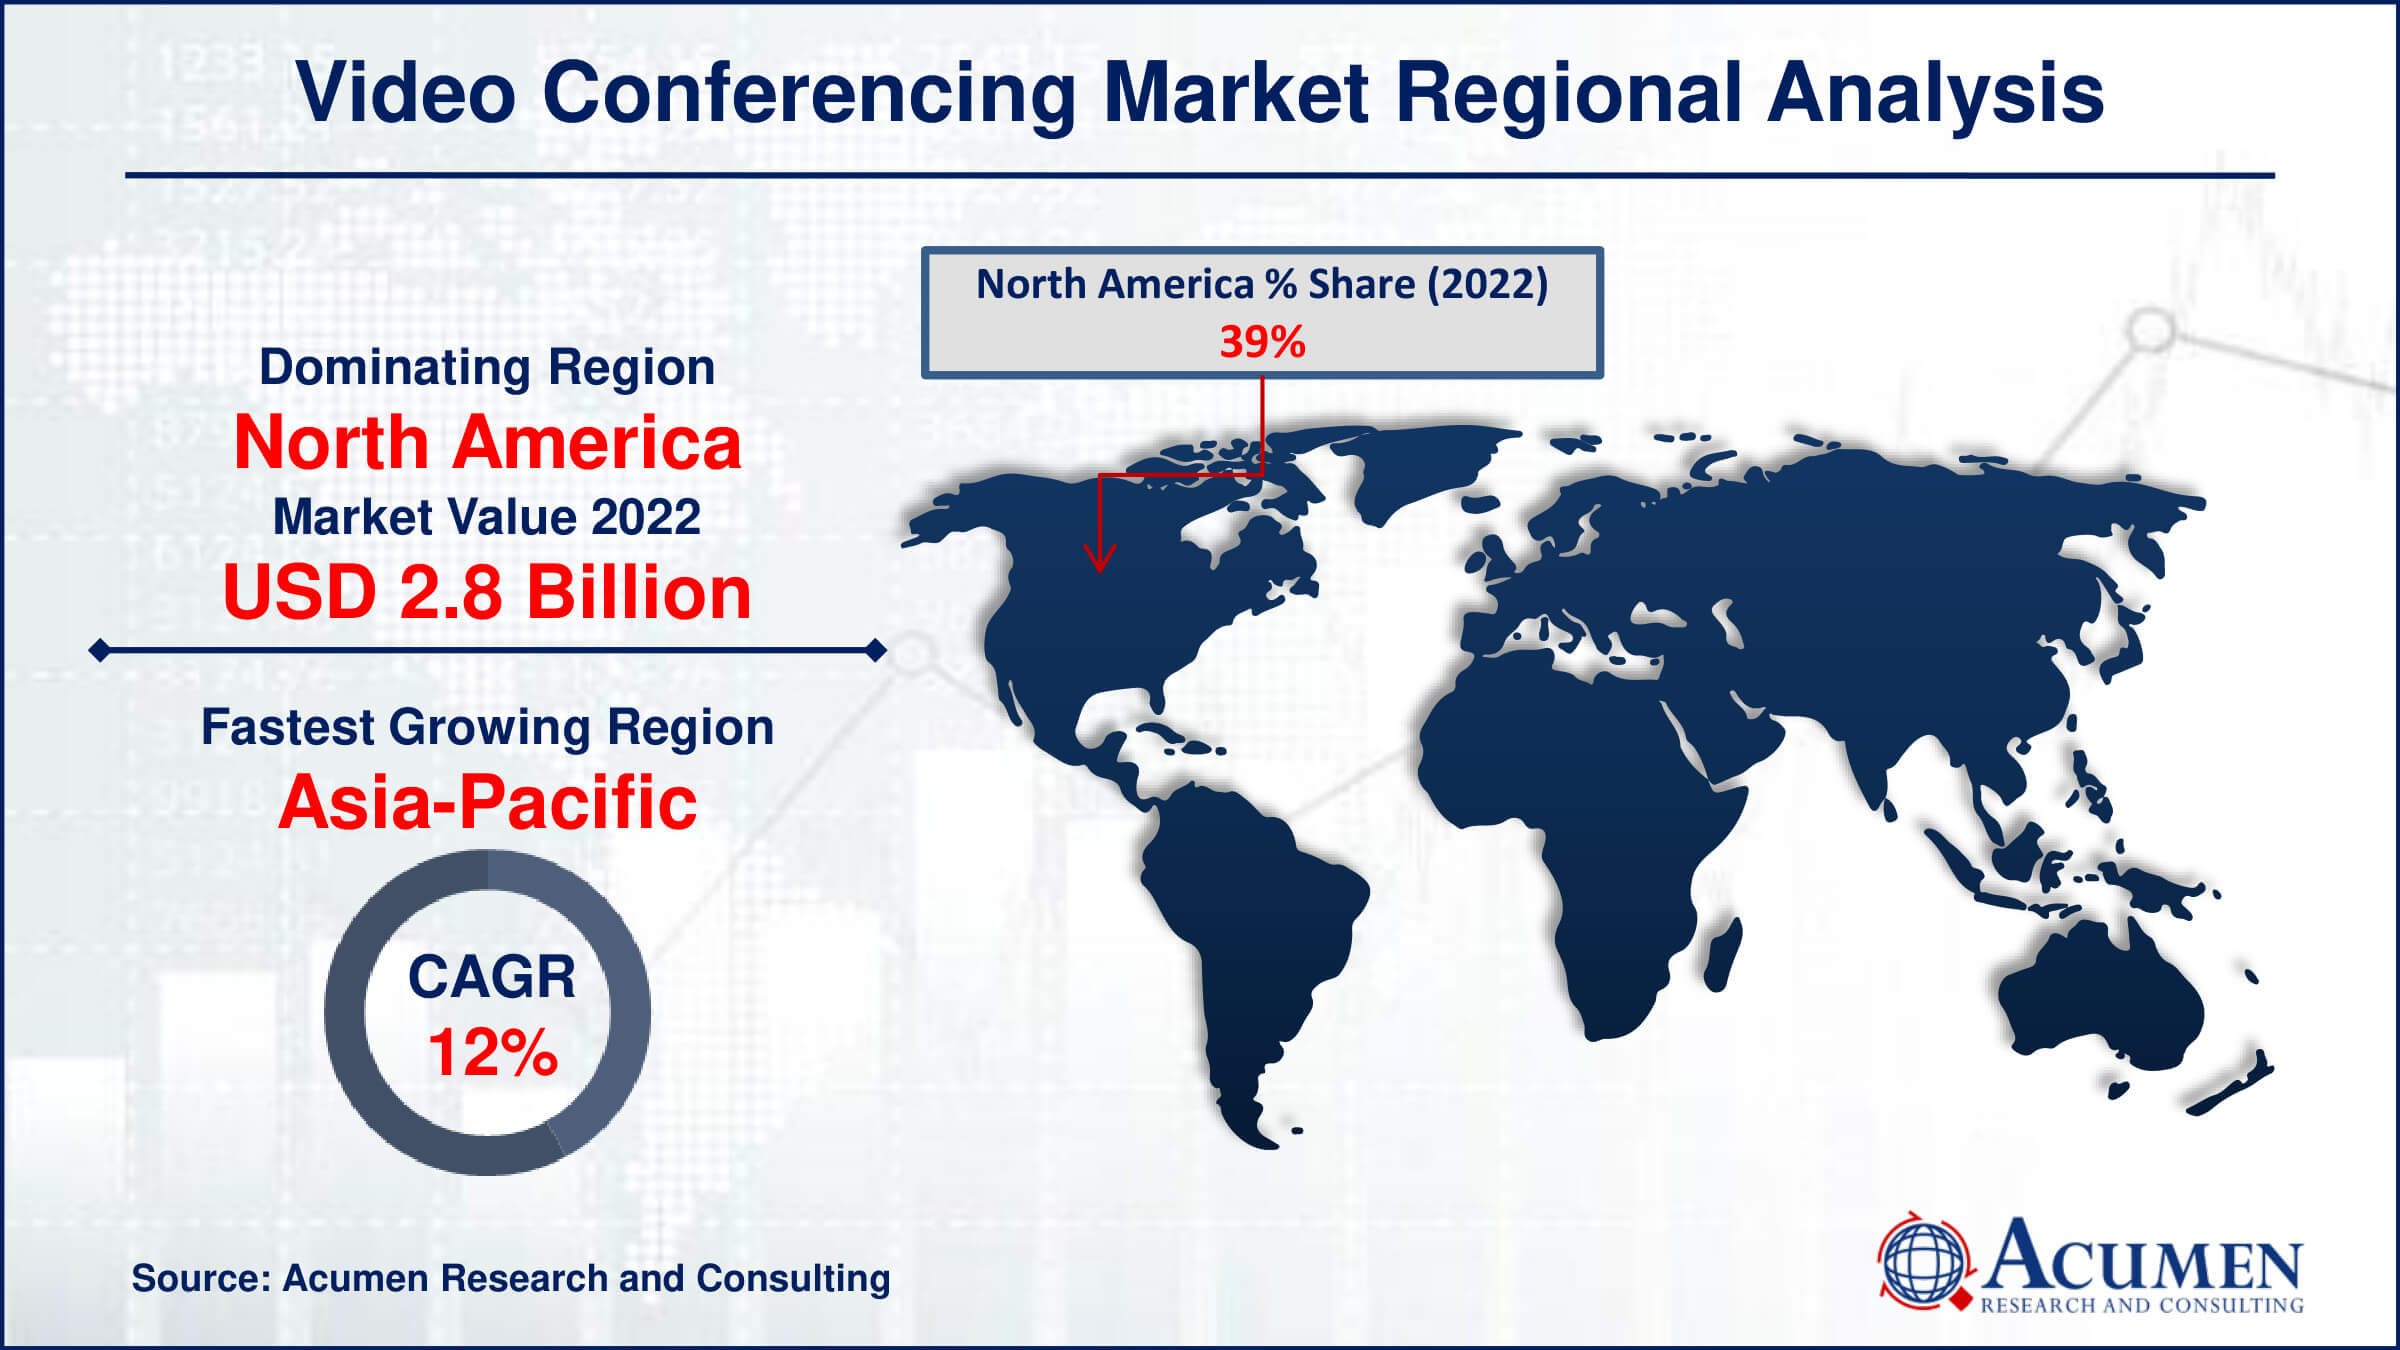
- North America video conferencing market value occupied around USD 2.8 billion in 2022
- Asia-Pacific video conferencing market growth will record a CAGR of more than 12% from 2024 to 2032
- Among component, the hardware sub-segment generated USD 3.4 billion revenue in 2022
- Based on enterprise size, the large enterprises sub-segment generated around 76% video conferencing market share in 2022
- Customization and scalability options for diverse business needs is a popular video conferencing market trend that fuels the industry demand
Video conferencing is a technology that allows individuals or groups to communicate face-to-face via the internet, regardless of their physical location. It enables users to hold meetings, conversations, and presentations in real time via video and audio connections. Participants may see and hear each other through their smartphones, making remote collaboration both simple and efficient. Video conferencing services frequently include tools like screen sharing, chat, and recording to enhance the interactive experience. It is becoming increasingly popular in a variety of industries, including business, education, healthcare, and social events, as it allows for seamless communication and fosters connectedness across distances.
Global Video Conferencing Market Dynamics
Market Drivers
- Increased remote work culture due to globalization
- Demand for cost-effective communication solutions
- Technological advancements in video conferencing platforms
- Growing emphasis on environmental sustainability, reducing travel
Market Restraints
- Security concerns regarding data privacy
- Bandwidth limitations in certain regions
- Integration challenges with existing IT infrastructure
Market Opportunities
- Expansion in healthcare sector for telemedicine services
- Integration of AI for enhanced user experience
- Penetration into emerging markets with improving internet connectivity
Video Conferencing Market Report Coverage
Market |
Video Conferencing Market
|
Video Conferencing Market Size 2022 |
USD 7.1 Billion |
Video Conferencing Market Forecast 2032 |
USD 19.7 Billion
|
Video Conferencing Market CAGR During 2024 - 2032 |
11.2% |
Video Conferencing Market Analysis Period |
2020 - 2032 |
Video Conferencing Market Base Year
|
2022 |
Video Conferencing Market Forecast Data |
2024 - 2032 |
Segments Covered |
By Component, By Deployment Mode, By Enterprise Size, By Application, By End Use, And By Geography
|
Regional Scope |
North America, Europe, Asia Pacific, Latin America, and Middle East & Africa |
Key Companies Profiled |
Huawei Technologies Co., Ltd., Atlassian Corporation Plc., Polycom, Inc., Vidyo, Inc., Cisco Systems, Inc., Microsoft Corporation, LogMeIn, Inc., Adobe Systems Incorporated, Logitech International S.A., JOYCE CR, S.R.O., Orange Business Services, and Fuze, Inc.
|
Report Coverage
|
Market Trends, Drivers, Restraints, Competitive Analysis, Player Profiling, Covid-19 Analysis, Regulation Analysis |
Video Conferencing Market Insights
The increasing demand for communication platforms that are reliable, efficient, and support two-way transmission of audio and video content in various end-use industries is driving the growth of the global video conferencing market. Additionally, the widespread impact of the pandemic has accelerated the adoption of remote work culture across industries, further fueling the demand for video conferencing solutions. For instance, as a safety precaution during the pandemic, Google extended its work-from-home policy until 2021. According to Apptopia, Inc., the Zoom application was downloaded 2.13 million times worldwide on March 23, 2020. Major players are focusing on business expansion through strategic mergers and acquisitions to increase profitability. In 2020, Verizon acquired BlueJeans Network, a video conferencing platform service provider, to expand its product portfolio and enhance profitability. Furthermore, players are investing in product development and introducing innovative solutions to positively impact market growth.
For example, Avaya launched a cloud-based video conferencing and collaboration service in 2019, aimed at increasing its customer base and profitability. Similarly, in 2020, Kaltura, a leading service provider, launched Kaltura Meetings, a reliable, scalable, and secure video conferencing solution, to expand its product portfolio and customer base. Additionally, Zoom, a cloud video conferencing company, introduced new products and features in 2019 to expand its ecosystem. However, challenges such as rising concerns about data theft and the high cost and complexity of solutions may hamper market growth. Additionally, high volatility in the competitive landscape poses a challenge. Rapid advancements in applications with advanced features, along with enhanced safety measures, are expected to create new opportunities for players in the market over the video conferencing industry forecast period.
Video Conferencing Market Segmentation
The worldwide market for video conferencing is split based on component, deployment mode, enterprise size, application, end use, and geography.
Video Conferencing Components
- Hardware
- Camera
- Microphone & Headphone
- Others
- Software
- Services
- Professional Service
- Managed Service
According to video conferencing industry analysis, hardware accounts for the majority of the market. Cameras, microphones, screens, and networking equipment are all necessary components for video conferencing. This dominance stems from the essential role hardware plays in providing smooth audiovisual transmission. Organisations prioritise investing in high-quality hardware to improve the user experience and overall dependability of video conferencing systems. With increased demand for sophisticated features like as high-definition video and noise-cancelling microphones, the hardware industry is steadily expanding. Furthermore, as firms extend their remote work policies and communication requirements, the demand for reliable hardware solutions is projected to accelerate the market's growth trajectory.
Video Conferencing Deployment Modes
For a variety of reasons, the on-premise deployment method dominates the video conferencing industry. Organisations, especially those with rigorous data security and compliance needs, choose on-premise solutions because they provide more control over data management and security processes. Additionally, some businesses, including as government and healthcare, frequently choose on-premise deployments to safeguard data sovereignty and privacy. Furthermore, legacy systems and infrastructure limits may push businesses towards on-premise solutions, particularly if they have already made considerable investments in their IT infrastructure. Despite the rising popularity of cloud-based deployments due to their scalability and flexibility, the on-premise market remains dominant, providing to the unique demands and preferences of diverse companies.
Video Conferencing Enterprise Sizes
- Large Enterprises
- Small & Medium Enterprises (SMEs)
There are various reasons why the large company segment dominates the video conferencing industry. To begin, major organizations often have more financial resources and are more likely to invest in complete video conferencing solutions to suit their complicated communication requirements. Furthermore, these businesses frequently operate on a worldwide scale, with scattered teams and locations, demanding reliable video conferencing services for smooth cooperation. Furthermore, major organizations priorities scalability, security, and integration capabilities, all of which are provided by top video conferencing services. Their substantial infrastructure and IT divisions also help with the implementation and administration of modern video conferencing systems. As a result of their increased need and willingness to adopt cutting-edge communication technology, large organizations account for the vast majority of market share.
Video Conferencing Applications
There are several reasons for the enterprise segment's market supremacy in video conferencing. enterprises employ video conferencing for a number of reasons, including remote collaboration, virtual meetings, training sessions, and client presentations. Enterprise adoption is driven by a desire to improve communication efficiency, optimise workflows, and increase collaboration among workers, partners, and clients. Furthermore, the growing popularity of remote work and geographically scattered teams raises the demand for enterprise-grade video conferencing solutions. Enterprises prioritise aspects like security, scalability, and integration, which are frequently supplied by leading video conferencing solutions. Furthermore, corporations have higher funds and resources to invest in modern video conferencing systems, which contributes to their market domination.
Video Conferencing End Uses
- Corporate
- Education
- Healthcare
- Government & Defense
- BFSI
- Media & Entertainment
- Others
The corporate sector has the highest share of the video conferencing industry for various compelling reasons. To begin, organisations rely significantly on video conferencing for internal and external communication, such as team meetings, client presentations, and remote collaborations. With the globalisation of corporate operations, organisations frequently have geographically distributed teams and locations, demanding sophisticated video conferencing solutions to ensure smooth communication and cooperation. Furthermore, the corporate sector prioritises qualities like security, scalability, and integration capabilities, which are critical for managing sensitive business communications. Furthermore, the current spike in remote work trends has boosted demand for corporate video conferencing solutions, as businesses strive to retain productivity and communication among scattered teams. As a result, the corporate segment emerges as the key source of development in the video conferencing market.
Video Conferencing Market Regional Outlook
North America
Europe
- U.K.
- Germany
- France
- Spain
- Rest of Europe
Asia-Pacific
- India
- Japan
- China
- Australia
- South Korea
- Rest of Asia-Pacific
Latin America
- Brazil
- Mexico
- Rest of Latin America
The Middle East & Africa
- South Africa
- GCC Countries
- Rest of the Middle East & Africa (ME&A)
Video Conferencing Market Regional Analysis
The North American market is expected to account for a significant revenue share, driven by rising demand from various end-use industries. Additionally, the availability of advanced infrastructure to facilitate the adoption of sophisticated communication solutions further supports the growth of the target market in this region.
In Asia-Pacific, faster growth is anticipated in the near future, primarily due to industries embracing the work-from-home culture. Furthermore, strategic business development activities by major players to increase their business presence are expected to bolster the growth of the target market in this region.
Video Conferencing Market Players
Some of the top video conferencing companies offered in our report includes Huawei Technologies Co., Ltd., Atlassian Corporation Plc., Polycom, Inc., Vidyo, Inc., Cisco Systems, Inc., Microsoft Corporation, LogMeIn, Inc., Adobe Systems Incorporated, Logitech International S.A., JOYCE CR, S.R.O., Orange Business Services, and Fuze, Inc.
CHAPTER 1. Industry Overview of Video Conferencing Market
1.1. Definition and Scope
1.1.1. Definition of Video Conferencing
1.1.2. Market Segmentation
1.1.3. Years Considered for the Study
1.1.4. Assumptions and Acronyms Used
1.1.4.1. Market Assumptions and Market Forecast
1.1.4.2. Acronyms Used in Global Video Conferencing Market
1.2. Summary
1.2.1. Executive Summary
1.2.2. Video Conferencing Market By Component
1.2.3. Video Conferencing Market By Deployment Mode
1.2.4. Video Conferencing Market By Enterprise Size
1.2.5. Video Conferencing Market By Application
1.2.6. Video Conferencing Market By End Use
1.2.7. Video Conferencing Market By Region
CHAPTER 2. Research Approach
2.1. Methodology
2.1.1. Research Programs
2.1.2. Market Size Estimation
2.1.3. Market Breakdown and Data Triangulation
2.2. Data Source
2.2.1. Secondary Sources
2.2.2. Primary Sources
CHAPTER 3. Market Dynamics And Competition Analysis
3.1. Market Drivers
3.1.1. Driver 1
3.1.2. Driver 2
3.2. Restraints and Challenges
3.2.1. Restraint 1
3.2.2. Restraint 2
3.3. Growth Opportunities
3.3.1. Opportunity 1
3.3.2. Opportunity 2
3.4. Porter’s Five Forces Analysis
3.4.1. Bargaining Power of Suppliers
3.4.2. Bargaining Power of Buyers
3.4.3. Threat of Substitute
3.4.4. Threat of New Entrants
3.4.5. Degree of Competition
3.5. Market Concentration Ratio and Market Maturity Analysis of Video Conferencing Market
3.5.1. Go To Market Strategy
3.5.1.1. Introduction
3.5.1.2. Growth
3.5.1.3. Maturity
3.5.1.4. Saturation
3.5.1.5. Possible Development
3.6. Technological Roadmap for Video Conferencing Market
3.7. Value Chain Analysis
3.7.1. List of Key Manufacturers
3.7.2. List of Customers
3.7.3. Level of Integration
3.8. Regulatory Compliance
3.9. Competitive Landscape, 2022
3.9.1. Player Positioning Analysis
3.9.2. Key Strategies Adopted By Leading Players
CHAPTER 4. Video Conferencing Market By Component
4.1. Introduction
4.2. Video Conferencing Revenue By Component
4.2.1. Video Conferencing Revenue (USD Million) and Forecast, By Component, 2020-2032
4.2.2. Hardware
4.2.2.1. Hardware Market Revenue (USD Million) and Growth Rate (%), 2020-2032
4.2.2.2. Camera
4.2.2.2.1. Camera Market Revenue (USD Million) and Growth Rate (%), 2020-2032
4.2.2.3. Microphone & Headphone
4.2.2.3.1. Microphone & Headphone Market Revenue (USD Million) and Growth Rate (%), 2020-2032
4.2.2.4. Others
4.2.2.4.1. Others Market Revenue (USD Million) and Growth Rate (%), 2020-2032
4.2.3. Software
4.2.3.1. Software Market Revenue (USD Million) and Growth Rate (%), 2020-2032
4.2.4. Services
4.2.4.1. Services Market Revenue (USD Million) and Growth Rate (%), 2020-2032
4.2.4.2. Professional Service
4.2.4.2.1. Professional Service Market Revenue (USD Million) and Growth Rate (%), 2020-2032
4.2.4.3. Managed Service
4.2.4.3.1. Managed Service Market Revenue (USD Million) and Growth Rate (%), 2020-2032
CHAPTER 5. Video Conferencing Market By Deployment Mode
5.1. Introduction
5.2. Video Conferencing Revenue By Deployment Mode
5.2.1. Video Conferencing Revenue (USD Million) and Forecast, By Deployment Mode, 2020-2032
5.2.2. On-premise
5.2.2.1. On-premise Market Revenue (USD Million) and Growth Rate (%), 2020-2032
5.2.3. Cloud
5.2.3.1. Cloud Market Revenue (USD Million) and Growth Rate (%), 2020-2032
CHAPTER 6. Video Conferencing Market By Enterprise Size
6.1. Introduction
6.2. Video Conferencing Revenue By Enterprise Size
6.2.1. Video Conferencing Revenue (USD Million) and Forecast, By Enterprise Size, 2020-2032
6.2.2. Large Enterprises
6.2.2.1. Large Enterprises Market Revenue (USD Million) and Growth Rate (%), 2020-2032
6.2.3. Small & Medium Enterprises (SMEs)
6.2.3.1. Small & Medium Enterprises (SMEs) Market Revenue (USD Million) and Growth Rate (%), 2020-2032
CHAPTER 7. Video Conferencing Market By Application
7.1. Introduction
7.2. Video Conferencing Revenue By Application
7.2.1. Video Conferencing Revenue (USD Million) and Forecast, By Application, 2020-2032
7.2.2. Consumer
7.2.2.1. Consumer Market Revenue (USD Million) and Growth Rate (%), 2020-2032
7.2.3. Enterprise
7.2.3.1. Enterprise Market Revenue (USD Million) and Growth Rate (%), 2020-2032
CHAPTER 8. Video Conferencing Market By End Use
8.1. Introduction
8.2. Video Conferencing Revenue By End Use
8.2.1. Video Conferencing Revenue (USD Million) and Forecast, By End Use, 2020-2032
8.2.2. Corporate
8.2.2.1. Corporate Market Revenue (USD Million) and Growth Rate (%), 2020-2032
8.2.3. Education
8.2.3.1. Education Market Revenue (USD Million) and Growth Rate (%), 2020-2032
8.2.4. Healthcare
8.2.4.1. Healthcare Market Revenue (USD Million) and Growth Rate (%), 2020-2032
8.2.5. Government & Defense
8.2.5.1. Government & Defense Market Revenue (USD Million) and Growth Rate (%), 2020-2032
8.2.6. BFSI
8.2.6.1. BFSI Market Revenue (USD Million) and Growth Rate (%), 2020-2032
8.2.7. Media & Entertainment
8.2.7.1. Media & Entertainment Market Revenue (USD Million) and Growth Rate (%), 2020-2032
8.2.8. Others
8.2.8.1. Others Market Revenue (USD Million) and Growth Rate (%), 2020-2032
CHAPTER 9. North America Video Conferencing Market By Country
9.1. North America Video Conferencing Market Overview
9.2. U.S.
9.2.1. U.S. Video Conferencing Revenue (USD Million) and Forecast By Deployment Mode, 2020-2032
9.2.2. U.S. Video Conferencing Revenue (USD Million) and Forecast By Component, 2020-2032
9.2.3. U.S. Video Conferencing Revenue (USD Million) and Forecast By Enterprise Size, 2020-2032
9.2.4. U.S. Video Conferencing Revenue (USD Million) and Forecast By Application, 2020-2032
9.2.5. U.S. Video Conferencing Revenue (USD Million) and Forecast By End Use, 2020-2032
9.3. Canada
9.3.1. Canada Video Conferencing Revenue (USD Million) and Forecast By Deployment Mode, 2020-2032
9.3.2. Canada Video Conferencing Revenue (USD Million) and Forecast By Component, 2020-2032
9.3.3. Canada Video Conferencing Revenue (USD Million) and Forecast By Enterprise Size, 2020-2032
9.3.4. Canada Video Conferencing Revenue (USD Million) and Forecast By Application, 2020-2032
9.3.5. Canada Video Conferencing Revenue (USD Million) and Forecast By End Use, 2020-2032
9.4. North America PEST Analysis
CHAPTER 10. Europe Video Conferencing Market By Country
10.1. Europe Video Conferencing Market Overview
10.2. U.K.
10.2.1. U.K. Video Conferencing Revenue (USD Million) and Forecast By Deployment Mode, 2020-2032
10.2.2. U.K. Video Conferencing Revenue (USD Million) and Forecast By Component, 2020-2032
10.2.3. U.K. Video Conferencing Revenue (USD Million) and Forecast By Enterprise Size, 2020-2032
10.2.4. U.K. Video Conferencing Revenue (USD Million) and Forecast By Application, 2020-2032
10.2.5. U.K. Video Conferencing Revenue (USD Million) and Forecast By End Use, 2020-2032
10.3. Germany
10.3.1. Germany Video Conferencing Revenue (USD Million) and Forecast By Deployment Mode, 2020-2032
10.3.2. Germany Video Conferencing Revenue (USD Million) and Forecast By Component, 2020-2032
10.3.3. Germany Video Conferencing Revenue (USD Million) and Forecast By Enterprise Size, 2020-2032
10.3.4. Germany Video Conferencing Revenue (USD Million) and Forecast By Application, 2020-2032
10.3.5. Germany Video Conferencing Revenue (USD Million) and Forecast By End Use, 2020-2032
10.4. France
10.4.1. France Video Conferencing Revenue (USD Million) and Forecast By Deployment Mode, 2020-2032
10.4.2. France Video Conferencing Revenue (USD Million) and Forecast By Component, 2020-2032
10.4.3. France Video Conferencing Revenue (USD Million) and Forecast By Enterprise Size, 2020-2032
10.4.4. France Video Conferencing Revenue (USD Million) and Forecast By Application, 2020-2032
10.4.5. France Video Conferencing Revenue (USD Million) and Forecast By End Use, 2020-2032
10.5. Spain
10.5.1. Spain Video Conferencing Revenue (USD Million) and Forecast By Deployment Mode, 2020-2032
10.5.2. Spain Video Conferencing Revenue (USD Million) and Forecast By Component, 2020-2032
10.5.3. Spain Video Conferencing Revenue (USD Million) and Forecast By Enterprise Size, 2020-2032
10.5.4. Spain Video Conferencing Revenue (USD Million) and Forecast By Application, 2020-2032
10.5.5. Spain Video Conferencing Revenue (USD Million) and Forecast By End Use, 2020-2032
10.6. Rest of Europe
10.6.1. Rest of Europe Video Conferencing Revenue (USD Million) and Forecast By Deployment Mode, 2020-2032
10.6.2. Rest of Europe Video Conferencing Revenue (USD Million) and Forecast By Component, 2020-2032
10.6.3. Rest of Europe Video Conferencing Revenue (USD Million) and Forecast By Enterprise Size, 2020-2032
10.6.4. Rest of Europe Video Conferencing Revenue (USD Million) and Forecast By Application, 2020-2032
10.6.5. Rest of Europe Video Conferencing Revenue (USD Million) and Forecast By End Use, 2020-2032
10.7. Europe PEST Analysis
CHAPTER 11. Asia Pacific Video Conferencing Market By Country
11.1. Asia Pacific Video Conferencing Market Overview
11.2. China
11.2.1. China Video Conferencing Revenue (USD Million) and Forecast By Deployment Mode, 2020-2032
11.2.2. China Video Conferencing Revenue (USD Million) and Forecast By Component, 2020-2032
11.2.3. China Video Conferencing Revenue (USD Million) and Forecast By Enterprise Size, 2020-2032
11.2.4. China Video Conferencing Revenue (USD Million) and Forecast By Application, 2020-2032
11.2.5. China Video Conferencing Revenue (USD Million) and Forecast By End Use, 2020-2032
11.3. Japan
11.3.1. Japan Video Conferencing Revenue (USD Million) and Forecast By Deployment Mode, 2020-2032
11.3.2. Japan Video Conferencing Revenue (USD Million) and Forecast By Component, 2020-2032
11.3.3. Japan Video Conferencing Revenue (USD Million) and Forecast By Enterprise Size, 2020-2032
11.3.4. Japan Video Conferencing Revenue (USD Million) and Forecast By Application, 2020-2032
11.3.5. Japan Video Conferencing Revenue (USD Million) and Forecast By End Use, 2020-2032
11.4. India
11.4.1. India Video Conferencing Revenue (USD Million) and Forecast By Deployment Mode, 2020-2032
11.4.2. India Video Conferencing Revenue (USD Million) and Forecast By Component, 2020-2032
11.4.3. India Video Conferencing Revenue (USD Million) and Forecast By Enterprise Size, 2020-2032
11.4.4. India Video Conferencing Revenue (USD Million) and Forecast By Application, 2020-2032
11.4.5. India Video Conferencing Revenue (USD Million) and Forecast By End Use, 2020-2032
11.5. Australia
11.5.1. Australia Video Conferencing Revenue (USD Million) and Forecast By Deployment Mode, 2020-2032
11.5.2. Australia Video Conferencing Revenue (USD Million) and Forecast By Component, 2020-2032
11.5.3. Australia Video Conferencing Revenue (USD Million) and Forecast By Enterprise Size, 2020-2032
11.5.4. Australia Video Conferencing Revenue (USD Million) and Forecast By Application, 2020-2032
11.5.5. Australia Video Conferencing Revenue (USD Million) and Forecast By End Use, 2020-2032
11.6. South Korea
11.6.1. South Korea Video Conferencing Revenue (USD Million) and Forecast By Deployment Mode, 2020-2032
11.6.2. South Korea Video Conferencing Revenue (USD Million) and Forecast By Component, 2020-2032
11.6.3. South Korea Video Conferencing Revenue (USD Million) and Forecast By Enterprise Size, 2020-2032
11.6.4. South Korea Video Conferencing Revenue (USD Million) and Forecast By Application, 2020-2032
11.6.5. South Korea Video Conferencing Revenue (USD Million) and Forecast By End Use, 2020-2032
11.7. Rest of Asia-Pacific
11.7.1. Rest of Asia-Pacific Video Conferencing Revenue (USD Million) and Forecast By Deployment Mode, 2020-2032
11.7.2. Rest of Asia-Pacific Video Conferencing Revenue (USD Million) and Forecast By Component, 2020-2032
11.7.3. Rest of Asia-Pacific Video Conferencing Revenue (USD Million) and Forecast By Enterprise Size, 2020-2032
11.7.4. Rest of Asia-Pacific Video Conferencing Revenue (USD Million) and Forecast By Application, 2020-2032
11.7.5. Rest of Asia-Pacific Video Conferencing Revenue (USD Million) and Forecast By End Use, 2020-2032
11.8. Asia Pacific PEST Analysis
CHAPTER 12. Latin America Video Conferencing Market By Country
12.1. Latin America Video Conferencing Market Overview
12.2. Brazil
12.2.1. Brazil Video Conferencing Revenue (USD Million) and Forecast By Deployment Mode, 2020-2032
12.2.2. Brazil Video Conferencing Revenue (USD Million) and Forecast By Component, 2020-2032
12.2.3. Brazil Video Conferencing Revenue (USD Million) and Forecast By Enterprise Size, 2020-2032
12.2.4. Brazil Video Conferencing Revenue (USD Million) and Forecast By Application, 2020-2032
12.2.5. Brazil Video Conferencing Revenue (USD Million) and Forecast By End Use, 2020-2032
12.3. Mexico
12.3.1. Mexico Video Conferencing Revenue (USD Million) and Forecast By Deployment Mode, 2020-2032
12.3.2. Mexico Video Conferencing Revenue (USD Million) and Forecast By Component, 2020-2032
12.3.3. Mexico Video Conferencing Revenue (USD Million) and Forecast By Enterprise Size, 2020-2032
12.3.4. Mexico Video Conferencing Revenue (USD Million) and Forecast By Application, 2020-2032
12.3.5. Mexico Video Conferencing Revenue (USD Million) and Forecast By End Use, 2020-2032
12.4. Rest of Latin America
12.4.1. Rest of Latin America Video Conferencing Revenue (USD Million) and Forecast By Deployment Mode, 2020-2032
12.4.2. Rest of Latin America Video Conferencing Revenue (USD Million) and Forecast By Component, 2020-2032
12.4.3. Rest of Latin America Video Conferencing Revenue (USD Million) and Forecast By Enterprise Size, 2020-2032
12.4.4. Rest of Latin America Video Conferencing Revenue (USD Million) and Forecast By Application, 2020-2032
12.4.5. Rest of Latin America Video Conferencing Revenue (USD Million) and Forecast By End Use, 2020-2032
12.5. Latin America PEST Analysis
CHAPTER 13. Middle East & Africa Video Conferencing Market By Country
13.1. Middle East & Africa Video Conferencing Market Overview
13.2. GCC
13.2.1. GCC Video Conferencing Revenue (USD Million) and Forecast By Deployment Mode, 2020-2032
13.2.2. GCC Video Conferencing Revenue (USD Million) and Forecast By Component, 2020-2032
13.2.3. GCC Video Conferencing Revenue (USD Million) and Forecast By Enterprise Size, 2020-2032
13.2.4. GCC Video Conferencing Revenue (USD Million) and Forecast By Application, 2020-2032
13.2.5. GCC Video Conferencing Revenue (USD Million) and Forecast By End Use, 2020-2032
13.3. South Africa
13.3.1. South Africa Video Conferencing Revenue (USD Million) and Forecast By Deployment Mode, 2020-2032
13.3.2. South Africa Video Conferencing Revenue (USD Million) and Forecast By Component, 2020-2032
13.3.3. South Africa Video Conferencing Revenue (USD Million) and Forecast By Enterprise Size, 2020-2032
13.3.4. South Africa Video Conferencing Revenue (USD Million) and Forecast By Application, 2020-2032
13.3.5. South Africa Video Conferencing Revenue (USD Million) and Forecast By End Use, 2020-2032
13.4. Rest of Middle East & Africa
13.4.1. Rest of Middle East & Africa Video Conferencing Revenue (USD Million) and Forecast By Deployment Mode, 2020-2032
13.4.2. Rest of Middle East & Africa Video Conferencing Revenue (USD Million) and Forecast By Component, 2020-2032
13.4.3. Rest of Middle East & Africa Video Conferencing Revenue (USD Million) and Forecast By Enterprise Size, 2020-2032
13.4.4. Rest of Middle East & Africa Video Conferencing Revenue (USD Million) and Forecast By Application, 2020-2032
13.4.5. Rest of Middle East & Africa Video Conferencing Revenue (USD Million) and Forecast By End Use, 2020-2032
13.5. Middle East & Africa PEST Analysis
CHAPTER 14. Player Analysis Of Video Conferencing Market
14.1. Video Conferencing Market Company Share Analysis
14.2. Competition Matrix
14.2.1. Competitive Benchmarking of key players by price, presence, market share, and R&D investment
14.2.2. New Product Launches and Product Enhancements
14.2.3. Mergers And Acquisition In Global Video Conferencing Market
14.2.4. Partnership, Joint Ventures and Strategic Alliances/ Sales Agreements
CHAPTER 15. Company Profile
15.1. Huawei Technologies Co., Ltd.
15.1.1. Company Snapshot
15.1.2. Business Overview
15.1.3. Financial Overview
15.1.3.1. Revenue (USD Million), 2022
15.1.3.2. Huawei Technologies Co., Ltd. Video Conferencing Business Regional Distribution
15.1.4. Product /Service and Specification
15.1.5. Recent Developments & Business Strategy
15.2. Atlassian Corporation Plc.
15.3. Polycom, Inc.
15.4. Vidyo, Inc.
15.5. Cisco Systems, Inc.
15.6. Microsoft Corporation
15.7. LogMeIn, Inc.
15.8. Adobe Systems Incorporated
15.9. Logitech International S.A.
15.10. JOYCE CR, S.R.O.
15.11. Orange Business Services
15.12. Fuze, Inc.