Vehicle Analytics Market Size - Global Industry, Share, Analysis, Trends and Forecast 2022 - 2030
Published :
Report ID:
Pages :
Format :
Vehicle Analytics Market Size - Global Industry, Share, Analysis, Trends and Forecast 2022 - 2030
Report Coverage
- Industry Dynamics
- Market Size and Forecast Data
- Segment Analysis
- Competitive Landscape
- Regional Analysis with a Niche Focus on Country-Level Data
- High Level Analysis - Porter's, PESTEL, Value Chain, etc.
- Company Profiles of Key Players
- Option to Customize the Report As Per Your Specific Need
Request Sample Report
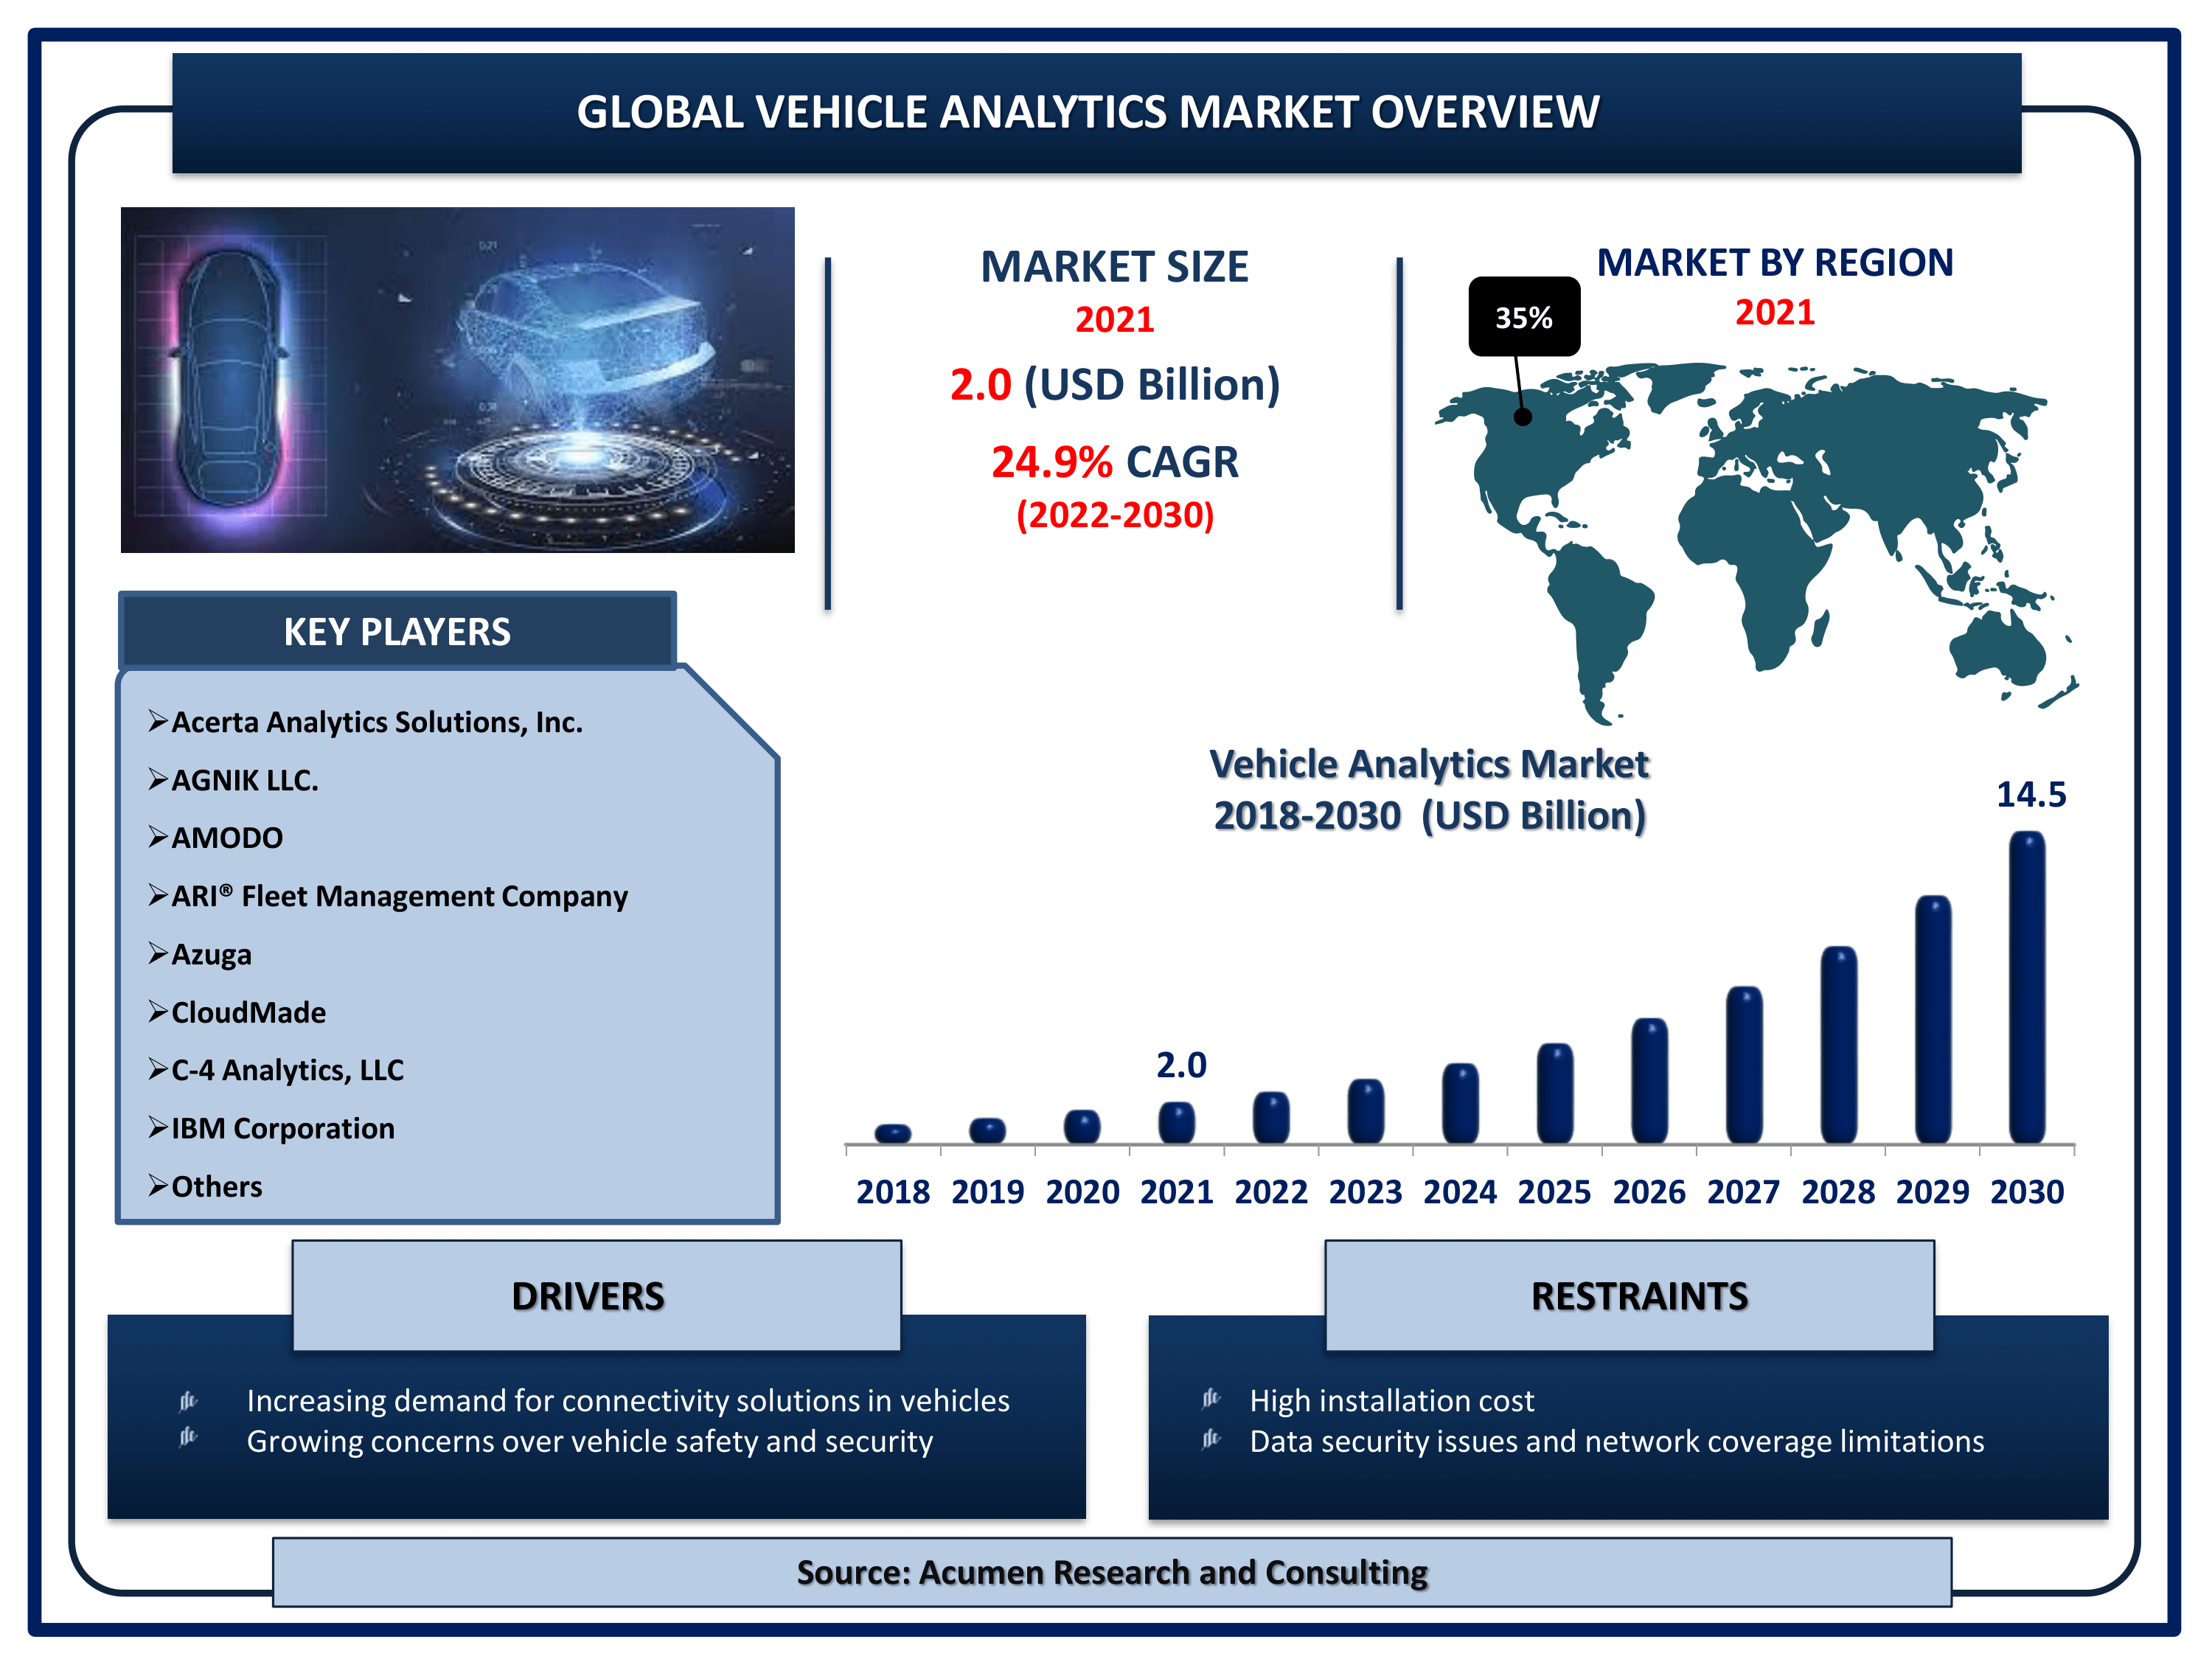
The Global Vehicle Analytics Market Size accounted for USD 2.0 Billion in 2021 and is projected to achieve a market size of USD 14.5 Billion by 2030 rising at a CAGR of 24.9% from 2022 to 2030. Vehicle data holds great promise for OEMs in terms of generating new revenue streams and expanding the potential of connected vehicle capabilities, including Usage-Based Insurance (UBI), real-time analytics, data marketplaces/monetization, and more. With analytics, an optimal trigger event based on fuel level, location, and direction could be created for drivers to assist them in maintaining various car-related issues. Analytics can reveal which customers are willing to monitor their driving in exchange for other benefits such as lower insurance rates or extended warranties. This can help to reduce traffic, CO2 emissions, and travel costs.

Vehicle Analytics Market Report Statistics
- Global vehicle analytics market revenue is estimated to reach USD 14.5 Billion by 2030 with a CAGR of 24.9% from 2022 to 2030
- North America vehicle analytics market share accounted for over 35% shares in 2021
- According to the our analysis, the global connected car fleet reached more than 84 million units in 2021
- Asia-Pacific vehicle analytics market growth will register fastest CAGR from 2022 to 2030
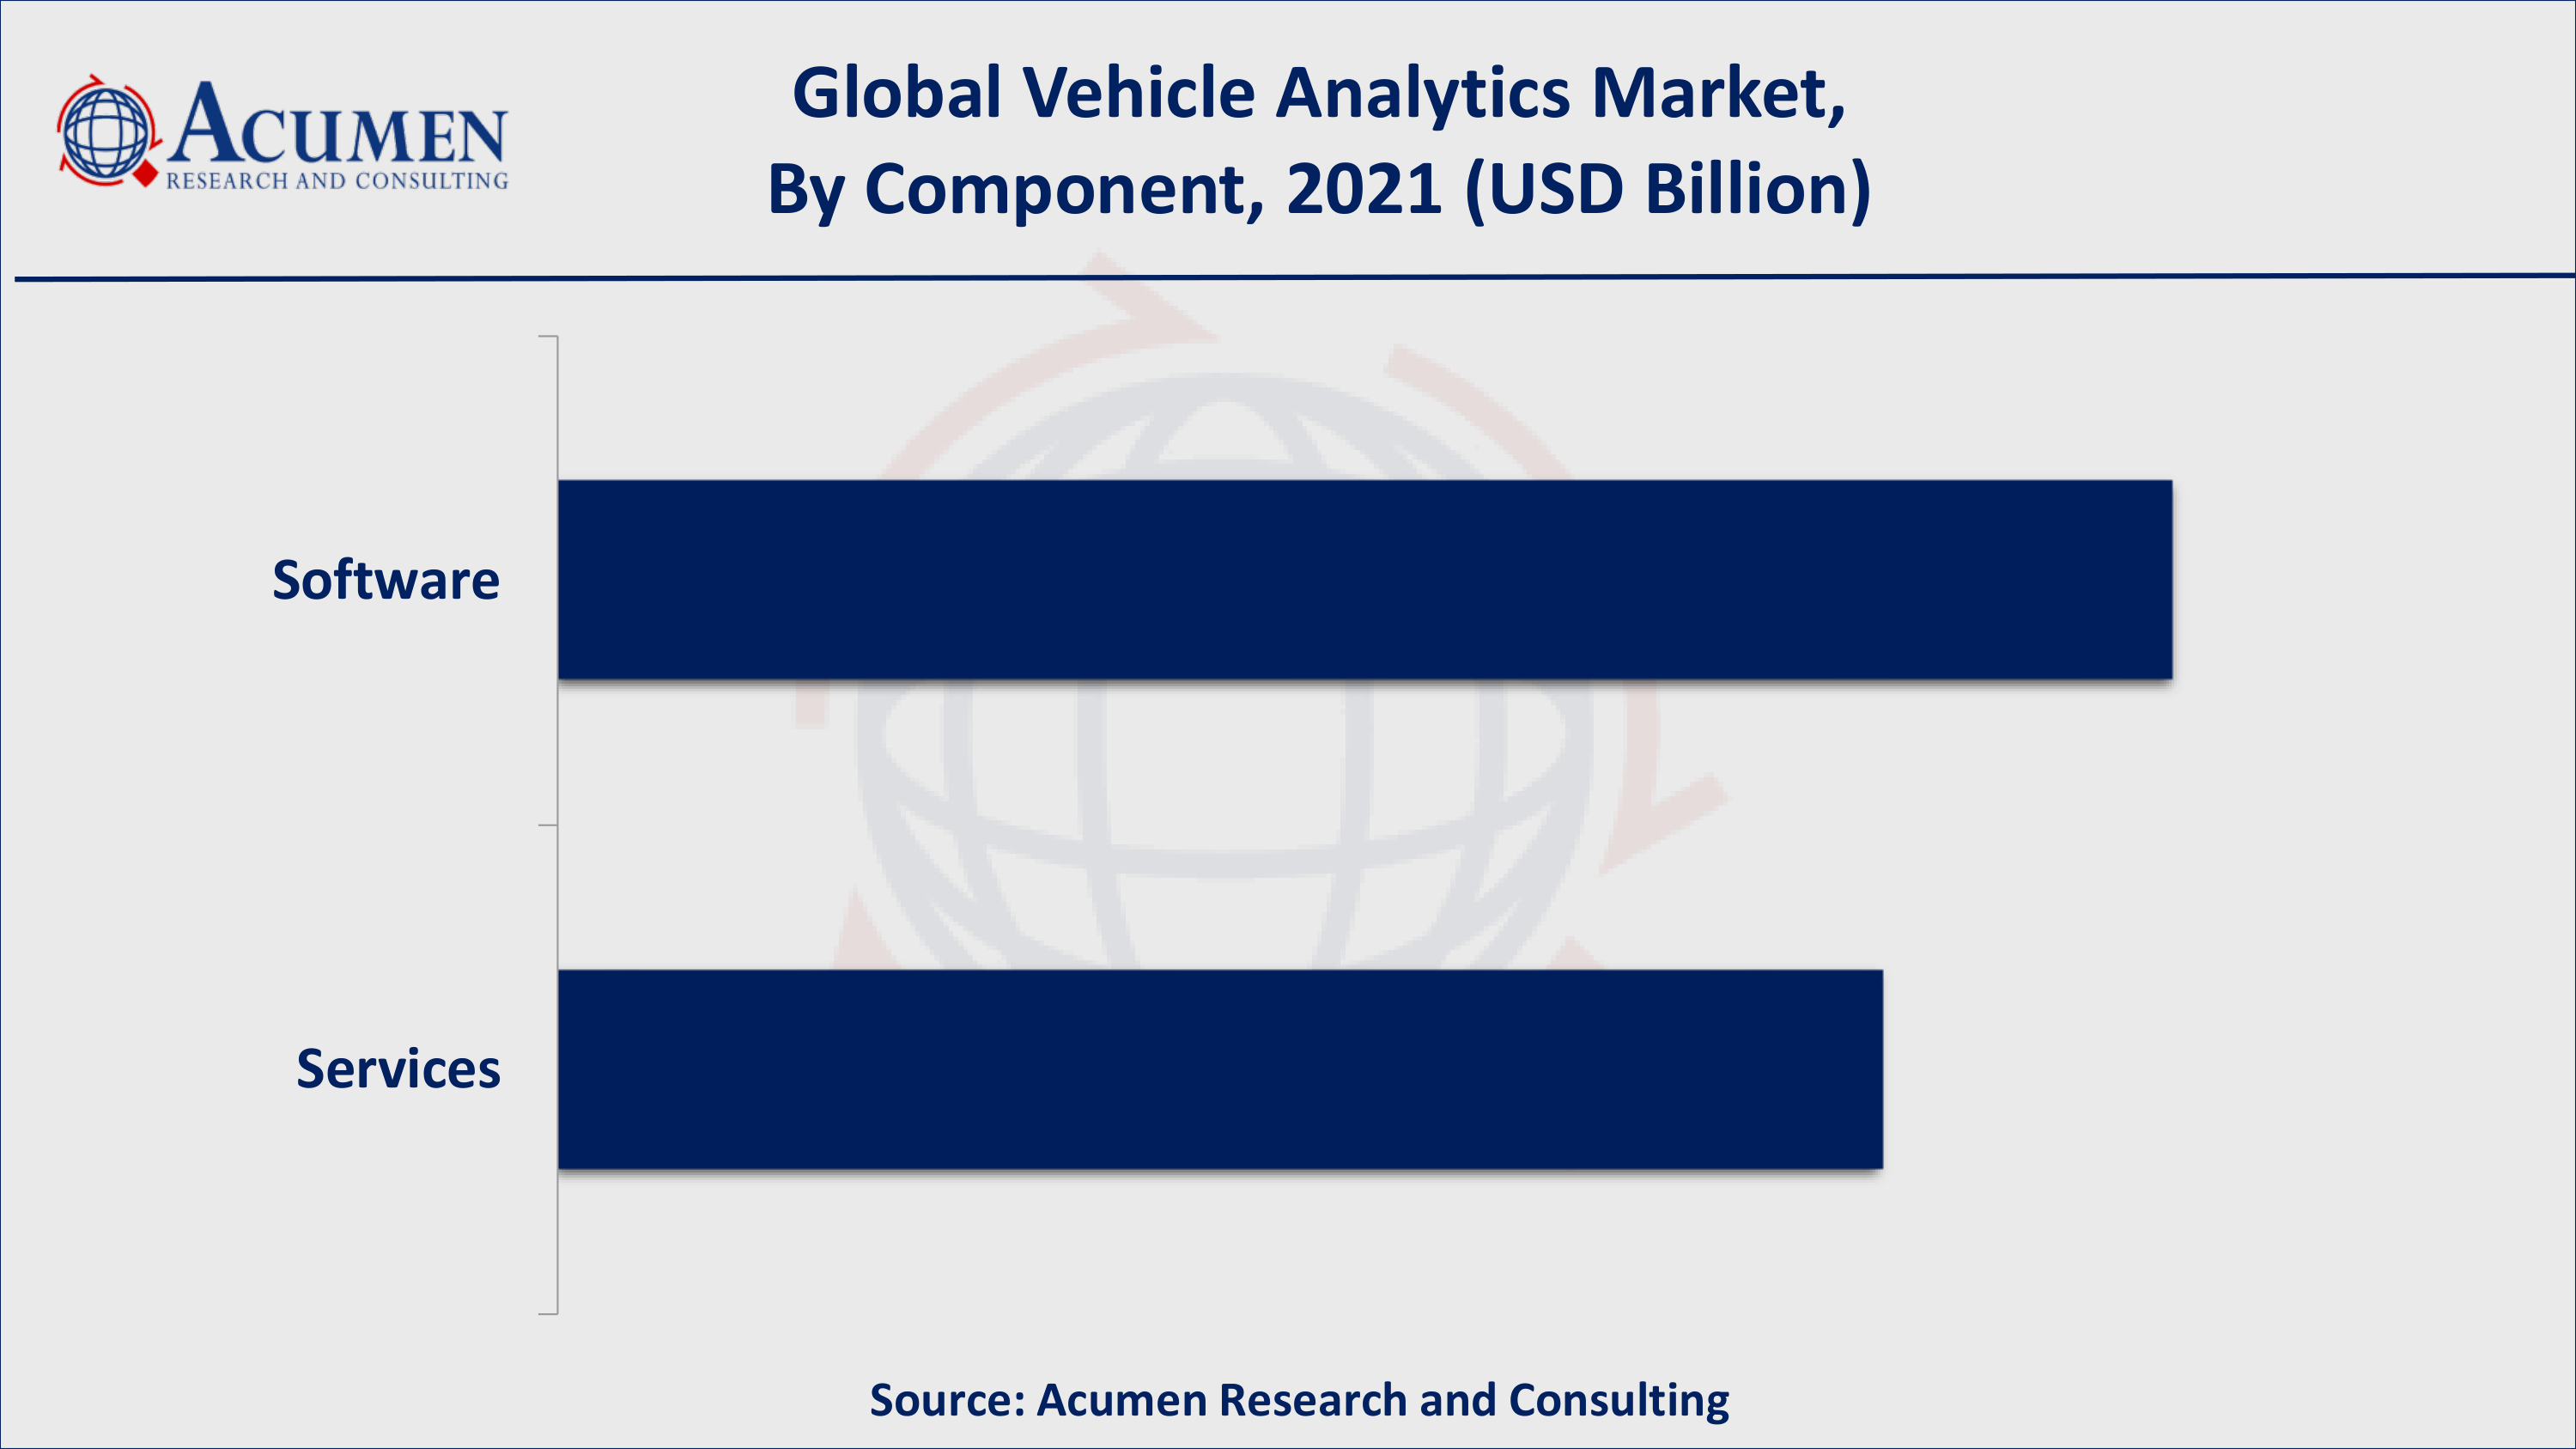
- Based on component, software gathered over 55% of the overall market share in 2021
- Increasing demand for connected car will fuel the global vehicle analytics market value
- Rising use of cloud-based technology in vehicles is a popular vehicle analytics market trend that is fueling the industry demand
Analytics Is Taking Auto Industry to New Heights
Digitalization is ushering in a new era of advanced manufacturing in the automotive industry, with elements that have been dubbed "Industry 4.0." Integration of advanced analytics, artificial intelligence, sensor technologies, the internet of things, cloud computing, blockchain, cyber-physical systems, machine learning, robotics, and 3D printing are among these technologies. Analytics assists in converting consumer data into a corporate asset in order to understand preferences and automobile usage data in order to increase customer acquisition and retention. It can assist the industry in increasing design efficiencies, procurement and smarter supply chain management, fine-tuning production lines for continuous improvement, distribution and marketing, and all aspects of automobile servicing. For example, each component of an automobile can be designed to improve both its appearance and its performance. Actual data collected on driving and passenger comfort, safety, engine performance, servicing history, and mileage – for every aspect of an automobile, its small and large components, and their individual performance across all parameters – can be used to gauge model-specific performance over its lifetime. This, in turn, provides car manufacturers with real-world data for designing and improving newer models.
Global Vehicle Analytics Market Dynamics
Market Drivers
- Increasing demand for connectivity solutions in vehicles
- Growing concerns over vehicle safety and security
- Rising use of real-time data collected from GPR and sensors
- Surging developments in autonomous and semi-autonomous vehicles
Market Restraints
- High installation cost
- Data security issues and network coverage limitations
Market Opportunities
- Advancement in technologies such as ML and predictive maintenance
- Growing partnerships between OEMs, fleet operators, and insurers
Vehicle Analytics Market Report Coverage
| Market | Vehicle Analytics Market |
| Vehicle Analytics Market Size 2021 | USD 2.0 Billion |
| Vehicle Analytics Market Forecast 2030 | USD 14.5 Billion |
| Vehicle Analytics Market CAGR During 2022 - 2030 | 24.9% |
| Vehicle Analytics Market Analysis Period | 2018 - 2030 |
| Vehicle Analytics Market Base Year | 2021 |
| Vehicle Analytics Market Forecast Data | 2022 - 2030 |
| Segments Covered | By Application, By Component, By Deployment Model, By End-User, And By Geography |
| Regional Scope | North America, Europe, Asia Pacific, Latin America, and Middle East & Africa |
| Key Companies Profiled | Acerta Analytics Solutions, Inc., AGNIK LLC., AMODO, ARI® Fleet Management Company, Azuga, CloudMade, C-4 Analytics, LLC, IBM Corporation, Genetec, Microsoft Corp., SAP SE, and among others. |
| Report Coverage |
Market Trends, Drivers, Restraints, Competitive Analysis, Player Profiling, Regulation Analysis |
COVID-19 impact on global vehicle analytics market
According to the IEA report, the Covid-19 pandemic will have a smaller impact on global electric vehicle markets than it will on the overall passenger car market. Based on car sales data from January to April 2020, we currently estimate that the passenger car market will contract by 15% year on year compared to 2019, while electric sales for passenger and commercial light-duty vehicles will remain broadly at 2019 levels. Second waves of the pandemic, as well as a slower-than-expected economic recovery, could result in different outcomes, as well as strategies for automakers to meet regulatory standards. In total, we estimate that electric car sales will account for approximately 3% of global car sales in 2020. Finally, there are indications that recovery efforts to address the Covid-19 crisis will continue to emphasize vehicle efficiency in general and electrification in particular.
Vehicle Analytics Market Insights
Factors such as an increase in the trend of connectivity solutions in automotive, an increase in the use of cloud-based technology for smart fleet management solutions, and an increase in concern for vehicle safety and security are expected to drive market growth. However, the high installation costs and security concerns associated with data communication are impeding market growth. Market participants entering into strategic partnerships with OEMs, insurers, and fleet operators to gain a competitive advantage, growing development in semi-autonomous & autonomous vehicles, and increased demand from developing countries are some of the factors expected to drive market growth. Furthermore, the market is expected to expand as a result of the increasing adoption of predictive analytics, which has been a logical upgrade for end-users who have implemented some form of automation and data collection solutions.
Apart from that, network coverage limitations and high initial setup costs are main hindrance to the growth of the vehicle analytics market. Data security concerns, as well as difficulties in integrating data with existing transportation systems, are stifling the adoption of vehicle analytics software and services.
Vehicle Analytics Market Segmentation
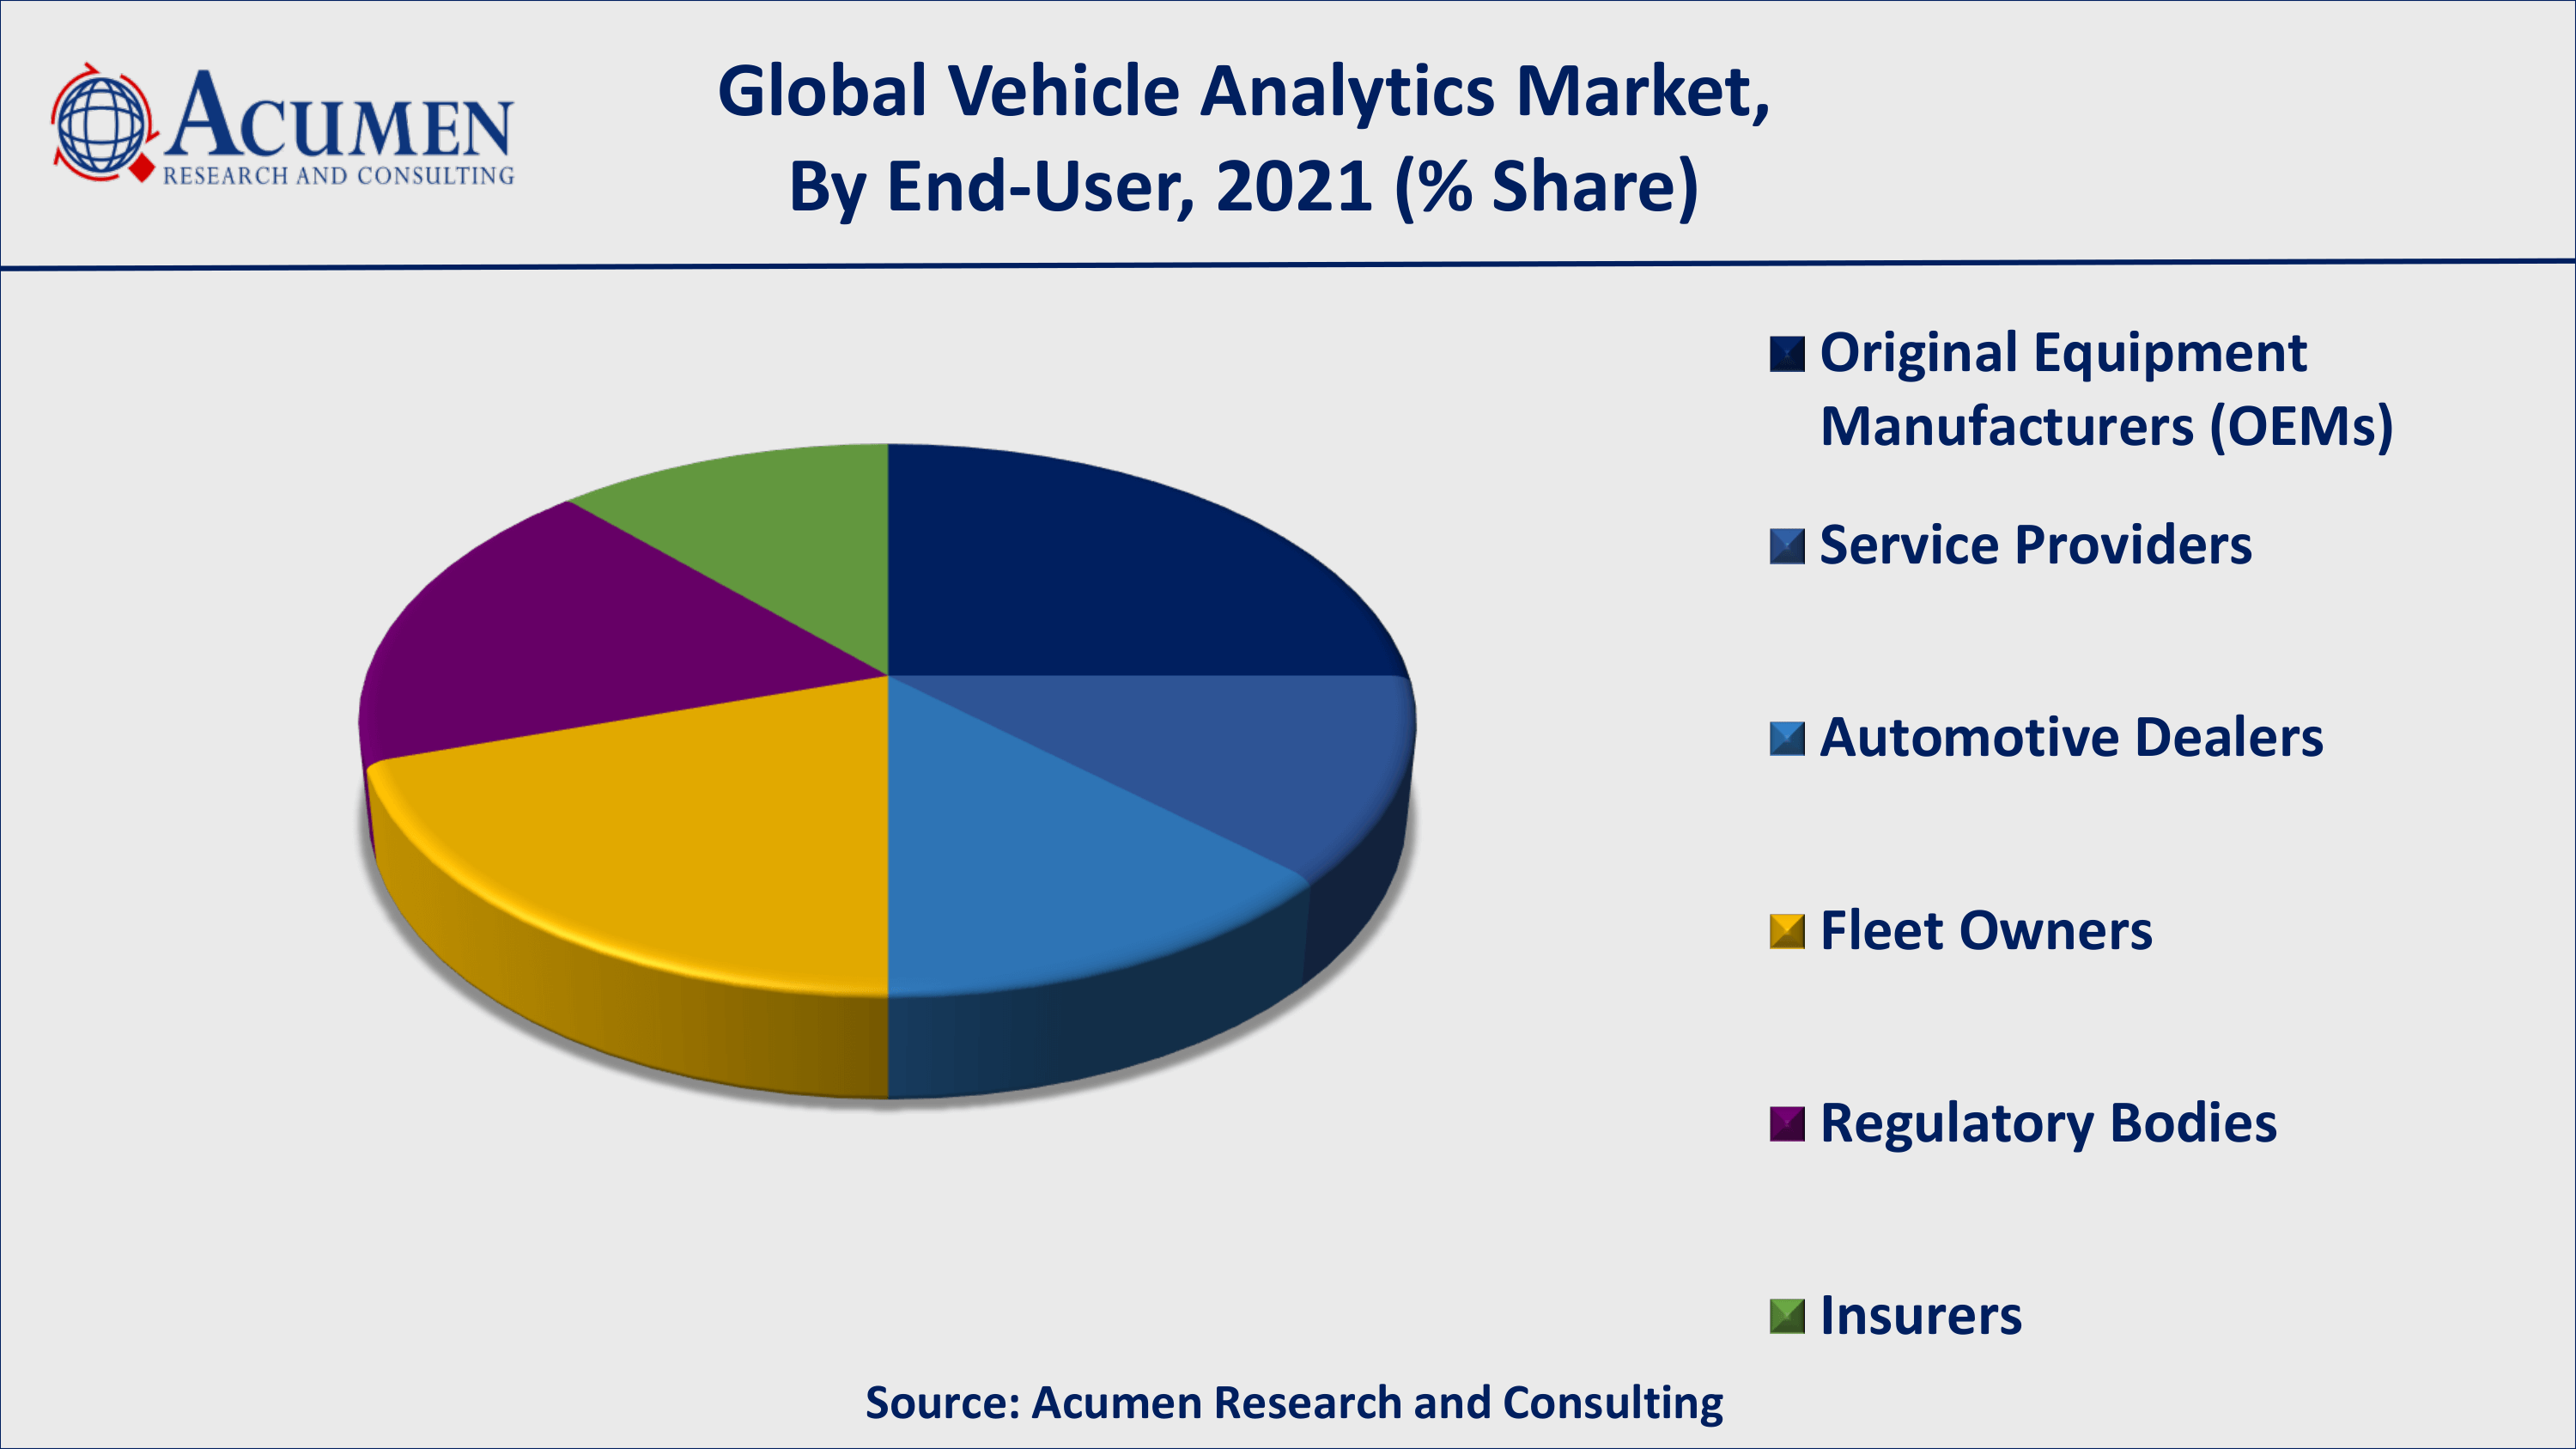
The worldwide vehicle analytics market is split based on application, component, deployment model, end-user, and geography. According to our vehicle analytics industry analysis, the safety and security management segment among applications dominates the global vehicle analytics market. According to the vehicle analytics market forecast, the on-demand deployment model is expected to dominate the global vehicle analytics market. Among components, the software sub-segment acquired a significant market share in 2021. However, the services sub-segment is anticipated to attain the fastest growth rate during the forecast timeframe from 2022 to 2030. Based on the end-user, the OEMs would dominate the vehicle analytics market value with utmost shares from 2022 to 2030.
Vehicle Analytics Market By Application
- Predictive Maintenance
- Warranty Analytics Traffic Management
- Safety and Security Management
- Driver and User Behavior Analysis
- Dealer Performance Analysis
- Infotainment
- Usage-Based Insurance
- Road Charging
Vehicle Analytics Market By Component
- Software
- Services

Vehicle Analytics Market By Deployment Model
- On-Premises
- On-Demand
Vehicle Analytics Market By End-User
- Original Equipment Manufacturers (OEMs)
- Service Providers
- Automotive Dealers
- Fleet Owners
- Regulatory Bodies
- Insurers

Vehicle Analytics Market Regional Outlook
North America
- U.S.
- Canada
Europe
- U.K.
- Germany
- France
- Spain
- Rest of Europe
Latin America
- Mexico
- Brazil
- Rest of Latin America
Asia-Pacific
- India
- Japan
- China
- Australia
- South Korea
- Rest of Asia-Pacific
The Middle East & Africa (MEA)
- Gulf Cooperation Council (GCC)
- South Africa
- Rest of the Middle East & Africa
Vehicle Analytics Market Regional Analysis
North America Holds the Dominant Market Share; Asia Pacific to Provide Lucrative Opportunities for the Vehicle Analytics Market to Grow
North America has dominated the vehicle analytics market revenue in the past, accounting for the largest share, and is expected to do so again during the forecast period. The growth in the North America region is primarily attributed to the increasing implementation of advanced technologies such as artificial intelligence, machine learning, and predictive maintenance in order to implement real-time data analysis in the region. It makes use of information gathered by sensors and GPS tracking devices. The region also has a well-established infrastructure, which makes advanced technologies easy to implement
Asia-Pacific, on the other hand, is expected to have the fastest growing CAGR in the coming years. The Asia-Pacific region's growth is primarily dominated by China due to the presence of a large manufacturing base, and China is also keeping pace with the North American region in terms of car manufacturing annually. This is one of the most important factors promoting global vehicle analytic growth.
Vehicle Analytics Market Players
Most of the vendors in the vehicle analytics market have adopted various growth strategies, such as acquisitions, agreements, collaborations and partnerships, new product launches, product up gradations, and expansions, to expand their client base and enhance the customer experience. The prominent players of the global vehicle analytics market involve Acerta Analytics Solutions, Inc., AGNIK LLC., AMODO, ARI® Fleet Management Company, Azuga, CloudMade, C-4 Analytics, LLC, IBM Corporation, Genetec, Microsoft Corp., SAP SE, and among others.
Frequently Asked Questions
What is the size of global vehicle analytics market in 2021?
The market size of vehicle analytics market in 2021 was accounted to be USD 2.0 Billion.
What is the CAGR of global vehicle analytics market during forecast period of 2022 to 2030?
The projected CAGR of vehicle analytics market during the analysis period of 2022 to 2030 is 24.9%.
Which are the key players operating in the market?
The prominent players of the global vehicle analytics market are Acerta Analytics Solutions, Inc., AGNIK LLC., AMODO, ARI� Fleet Management Company, Azuga, CloudMade, C-4 Analytics, LLC, IBM Corporation, Genetec, Microsoft Corp., SAP SE, and among others.
Which region held the dominating position in the global vehicle analytics market?
North America held the dominating vehicle analytics during the analysis period of 2022 to 2030.
Which region registered the fastest growing CAGR for the forecast period of 2022 to 2030?
Asia-Pacific region exhibited fastest growing CAGR for vehicle analytics during the analysis period of 2022 to 2030.
What are the current trends and dynamics in the global vehicle analytics market?
Increasing demand for connectivity solutions in vehicles, growing concerns over vehicle safety and security, and rising use of real-time data collected from GPR and sensors drives the growth of global vehicle analytics market.
Which application held the maximum share in 2021?
Based on application, predictive maintenance segment is expected to hold the maximum share vehicle analytics market.


