Upper Limb Prosthetics Market Size - Global Industry, Share, Analysis, Trends and Forecast 2024 - 2032
Published :
Report ID:
Pages :
Format :
Upper Limb Prosthetics Market Size - Global Industry, Share, Analysis, Trends and Forecast 2024 - 2032
Report Coverage
- Industry Dynamics
- Market Size and Forecast Data
- Segment Analysis
- Competitive Landscape
- Regional Analysis with a Niche Focus on Country-Level Data
- High Level Analysis - Porter's, PESTEL, Value Chain, etc.
- Company Profiles of Key Players
- Option to Customize the Report As Per Your Specific Need
Request Sample Report
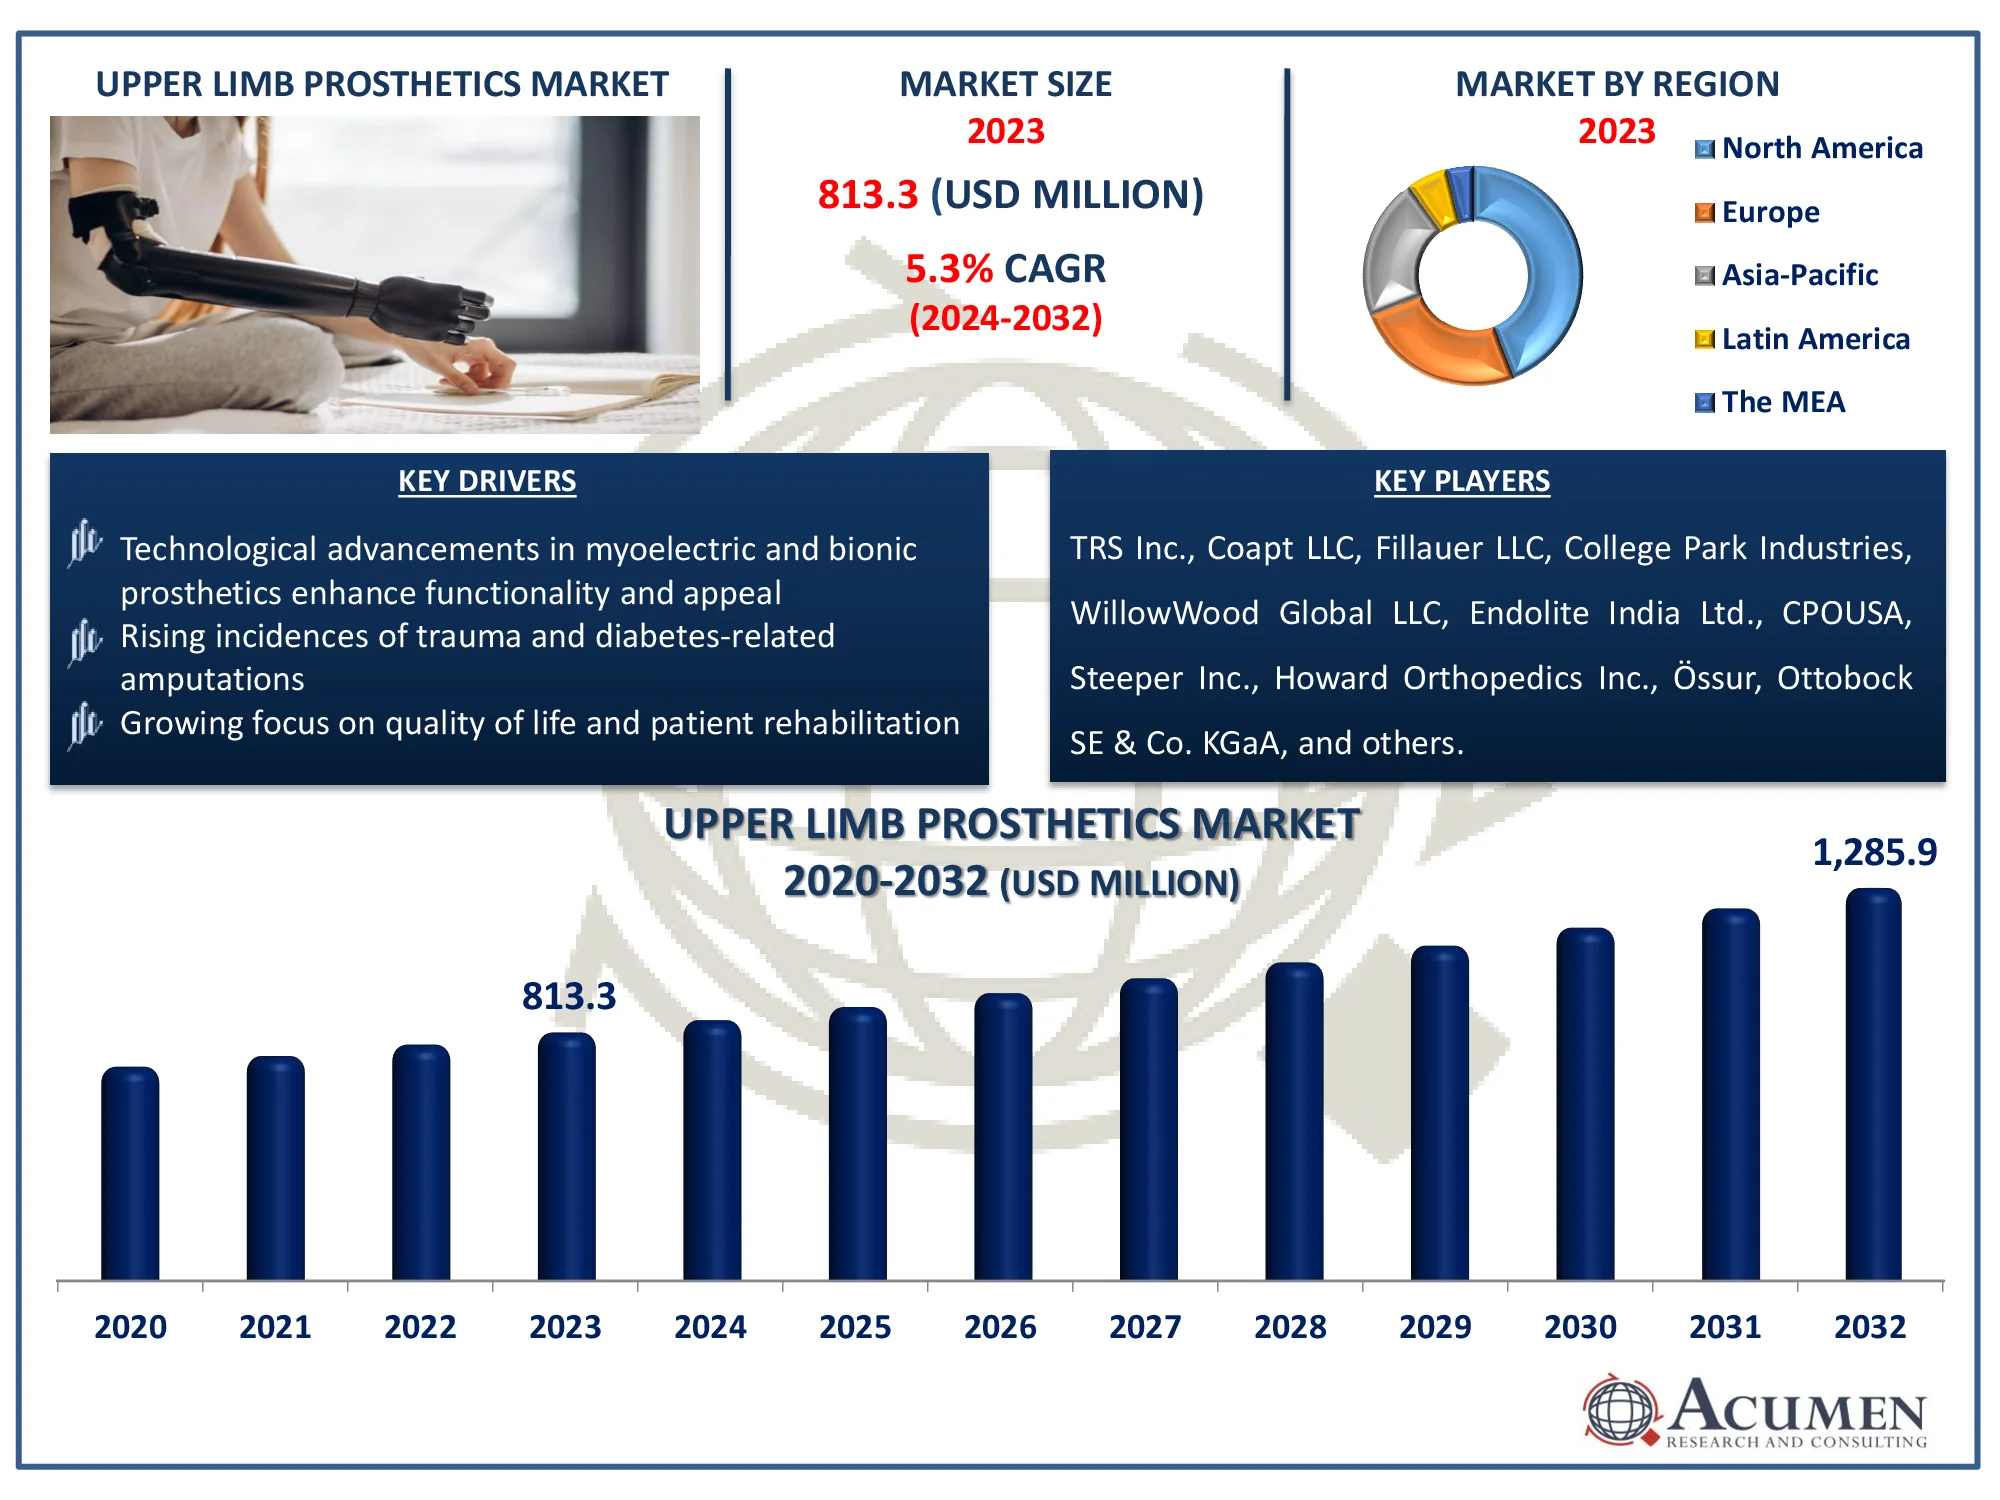
The Global Upper Limb Prosthetics Market Size accounted for USD 813.3 Million in 2023 and is estimated to achieve a market size of USD 1,285.9 Million by 2032 growing at a CAGR of 5.3% from 2024 to 2032.
Upper Limb Prosthetics Market Highlights
- The global upper limb prosthetics market is expected to reach USD 1,285.9 million by 2032, growing at a CAGR of 5.3% from 2024 to 2032
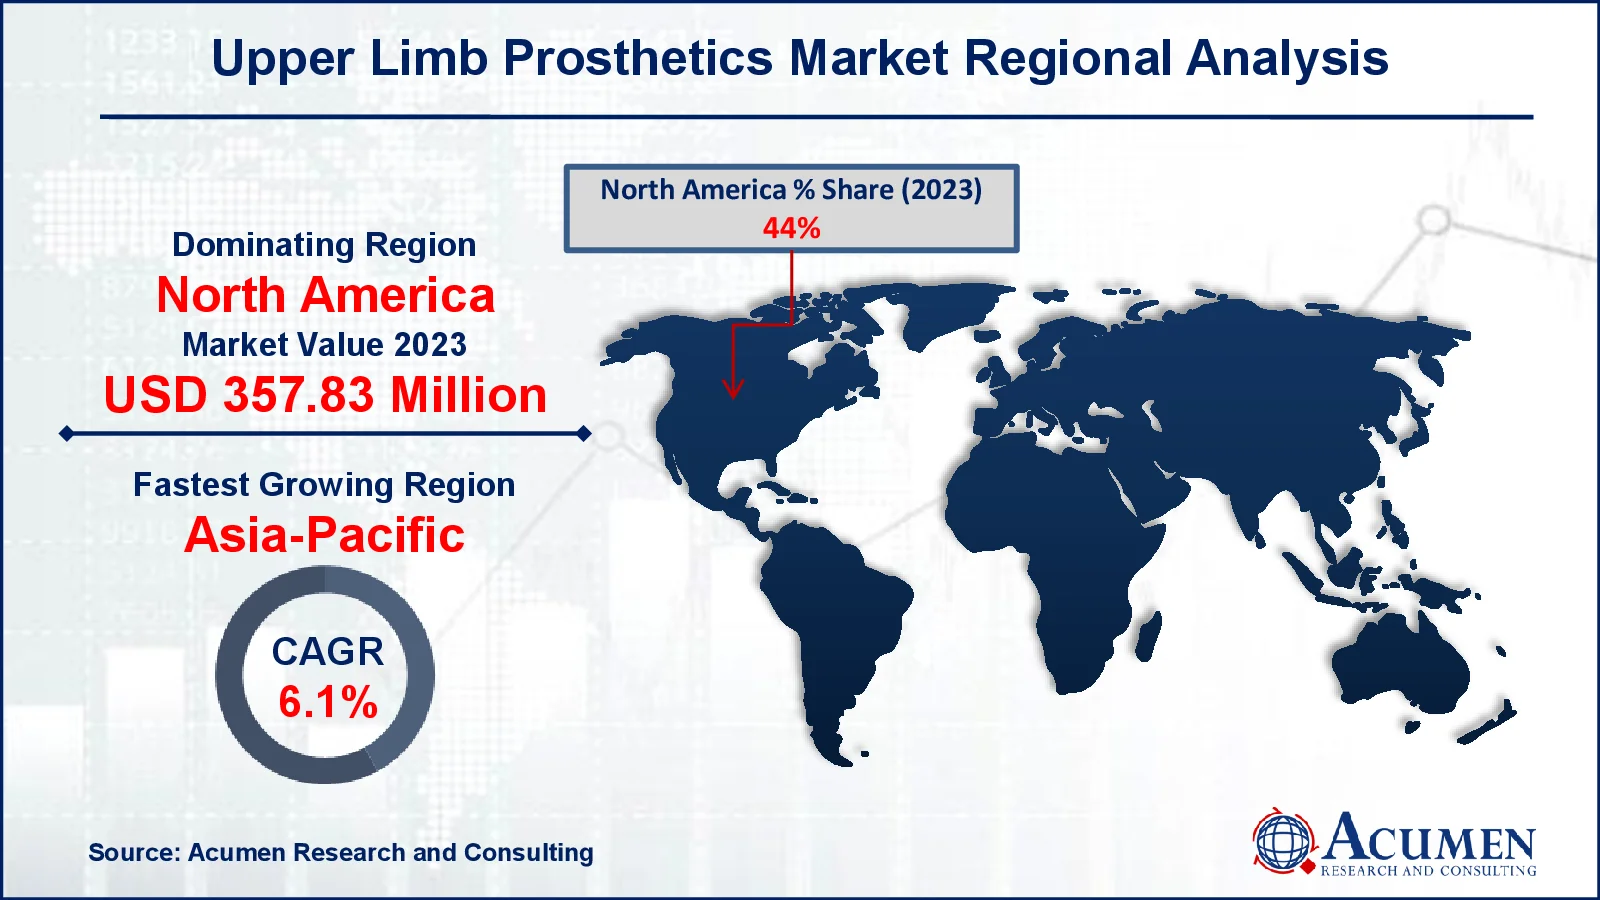
- In 2023, the North American upper limb prosthetics market was valued at approximately USD 357.83 million
- The Asia-Pacific upper limb prosthetics market is projected to grow at a CAGR of over 6.1% from 2024 to 2032
- The prosthetic arm sub-segment accounted for 31% of the market share in 2023
- The passive prosthetic devices sub-segment generated 34% of the market share in 2023
- Prosthetic clinics were the leading end-users, capturing 61% of the market share
- Increasing adoption of advanced passive prosthetic devices for enhanced functionality is the upper limb prosthetics market trend that fuels the industry demand

Upper limb prosthetics have advanced significantly from their ancient origins to the modern prostheses of today. Today's highest prosthesis implants are made of aluminum, polymers, and complex composite components. The goal is to equip amputees with a lightweight yet strong implant. These appliances provide capabilities through sophisticated technology while also being slower and heavy. The advanced implants provide essential motions that mimic normal tasks. Silicone pads are also available to give the upper limb prosthesis a more natural appearance. These advancements will fuel global upper limb prosthetics industry growth during the predicted period.
Global Upper Limb Prosthetics Market Dynamics
Market Drivers
- Technological advancements in myoelectric and bionic prosthetics enhance functionality and appeal
- Rising incidences of trauma and diabetes-related amputations increase demand for prosthetic solutions
- Growing focus on quality of life and patient rehabilitation drives innovation in upper limb prosthetics
Market Restraints
- High costs of advanced prosthetic devices limit accessibility for many potential users
- Limited healthcare coverage and reimbursement policies hinder market growth in certain regions
- Complexity and challenges in device fitting and maintenance affect user satisfaction and adoption rates
Market Opportunities
- Increasing demand for customized prosthetic solutions offers growth potential in personalized care
- Expanding markets in emerging economies provide new avenues for market penetration and growth
- Advancements in materials and sensors open doors for lighter, more functional, and affordable prosthetics
Upper Limb Prosthetics Market Report Coverage
| Market | Upper Limb Prosthetics Market |
| Upper Limb Prosthetics Market Size 2022 |
USD 813.3 Million |
| Upper Limb Prosthetics Market Forecast 2032 | USD 1,285.9 Million |
| Upper Limb Prosthetics Market CAGR During 2023 - 2032 | 5.3% |
| Upper Limb Prosthetics Market Analysis Period | 2020 - 2032 |
| Upper Limb Prosthetics Market Base Year |
2022 |
| Upper Limb Prosthetics Market Forecast Data | 2023 - 2032 |
| Segments Covered | By Component, By Product, By Cause, By End-User, And By Geography |
| Regional Scope | North America, Europe, Asia Pacific, Latin America, and Middle East & Africa |
| Key Companies Profiled | TRS Inc., Coapt LLC, Fillauer LLC, College Park Industries, WillowWood Global LLC, Endolite India Ltd., CPOUSA, Steeper Inc., Howard Orthopedics Inc., Össur, Ottobock SE & Co. KGaA, and others. |
| Report Coverage |
Market Trends, Drivers, Restraints, Competitive Analysis, Player Profiling, Covid-19 Analysis, Regulation Analysis |
Upper Limb Prosthetics Market Insights
A prosthetics implant is a man-made item used to replace lost limbs that may have been amputated due to injury or illness. Prosthetics is engaged in the manufacture and implantation of such implants. The goal of prosthesis is to allow the missing bodily part to perform its normal functions. The upper limb of the prosthesis includes a prosthetic neck, a prosthetic knee, a prosthetic arm, and terminal tools.
The rising number of accidents and incidents leads to an increase in amputations, resulting in the growth of the upper limb prothetics sector during the prediction era. Every year, more than one million limbs are amputated around the world. The majority of amputations are performed on the upper limb. The rising prevalence of diabetes is also a significant factor driving global market expansion. The International Diabetes Federation (IDF) predicts that the global diabetes prevalence will reach 435 million by 2030. Such variables will drive market expansion during the forecast period.
The increasing number of sports injuries will drive the global market for upper limb prostheses. The increasing prevalence of bone diseases such as osteosarcoma, osteoporosis, and osteopenia will drive global market expansion. The expanding geriatric population will also help drive market expansion. The increased usage of 3D printing in the production of prostheses will cut production costs, hence driving market growth. Demographic characteristics such as higher life expectancy and average age will have an impact on overall market growth. However, during the predicted period, the increased cost of prostheses and the maintenance costs of this equipment will stymie business growth.
Upper Limb Prosthetics Market Segmentation
The worldwide market for upper limb prosthetics is split based on component, product, cause, end-user, and geography.
Upper Limb Prosthetics Component
- Prosthetic Arm
- Prosthetic Wrist
- Prosthetic Shoulder
- Prosthetic Elbow
- Terminal Devices
According to the upper limb prosthetics industry analysis, the prosthetic arm segment dominates market because of its vital role in restoring functional capacities for those who have lost a limb. It improves users' dexterity and movement, making it an excellent alternative for people seeking a more active lifestyle. Material and technology advancements have improved the comfort, durability, and performance of prosthetic arms, fueling market development. As a result, the prosthetic arm sub-segment has a sizable market share, catering to the increased demand for more functional and diverse prosthetic solutions.
Upper Limb Prosthetics Product
- Body Powered Prosthetic Devices
- Passive Prosthetic Devices
- Hybrid Prosthetic Devices
- Myoelectric Prosthetic Devices
According to the upper limb prosthetics industry analysis, passive prosthesis systems accounted for the largest percentage of products 34% share, as global demand for simple and effective prosthesis systems expanded. Furthermore, because of their ease of use and low cost, passive prothetic devices now account for the majority of the global market.
The market for myoelectric prosthetics systems is expected to develop significantly throughout the forecast period. Muscles have electrical properties known as myoelectricity. A myoelectric prosthetics unit is an externally driven mechanical limb that can be controlled by muscle-generated electrical stimulation. Myoelectric prosthetics provide both characteristics and a natural appearance. The above-mentioned variables are expected to accelerate the development of myoelectric prosthetics systems in the coming years.
Upper Limb Prosthetics Cause
- Vascular Disease and Diabetes
- Trauma
- Cancer
According to the upper limb prosthetics market forecast, vascular illnesses and diabetes leads market. People with diabetes mellitus or peripheral artery disease are at a higher risk of amputation, according to healthcare providers. In these individuals, the body's cure technique is likewise limited. Because of these factors, the lung and diabetes division is expected to contribute the most to the global high limb prosthesis market during the prediction period.
Over the forecast period, the cancer segment is expected to see profitable growth. If the disease has advanced to the heart and nearby blood arteries, surgery with amputation is indicated. These elements are expected to boost the cancer segment's growth during the anticipated timeframe.
Upper Limb Prosthetics End-User
- Hospitals
- Ambulatory Surgical Centers
- Prosthetic Clinics
According to the upper limb prosthetics industry forecast, upper limb prostheses received the most demand from prosthetics clinics, accounting for the majority of the market share in 2023. A large proportion of prosthetics processes are carried out in such facilities. At prosthetic clinics, each patient receives individual care, and qualified personnel are accessible. Given the increasing number of patient cases and rising expertise of prosthetic hospitals, the category prosthetics labs will remain the largest end-use industry during the projected period.
Upper Limb Prosthetics Market Regional Outlook
North America
- U.S.
- Canada
Europe
- U.K.
- Germany
- France
- Spain
- Rest of Europe
Asia-Pacific
- India
- Japan
- China
- Australia
- South Korea
- Rest of Asia-Pacific
Latin America
- Brazil
- Mexico
- Rest of Latin America
The Middle East & Africa
- South Africa
- GCC Countries
- Rest of the Middle East & Africa (ME&A)

Upper Limb Prosthetics Market Regional Analysis
For several reasons, North America dominates market in 2023. The upper limb prosthetics market in the United States is anticipated to growing in recent years because of increased public awareness of prosthesis, increased use of sophisticated equipment, a large number of skilled experts, the presence of dominant industry participants, and the existence of highly developed healthcare infrastructures, the country dominated the global market in 2023. Furthermore, growing aging population and increased R&D expenditure in the United States for complex prostheses will drive corporate growth. For instance, the number of centenarians in the United States is expected to treble during the next three decades. According to U.S. Census Bureau forecasts, the number of Americans aged 100 and more will more than quadruple over the next three decades, from an expected 101,000 in 2024 to around 422,000 by 2054.
Asia-Pacific is anticipated to growing region in forecast year. India's upper limb prosthetics sector is expected to grow at a lucrative CAGR over the next few years, due to low pricing for prosthetic implants in the country, improved public aid measures for amputees, a growing elderly population, and advancements in healthcare technology. The variables listed above will enhance the demand for upper limb prostheses over the predicted period.
Upper Limb Prosthetics Market Players
Some of the top upper limb prosthetics companies offered in our report includes TRS Inc., Coapt LLC, Fillauer LLC, College Park Industries, WillowWood Global LLC, Endolite India Ltd., CPOUSA, Steeper Inc., Howard Orthopedics Inc., Össur, Ottobock SE & Co. KGaA, and others.
Frequently Asked Questions
How big is the upper limb prosthetics market?
The upper limb prosthetics market size was valued at USD 813.3 million in 2023.
What is the CAGR of the global upper limb prosthetics market from 2024 to 2032?
The CAGR of upper limb prosthetics is 5.3% during the analysis period of 2024 to 2032.
Which are the key players in the upper limb prosthetics market?
The key players operating in the global market are including TRS Inc., Coapt LLC, Fillauer LLC, College Park Industries, WillowWood Global LLC, Endolite India Ltd., CPOUSA, Steeper Inc., Howard Orthopedics Inc., �ssur, Ottobock SE & Co. KGaA, and others.
Which region dominated the global upper limb prosthetics market share?
North America held the dominating position in upper limb prosthetics industry during the analysis period of 2024 to 2032.
Which region registered fastest CAGR from 2024 to 2032?
Asia-Pacific region exhibited fastest growing CAGR for market of upper limb prosthetics during the analysis period of 2024 to 2032.
What are the current trends and dynamics in the global upper limb prosthetics industry?
The current trends and dynamics in the upper limb prosthetics industry include technological advancements in myoelectric and bionic prosthetics enhance functionality and appeal, rising incidences of trauma and diabetes-related amputations increase demand for prosthetic solutions, and growing focus on quality of life and patient rehabilitation drives innovation in upper limb prosthetics.
Which component held the maximum share in 2023?
The prosthetic arm component held the maximum share of the upper limb prosthetics industry.


