Unconventional Gas Market | Acumen Research and Consulting
Unconventional Gas Market Size - Global Industry, Share, Analysis, Trends and Forecast 2022 - 2030
Published :
Report ID:
Pages :
Format : 
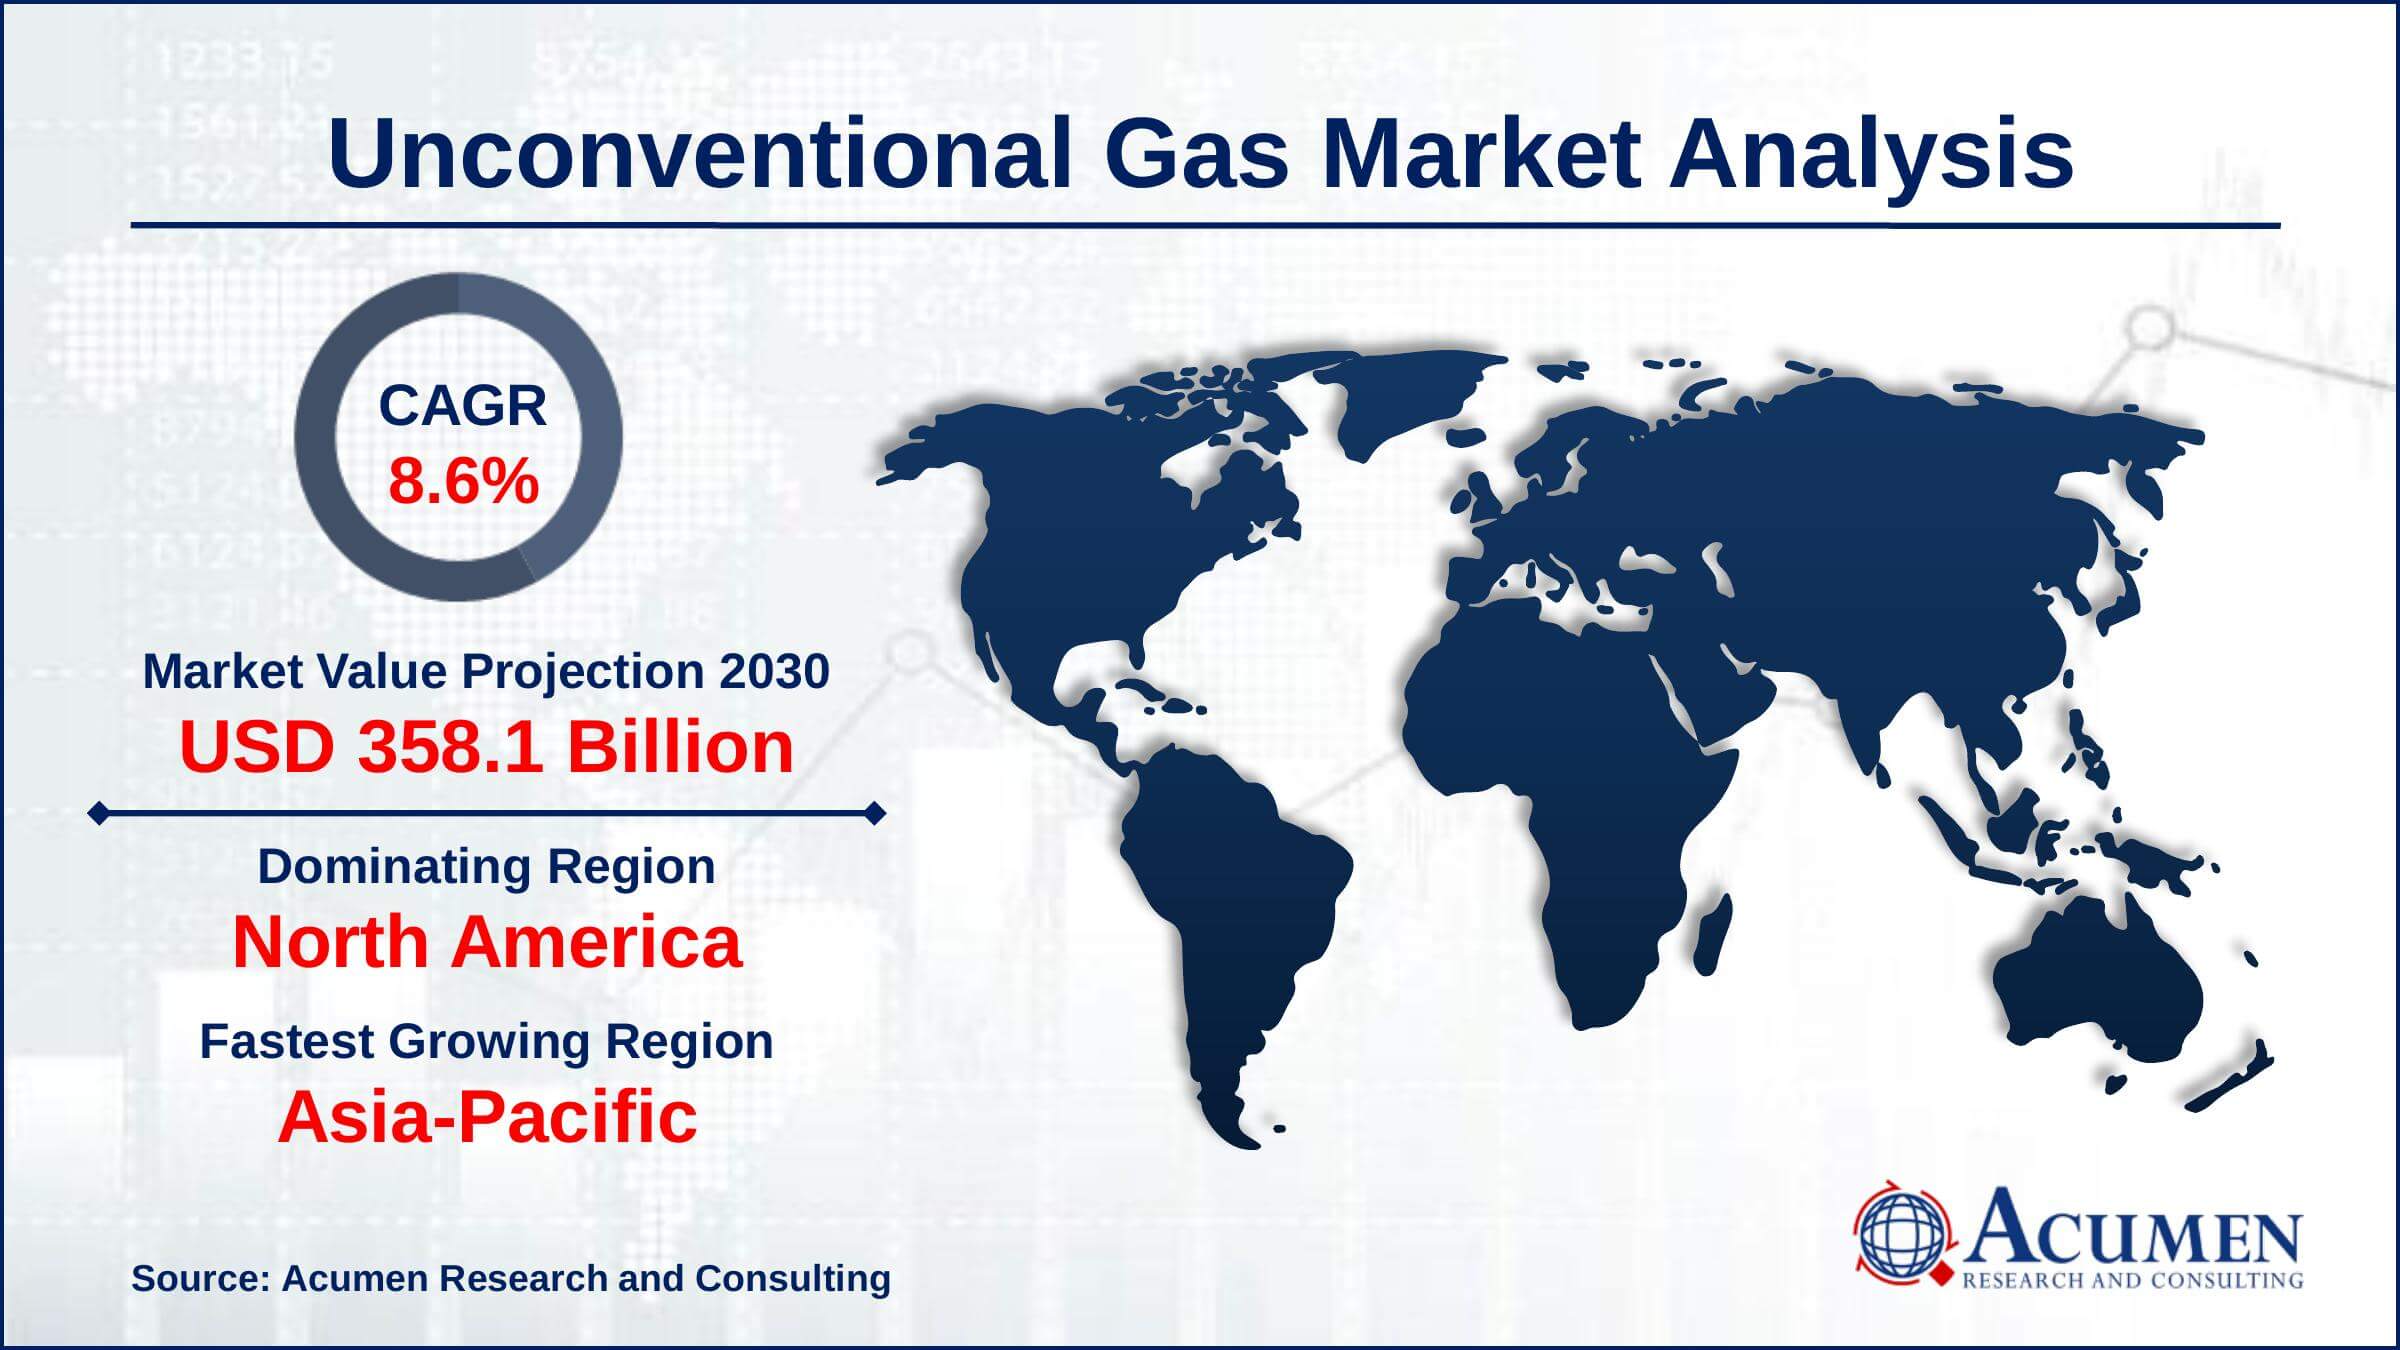
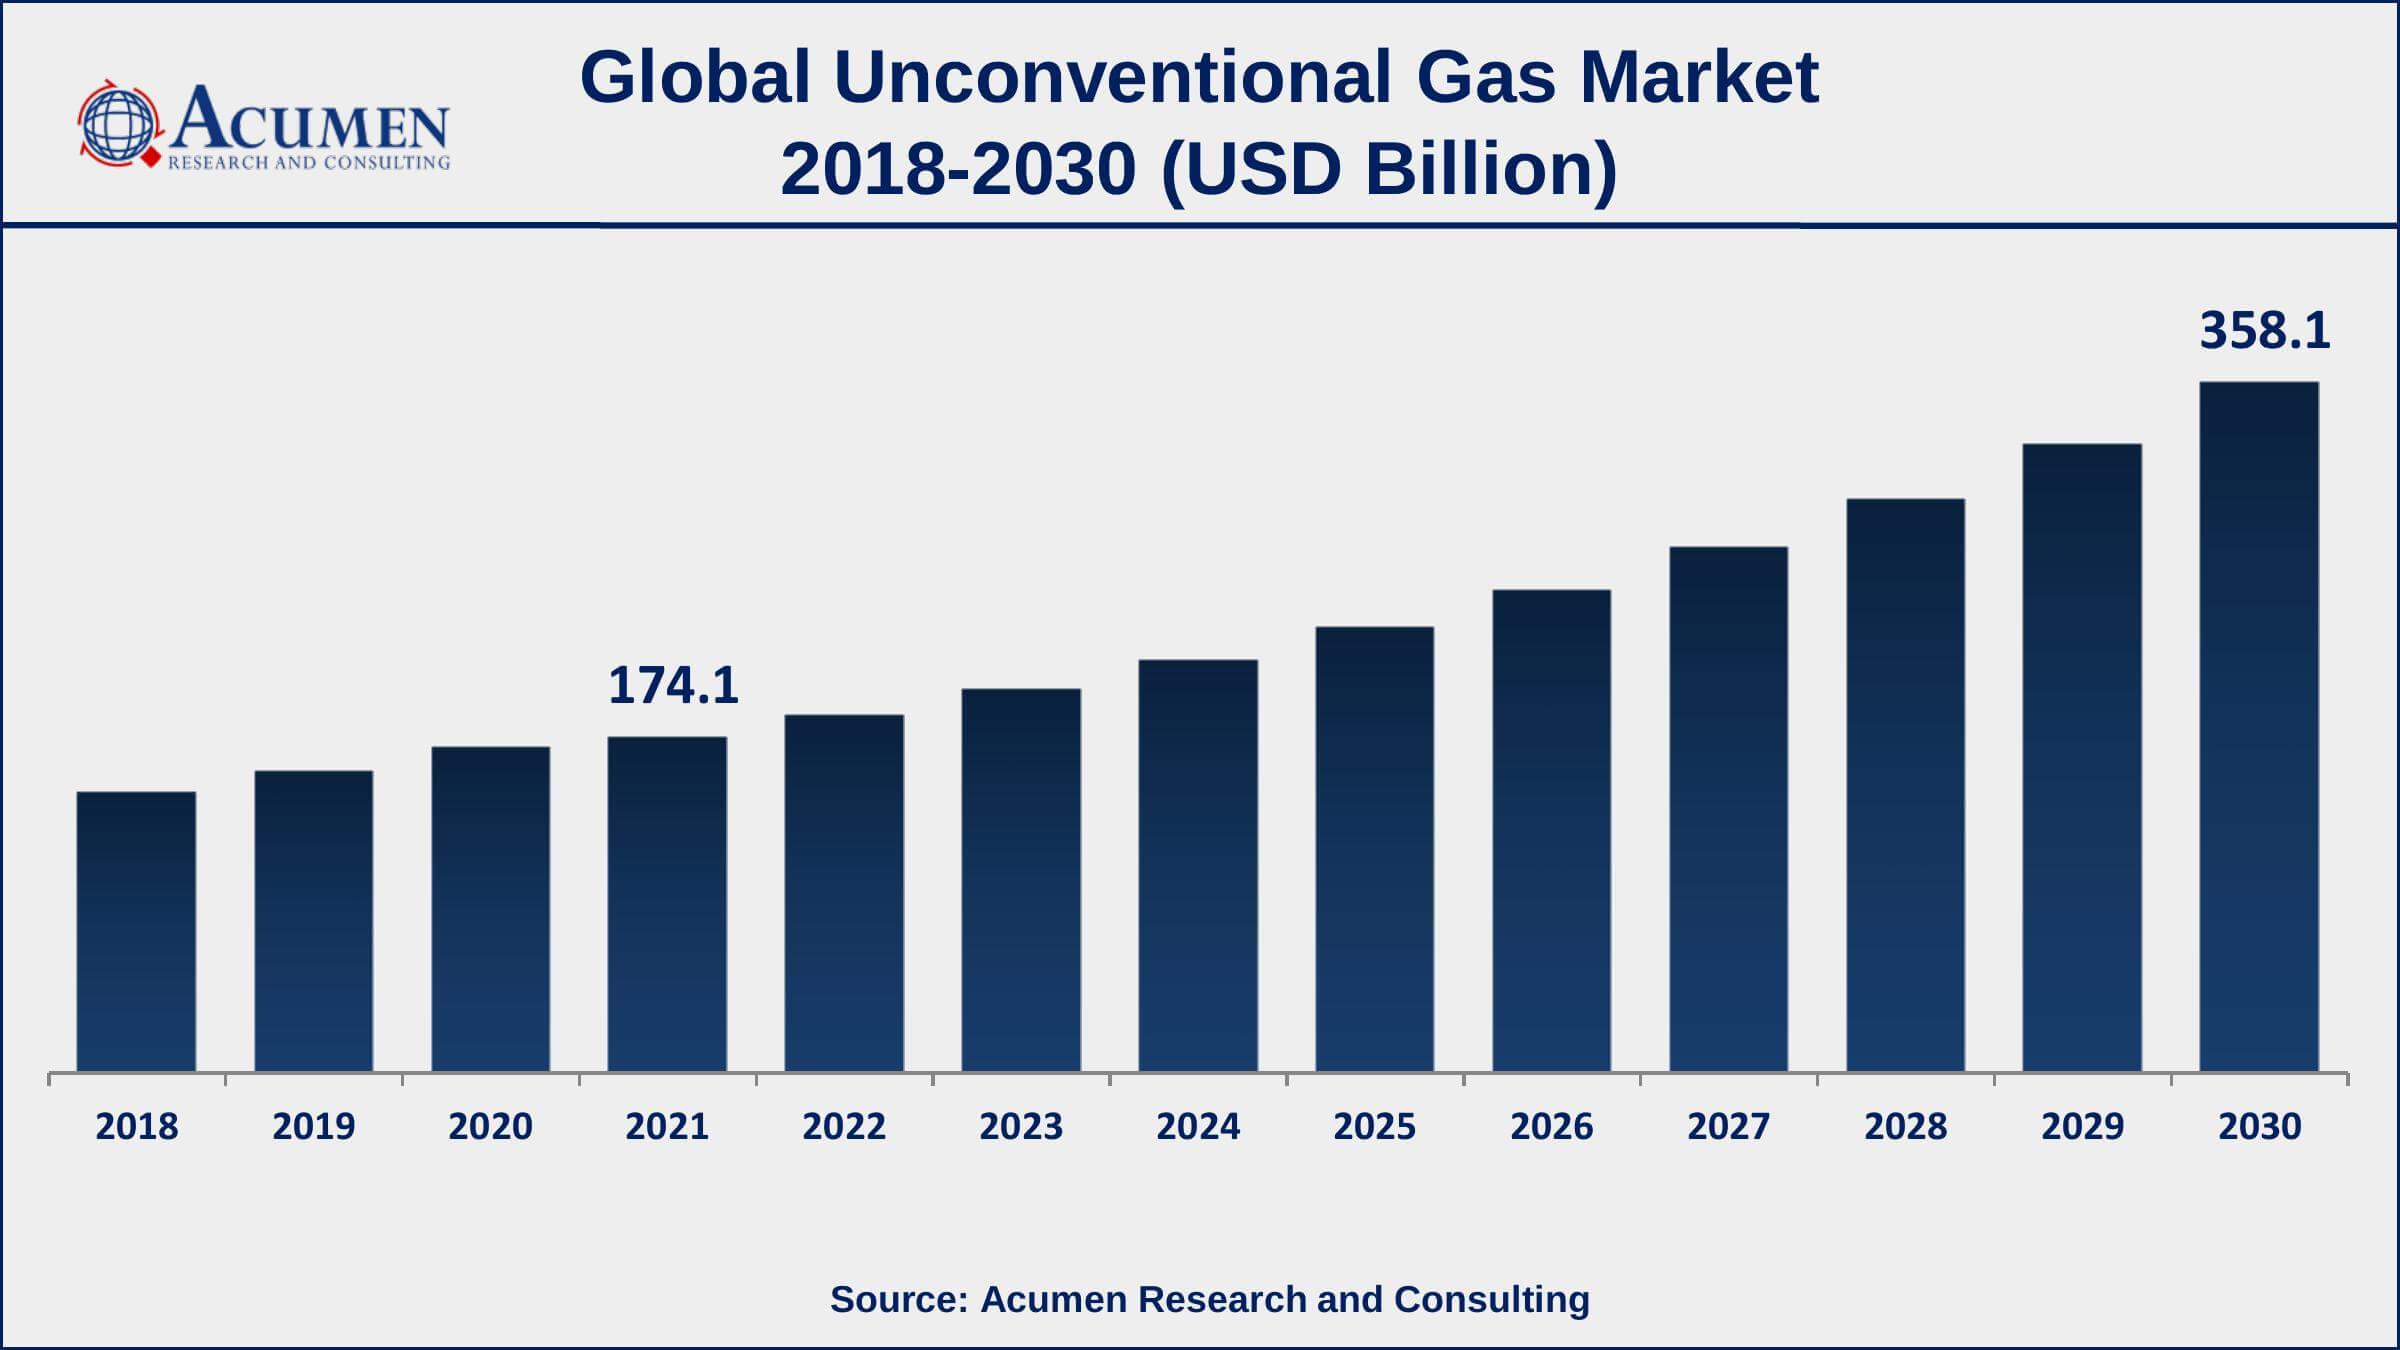
The Global Unconventional Gas Market Size accounted for USD 174.1 Billion in 2021 and is estimated to achieve a market size of USD 358.1 Billion by 2030 growing at a CAGR of 8.6% from 2022 to 2030. The growing usage of unconventional gases in the commercial, power generation, domestic, industrial, as well as transportation industries, is boosting the worldwide unconventional gas market growth. Furthermore, increased public-private collaboration in unconventional gas production is a powerful catalyst for the unconventional gas market value.
Unconventional Gas Market Report Key Highlights
- Global Unconventional Gas market revenue is estimated to expand by USD 358.1 Billion by 2030, with an 8.6% CAGR from 2022 to 2030.
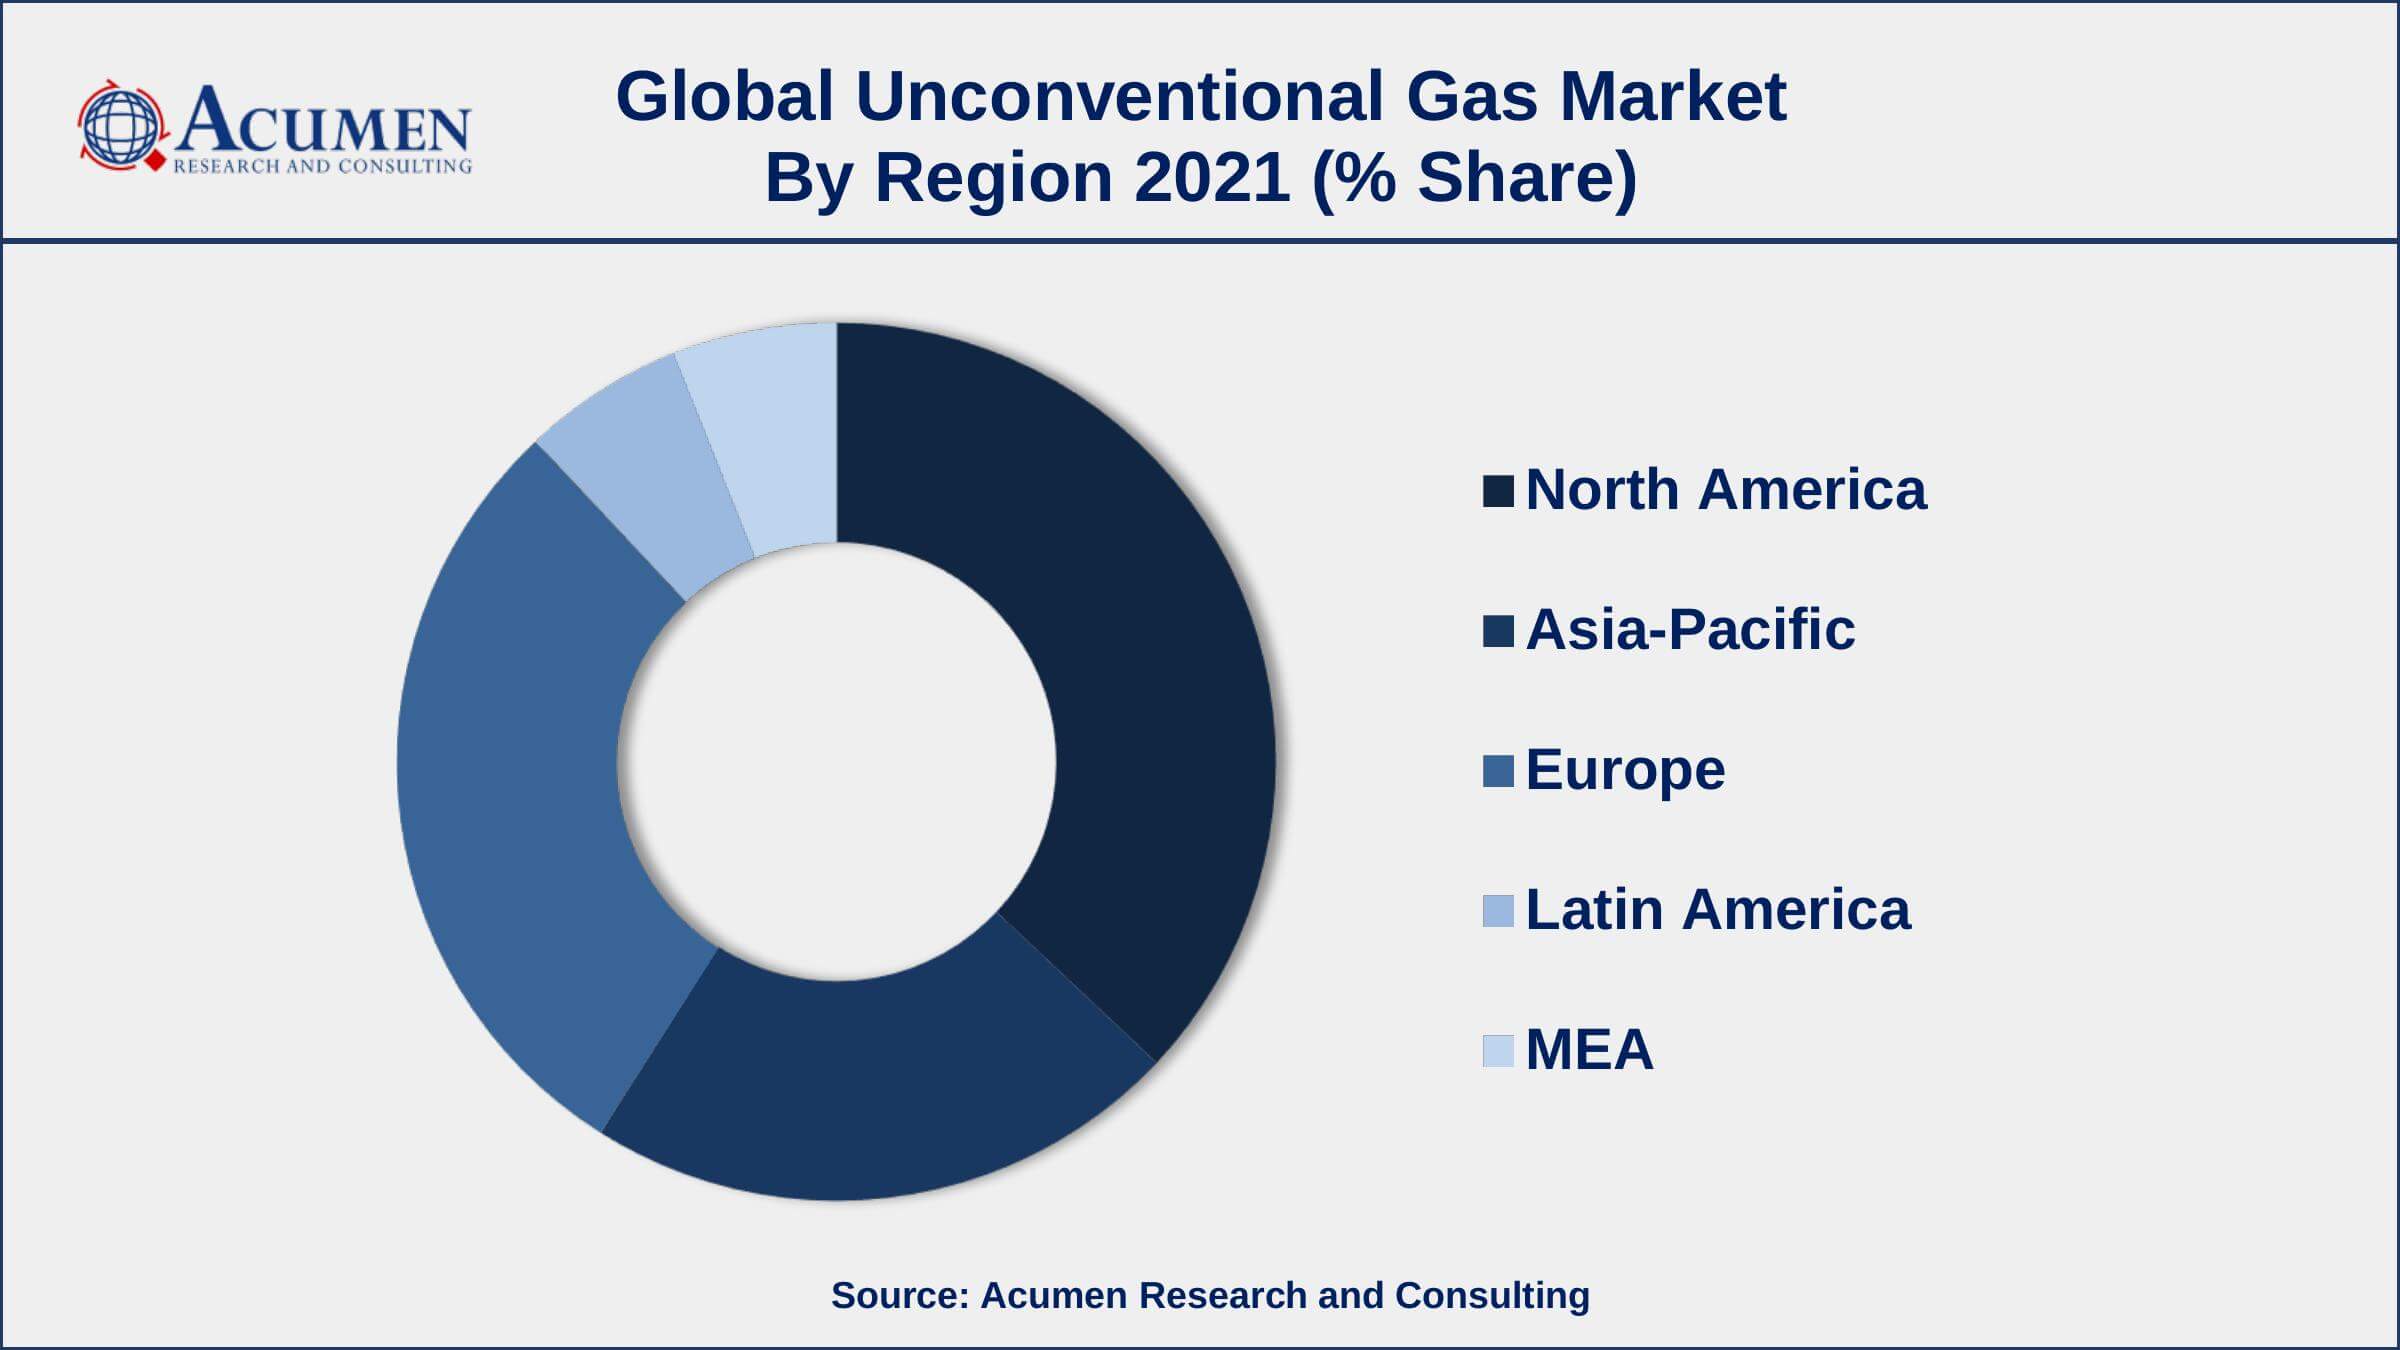
- North America unconventional gas market share accounted for over 36% of total market shares in 2021
- Asia-Pacific unconventional gas market growth will observe highest CAGR from 2022 to 2030
- Based on type, shale gas segment accounted for over 54% of the overall market share in 2021
- Among application, power generation segment is expected to grow at a CAGR of 9.5% from 2022 to 2030
- Increasing use of unconventional gases in the industrial sector, drives the unconventional gas market size
Unconventional gas is extracted from shale rocks, coal seams, & low-permeability rocks. The gas produced in such reservoirs contains the same qualities as traditional reservoir gas, namely sedimentary with significant permeability and porosity. Unconventional gas can contain a high concentration of natural gas liquids, a low or high concentration of carbon dioxide, as well as a high or low concentration of sulfur. Due to their clean-burning character, these gases are used in an electrical generation; in the home sector as an energy source, and in the commercial industry for water heating, space heating, and cooling.
Global Unconventional Gas Market Trends
Market Drivers
- Increasingly used in the power generation industry
- Rapidly increasing use of unconventional gases in the industrial sector
- Consumer trend to shifting towards natural gas
- Increasing shale gas activity
Market Restraints
- Environmental risks associated with the unconventional gas extraction process
- Increased use of renewable energy
Market Opportunities
- Increased demand for natural gas & investments in exploration and production
- Expanding public-private collaboration in unconventional gas exploration
Unconventional Gas Market Report Coverage
| Market | Unconventional Gas Market |
| Unconventional Gas Market Size 2021 | USD 174.1 Billion |
| Unconventional Gas Market Forecast 2030 | USD 358.1 Billion |
| Unconventional Gas Market CAGR During 2022 - 2030 | 8.6% |
| Unconventional Gas Market Analysis Period | 2018 - 2030 |
| Unconventional Gas Market Base Year | 2021 |
| Unconventional Gas Market Forecast Data | 2022 - 2030 |
| Segments Covered | By Type, By Application, And By Geography |
| Regional Scope | North America, Europe, Asia Pacific, Latin America, and Middle East & Africa |
| Key Companies Profiled | TechnipFMC plc., National Oilwell Varco, Emerson Automation Solutions, Baker Hughes, GE company, Royal Dutch Shell plc., BP plc., Chevron Corporation, Weatherford International Plc., Schlumberger Limited, Halliburton Inc., ExxonMobil Corporation, and Total S.A. |
| Report Coverage |
Market Trends, Drivers, Restraints, Competitive Analysis, Player Profiling, Regulation Analysis |
The government of the U.S. has been advancing demands in the investigation of capricious gas through open private organizations. The Federal Energy Regulatory Commission has endorsed a charge on interstate gas deals to finance gas innovation R&D. This has quickened demand for R&D in the unpredictable gas market. The revelation of new natural gas reserves, particularly in the U.S., China, Argentina, and Canada, offers noteworthy potential for the unconventional gas market.
Unconventional Gas Market Insights
Applications in the natural gas industry have been growing essentially. Natural gas is by and large progressively utilized as energy fuel in transportation and domestic, for example, private and business, divisions. The transportation part has helped the petroleum gas market, with ascend in the organization of CNG vehicles. In excess of 24 million flammable gas vehicles (NGVs) were operational over the globe in 2017. Gaseous petrol can be utilized in all classes of vehicles, for example, cruisers, autos, vans, light and rock-solid trucks, transports, lift trucks, and trains. This pattern is relied upon to keep amid the estimated time frame, consequently pushing the growth of the unconventional gas market.
Hydraulic fracturing technology is to a great extent utilized for the generation of unconventional gas. Hydraulic fracturing is a procedure of injecting chemicals, water, and sand at very high weights into gas wells so as to break shakes and discharge methane gas, the procedure happens more than two to five days, and requires a normal of 5.5 million gallons of liquid. It might be rehashed on various occasions on a similar well throughout the potential 25 to multiyear lifetime. A considerable lot of these synthetic substances are dangerous and are known to cause unfriendly well-being impacts. A large number of the synthetic concoctions utilized in pressure-driven breaking can cause eye, skin, and respiratory issues, and can likewise influence the brain, sensory system, and gastrointestinal framework. This is relied upon to hamper the unconventional gas market.
Unconventional Gas Market Segmentation
The worldwide unconventional gas market segmentation is based on the type, application, and geography.
Unconventional Gas Market By Type
- Shale Gas
- Tight Gas
- Coalbed Methane (CBM)
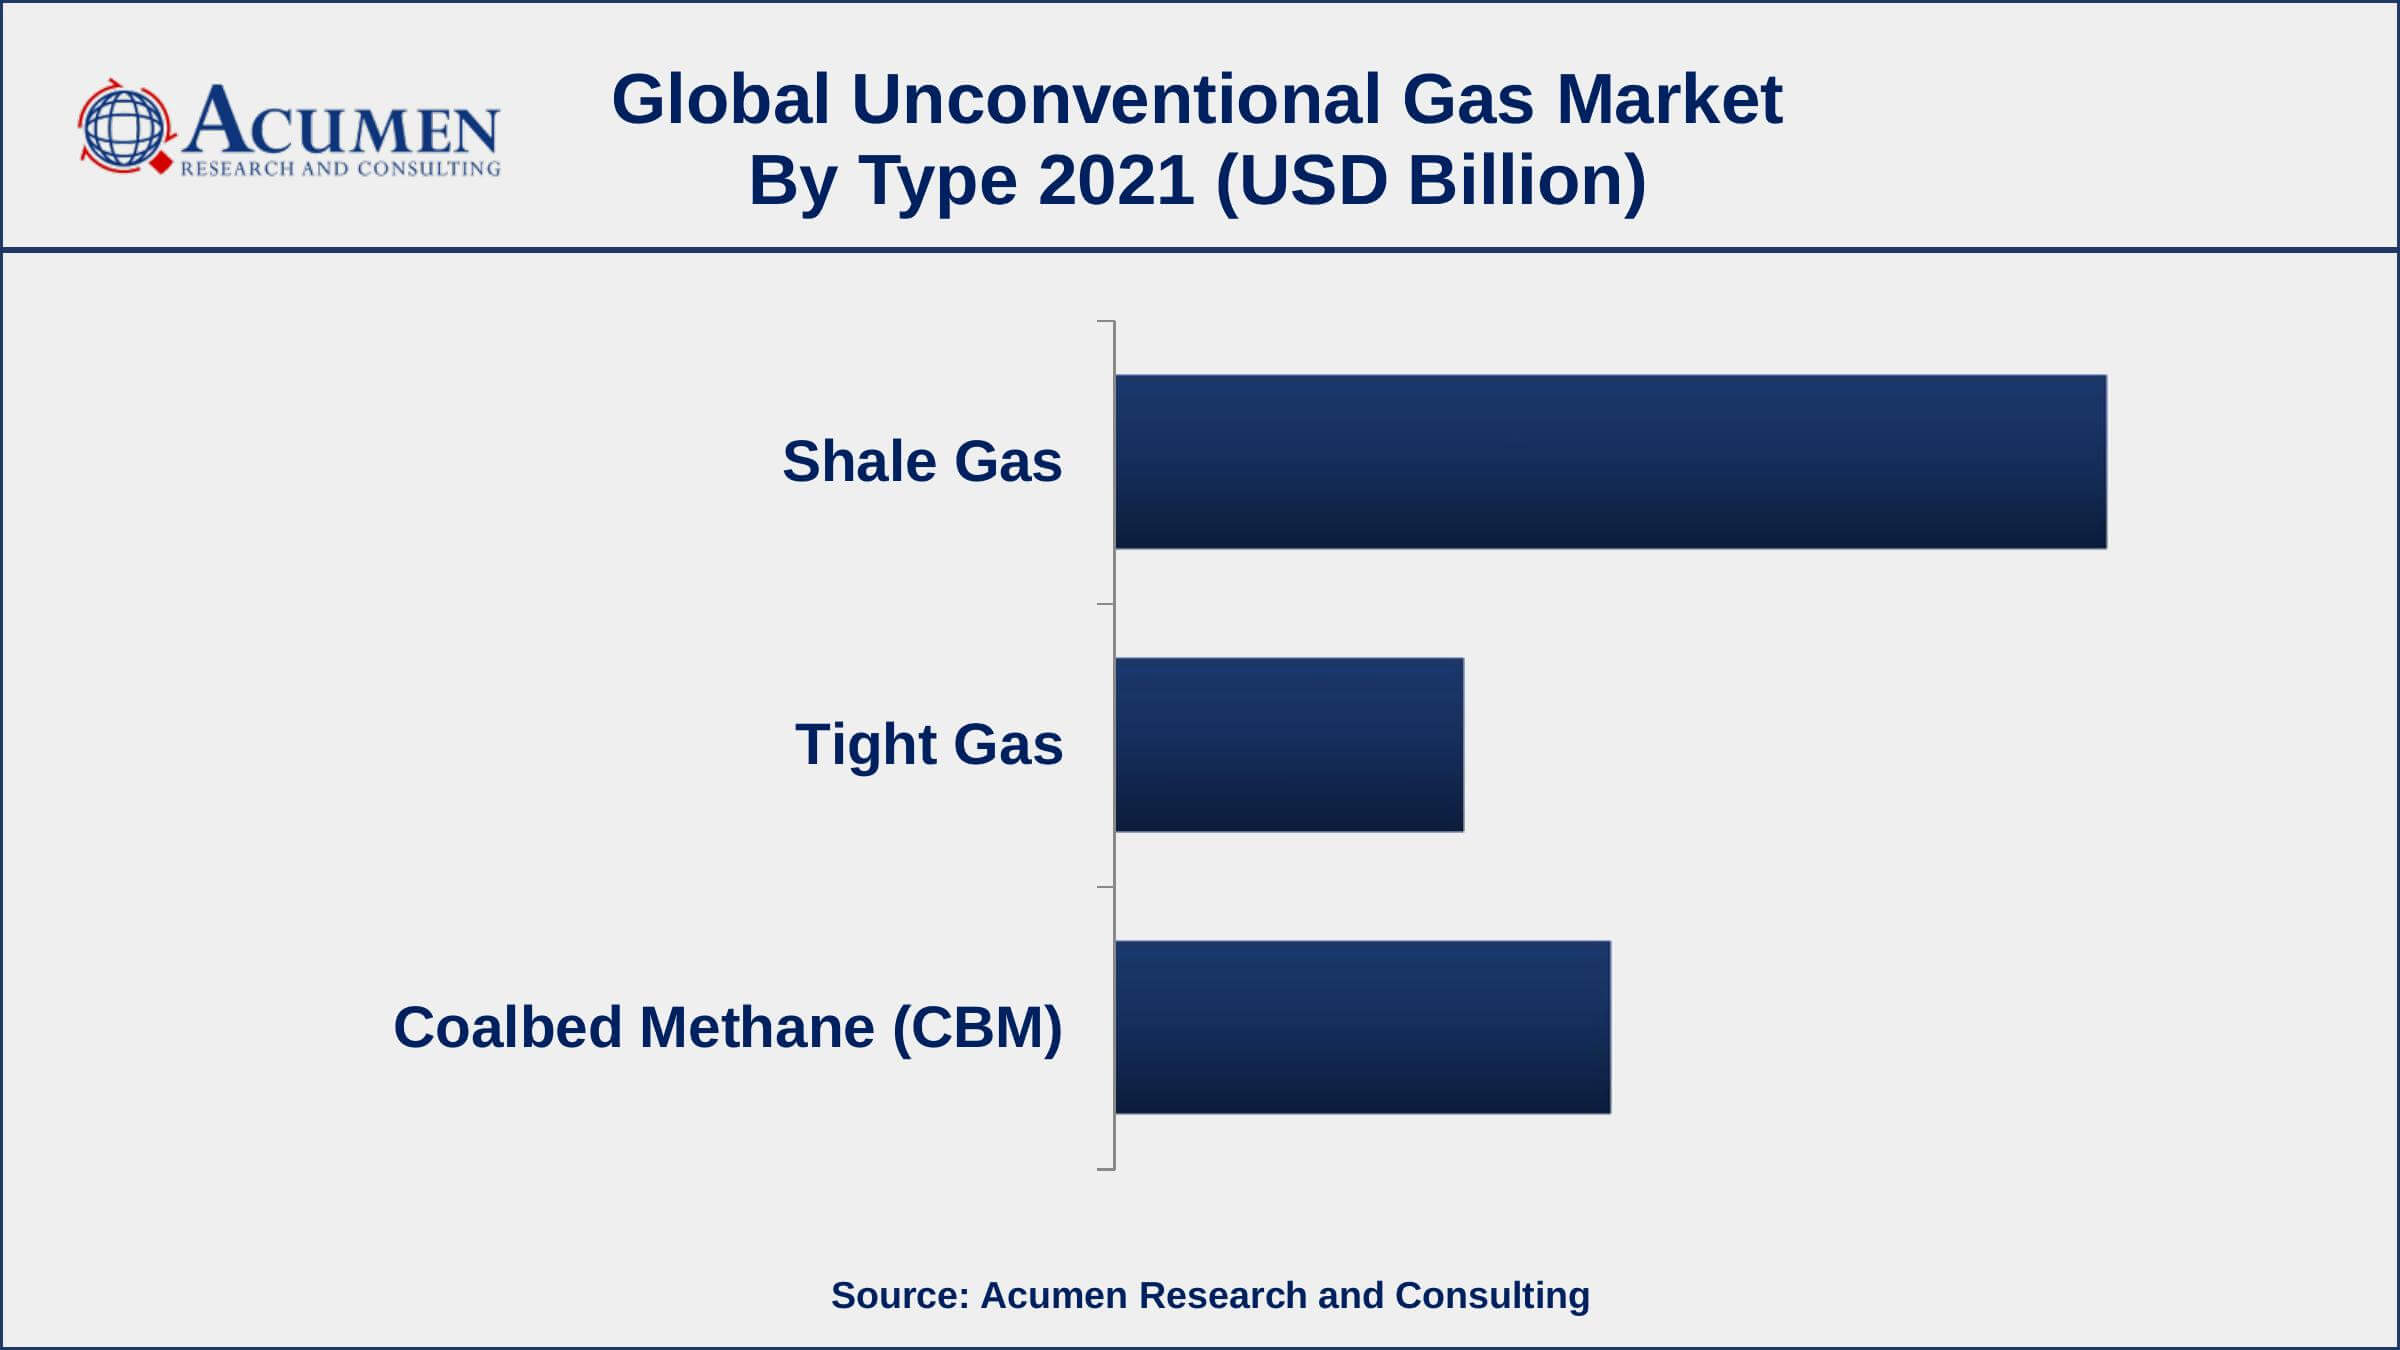
According to unconventional gas industry analysis, the shale gas segment leads the market in 2021. due to its minimal carbon emission, shale gas is mostly preferred in all industries. In the coming years, the shale gas market is likely to be driven by an increasing preference for sustainable sources of energy, as well as technology in extracting oil and gas in comparison to other types. Shale gas may be converted into a variety of products such as gasoline, diesel fuel, and liquefied petroleum gas (LPG).
Unconventional Gas Market By Application
- Industrial
- Residential
- Power Generation
- Transportation
- Commercial
According to the unconventional gas market forecast, the power generation sector is anticipated to grow significantly in the market over the next several years. The segment's market growth can be attributed to the availability and minimal carbon footprint of such gas over coal-fired power plants. Due to its low cost, shale gas is replacing traditional energy sources such as coal, nuclear, as well as hydro in a variety of industries such as chemical, fertilizer, and polymer manufacturing.
Unconventional Gas Market Regional Outlook
North America
- U.S.
- Canada
Europe
- U.K.
- Germany
- France
- Spain
- Rest of Europe
Asia-Pacific
- India
- Japan
- China
- Australia
- South Korea
- Rest of Asia-Pacific
Latin America
- Brazil
- Mexico
- Rest of Latin America
The Middle East & Africa
- South Africa
- GCC Countries
- Rest of the Middle East & Africa (ME&A)
North America Holds The Largest Share Of The Global Unconventional Gas Market
North America dominates the worldwide unconventional gas market in 2021. Asia-Pacific is a key region of this market. The discretionary income of consumers has been expanding at a fast pace in the Asia-Pacific. This is driving the GDP of the region. An increase in GDP is boosting the demand for energy in the Asia-Pacific. China, India, and Indonesia are the prime supporters of the energy demand. As far as the generation of eccentric gas, China and Australia are significant nations in the Asia-Pacific. As indicated by the U.S. Energy Information Administration (EIA), China has the biggest in fact recoverable stores of shale gas (assessed at 31.57 TCM) on the planet. This is 68% higher than the shale gas held in the U.S. India is additionally concentrating on the generation of unconventional gas. In March 2017, Reliance Industries began the business generation of coalbed methane at its Sohagpur fields in Madhya Pradesh, India.
Unconventional Gas Market Players
Some of the top unconventional gas market companies offered in the professional report include TechnipFMC plc., National Oilwell Varco, Emerson Automation Solutions, Baker Hughes, GE company, Royal Dutch Shell plc., BP plc., Chevron Corporation, Weatherford International Plc., Schlumberger Limited, Halliburton Inc., ExxonMobil Corporation, and Total S.A.
Frequently Asked Questions
What is the size of global unconventional gas market in 2021?
The estimated value of global unconventional gas market in 2021 was accounted to be USD 174.1 Billion.
What is the CAGR of global unconventional gas market during forecast period of 2022 to 2030?
The projected CAGR unconventional gas market during the analysis period of 2022 to 2030 is 8.6%.
Which are the key players operating in the market?
The prominent players of the global unconventional gas market are TechnipFMC plc., National Oilwell Varco, Emerson Automation Solutions, Baker Hughes, GE company, Royal Dutch Shell plc., BP plc., Chevron Corporation, Weatherford International Plc., Schlumberger Limited, Halliburton Inc., ExxonMobil Corporation, and Total S.A.
Which region held the dominating position in the global unconventional gas market?
North America held the dominating unconventional gas during the analysis period of 2022 to 2030.
Which region registered the fastest growing CAGR for the forecast period of 2022 to 2030?
Asia-Pacific region exhibited fastest growing CAGR for unconventional gas during the analysis period of 2022 to 2030.
What are the current trends and dynamics in the global unconventional gas market?
Increasingly used in the power generation industry, and rising consumer trend to shifting towards natural gas drives the growth of global unconventional gas market.
By type segment, which sub-segment held the maximum share?
Based on type, shale gas segment is expected to hold the maximum share of the unconventional gas market.
Select Licence Type
Connect with our sales team
Why Acumen Research And Consulting
100%
Customer Satisfaction
24x7
Availability - we are always there when you need us
200+
Fortune 50 Companies trust Acumen Research and Consulting
80%
of our reports are exclusive and first in the industry
100%
more data and analysis
1000+
reports published till date


