Third Party Logistics Market | Acumen Research and Consulting
Third Party Logistics Market Size - Global Industry, Share, Analysis, Trends and Forecast 2024 - 2032
Published :
Report ID:
Pages :
Format :
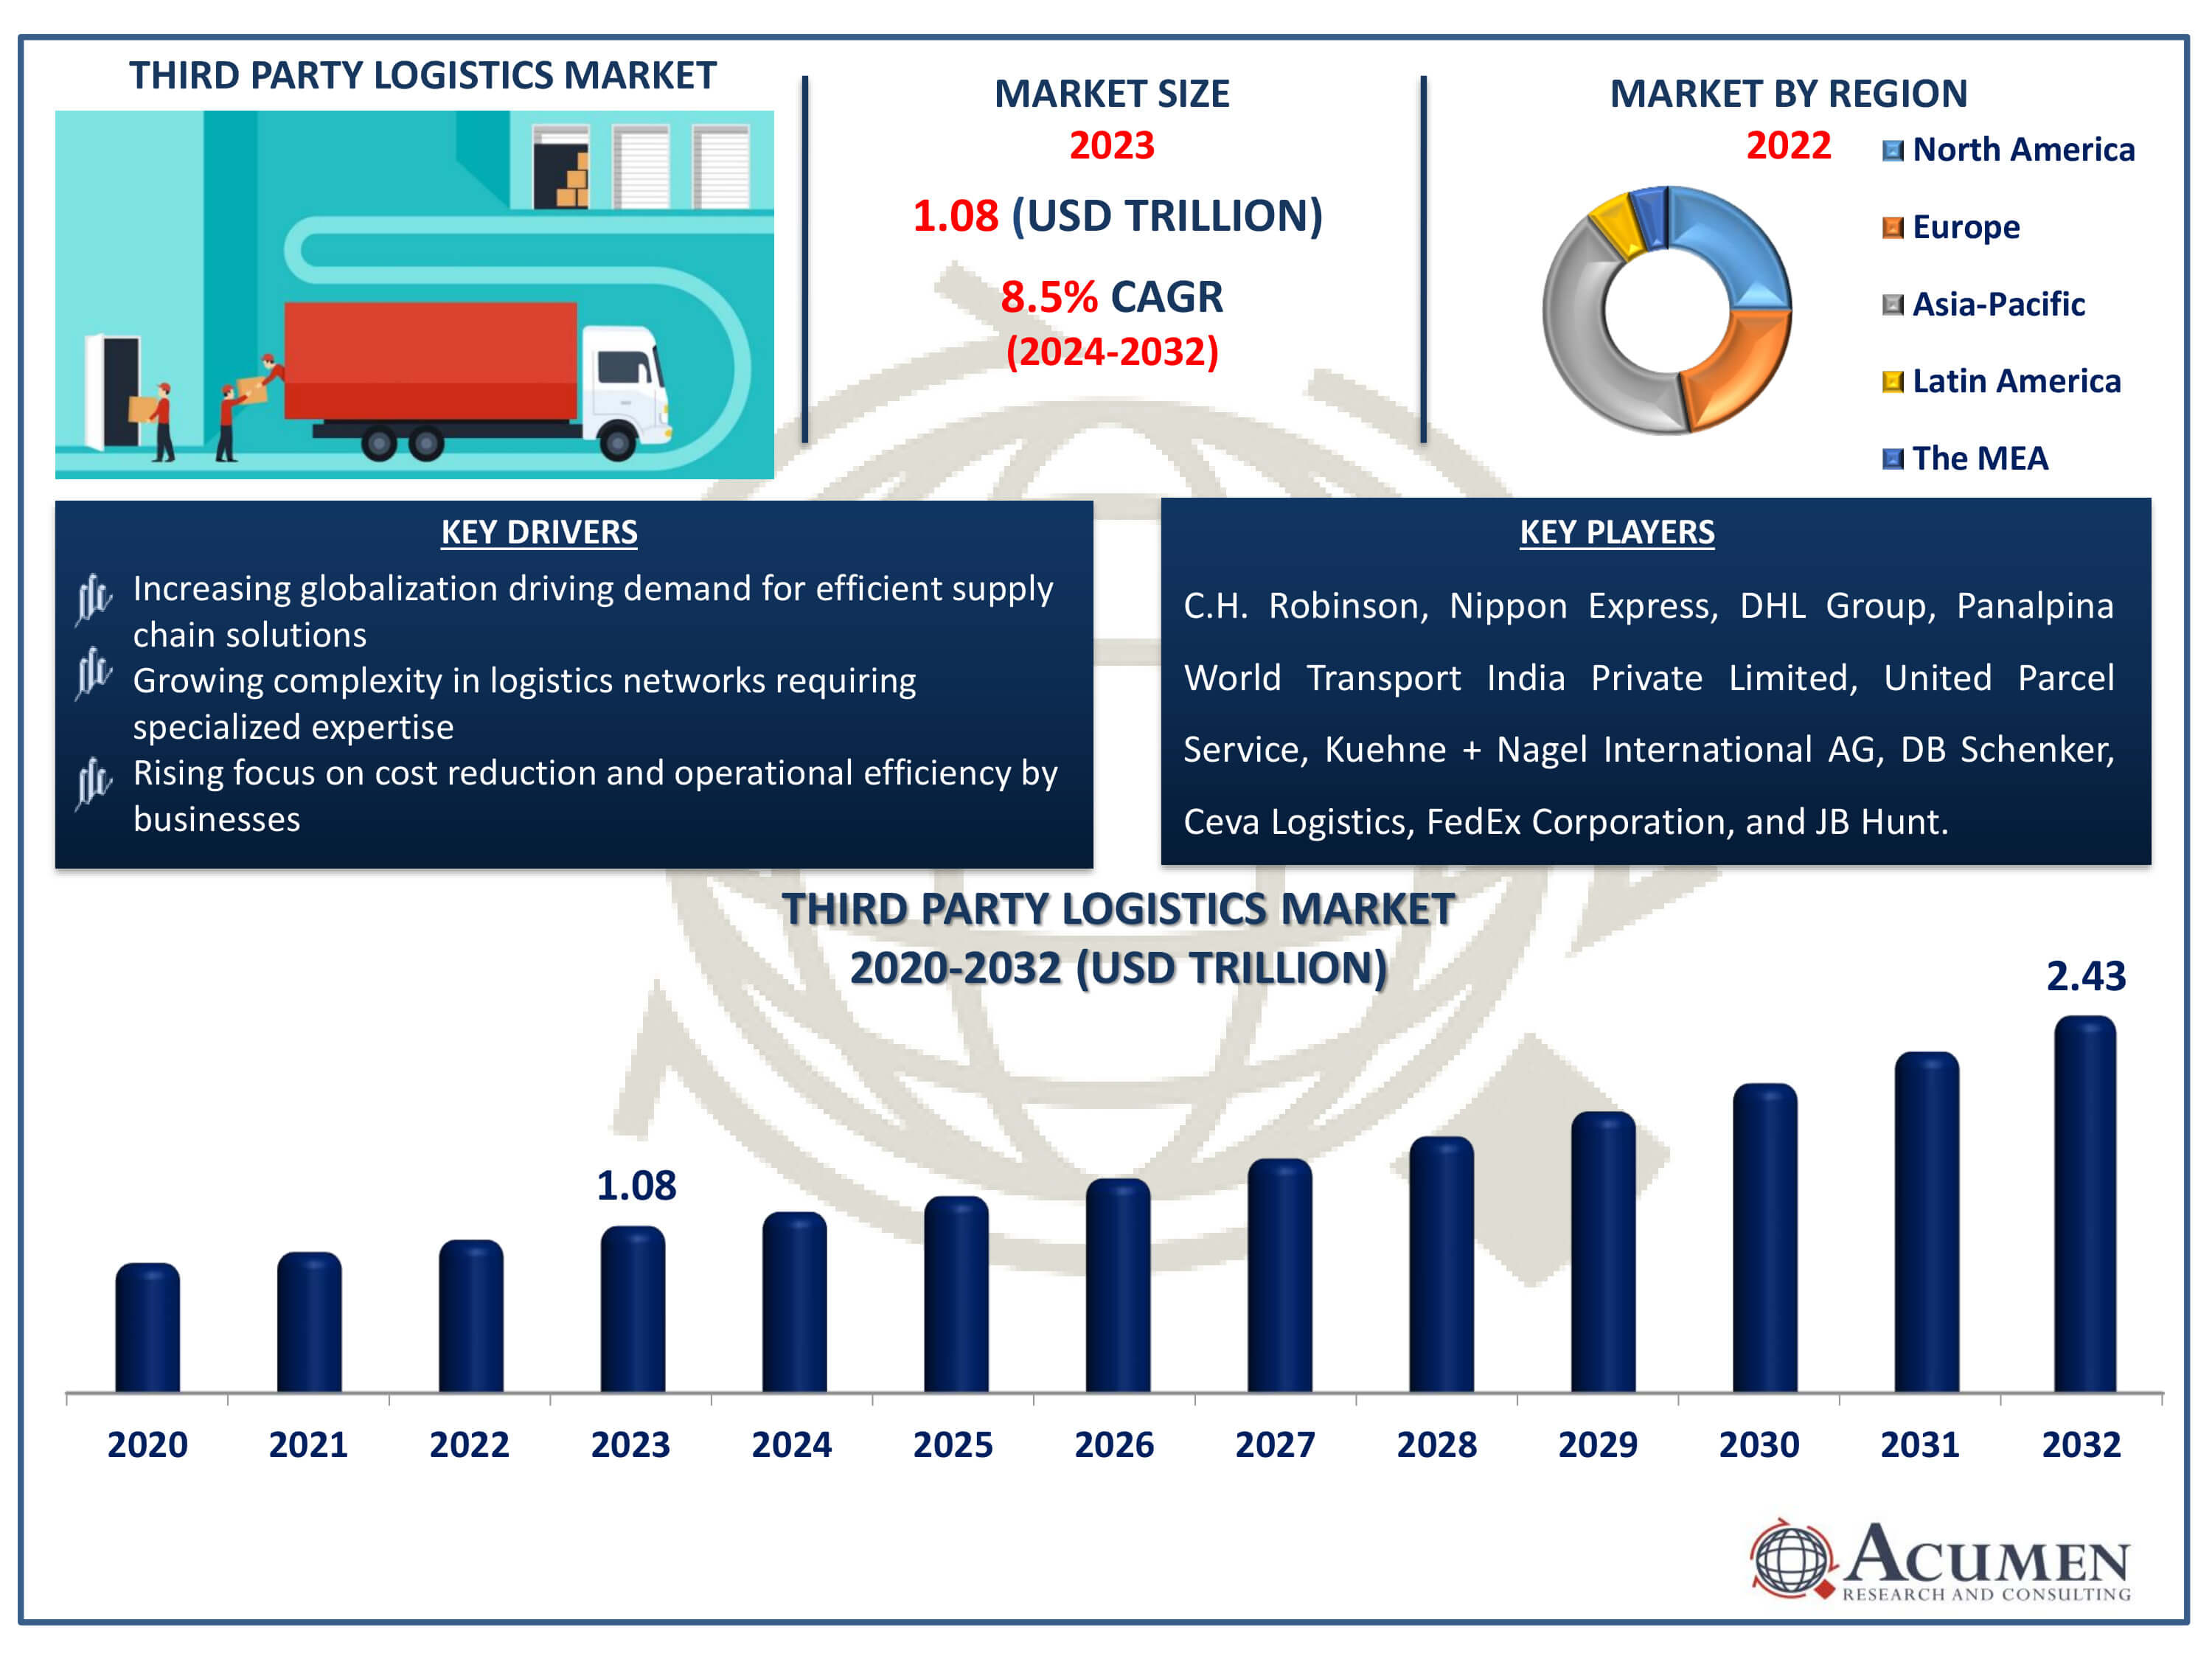
The Third Party Logistics Market Size accounted for USD 1.08 Trillion in 2023 and is estimated to achieve a market size of USD 2.43 Trillion by 2032 growing at a CAGR of 8.5% from 2024 to 2032.
Third Party Logistics Market Highlights
- Global third party logistics market revenue is poised to garner USD 2.43 trillion by 2032 with a CAGR of 8.5% from 2024 to 2032
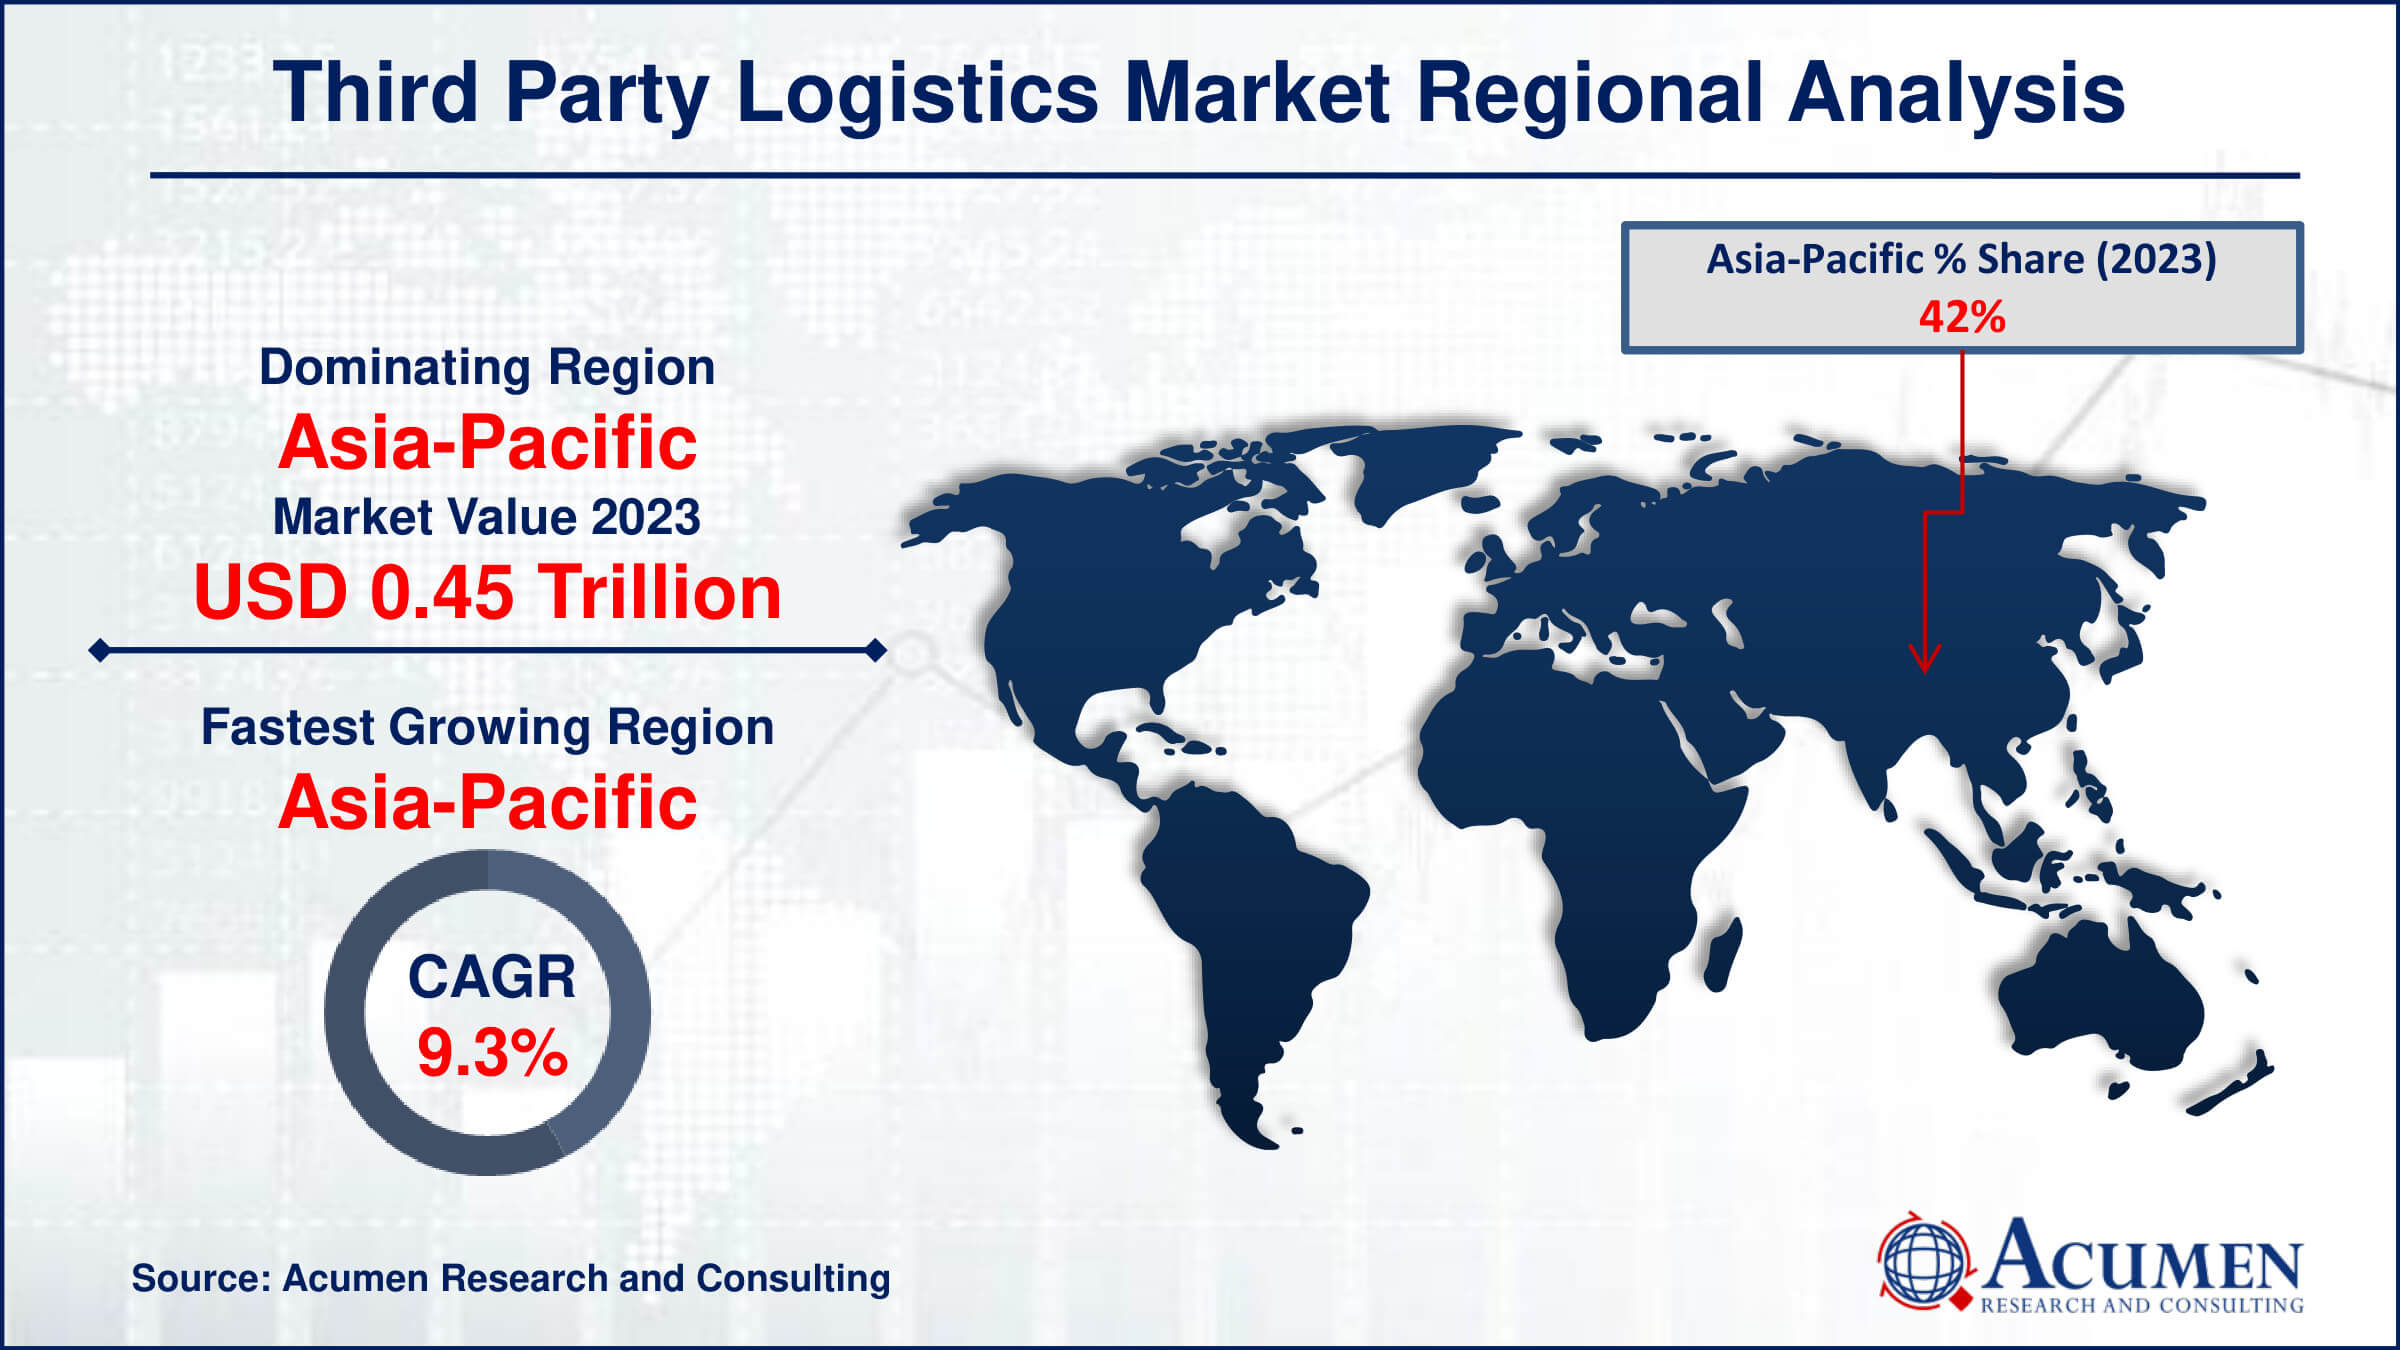
- Asia-Pacific third party logistics market value occupied around USD 0.45 trillion in 2023
- Asia Pacific third party logistics market growth will record a CAGR of more than 9.3% from 2024 to 2032
- Among service, the domestic transportation management (DTM) sub-segment generated 35% of the market share in 2023
- Based on transport, the roadways sub-segment formed 57% market share in 2023
- Based on end-use, the manufacturing, sub-segment produced 26% market share in 2023
- The surge in e-commerce is driving the demand for third-party logistics services to handle increased order volumes and faster delivery expectations is the third party logistics market trend that fuels the industry demand

Third party logistics (3PL) refers to the outsourcing of e-commerce logistics processes to a third-party business, including inventory management, warehousing, and fulfillment. By leveraging 3PL services, companies can focus on their core competencies while entrusting logistics to experts. Applications of 3PL are vast, spanning from managing supply chains for retail businesses to handling the transportation and distribution needs of large manufacturers. These services often include order processing, packing, shipping, and returns management. With the rise of e-commerce, 3PL has become critical for ensuring efficient and scalable operations. Additionally, 3PL providers offer value-added services such as kitting, custom labeling, and real-time inventory tracking. By utilizing advanced technologies, 3PLs enhance supply chain visibility and optimize logistics networks, leading to cost savings and improved customer satisfaction.
Global Third Party Logistics Market Dynamics
Market Drivers
- Increasing globalization driving demand for efficient supply chain solutions
- Growing complexity in logistics networks requiring specialized expertise
- Rising focus on cost reduction and operational efficiency by businesses
Market Restraints
- High initial investment costs for technology and infrastructure
- Regulatory complexities and compliance challenges across different regions
- Potential risks associated with outsourcing critical logistics function
Market Opportunities
- Technological advancements such as AI and IoT transforming logistics operations
- Expansion of e-commerce driving demand for integrated logistics solutions
- Emerging markets presenting untapped potential for third-party logistics providers
Third Party Logistics Market Report Coverage
| Market | Third Party Logistics Market |
| Third Party Logistics Market Size 2022 | USD 1.08 Trillion |
| Third Party Logistics Market Forecast 2032 | USD 2.43 Trillion |
| Third Party Logistics Market CAGR During 2023 - 2032 | 8.5% |
| Third Party Logistics Market Analysis Period | 2020 - 2032 |
| Third Party Logistics Market Base Year |
2022 |
| Third Party Logistics Market Forecast Data | 2023 - 2032 |
| Segments Covered | By Service, By Transport, By End Use, And By Geography |
| Regional Scope | North America, Europe, Asia Pacific, Latin America, and Middle East & Africa |
| Key Companies Profiled | C.H. Robinson, Nippon Express, DHL Group, Panalpina World Transport India Private Limited, United Parcel Service, Kuehne + Nagel International AG, DB Schenker, Ceva Logistics, FedEx Corporation, and JB Hunt. |
| Report Coverage |
Market Trends, Drivers, Restraints, Competitive Analysis, Player Profiling, Covid-19 Analysis, Regulation Analysis |
Third Party Logistics Market Insights
Increasing globalization is significantly enhancing the demand for efficient supply chain solutions, thereby propelling growth in the 3PL market. For instance, according to World Trade Organization, the flagship publication, unveiled on September 12th 2023, explores how re-globalization characterized by enhanced international cooperation and broader integration can foster security, inclusivity, and environmental sustainability. Companies are increasingly relying on 3PL providers to streamline their operations, reduce costs, and improve delivery times across international borders. The complexity of global supply chains necessitates specialized expertise and resources, which 3PLs offer through their network and experience. This trend is driven by the need for quick and scalable logistics solutions that can adapt to varying market conditions and consumer demands worldwide. As businesses expand into new markets, the role of 3PLs becomes crucial in managing the supply chain logistics efficiently.
Outsourcing critical logistics functions can introduce several risks that may constrain the 3PL market. These risks include loss of control over operations, leading to potential disruptions in supply chains. Confidentiality and security concerns arise when sensitive data and information are shared with external parties. Quality assurance and compliance issues may also arise, impacting service reliability and customer satisfaction. Furthermore, over-reliance on third parties can pose financial risks due to fluctuating costs and contractual obligations. Effective risk management strategies are crucial to mitigate these potential drawbacks and sustain the feasibility of outsourcing in the 3PL sector.
The rapid expansion of e-commerce has significantly increased the demand for efficient logistics solutions worldwide. For instance, according to India Brand Equity Foundation, as of May 2023, the Indian government's open e-commerce network ONDC had expanded its operations to 236 cities across the country, adding over 36,000 businesses. This growth presents a notable opportunity for the third-party logistics (3PL) market, as businesses seek reliable partners to manage and optimize their supply chains. Integrated logistics solutions offered by 3PL providers cater to the complex needs of e-commerce, including warehousing, inventory management, order fulfillment, and last-mile delivery. This trend is fueled by consumer’s expectations for faster delivery times and seamless shopping experiences, prompting businesses to outsource logistics to specialists capable of meeting these demands. As e-commerce continues to evolve, the 3PL industry is poised for further expansion and innovation.
Third Party Logistics Market Segmentation
The worldwide market for third party logistics is split based on service, transport, end use, and geography.
Third Party Logistics 3PL Market By Service
- Dedicated Contract Carriage (DCC)/Freight Forwarding
- Domestic Transportation Management (DTM)
- International Transportation Management (ITM)
- Warehousing & Distribution (W&D)
- Value-Added Logistics Services (VALs)
According to the third party logistics industry analysis, domestic transportation management (DTM) plays a crucial role in the 3PL industry by control the movement of goods within a single country. It involves optimizing routes, selecting carriers, and ensuring timely deliveries, which are essential for supply chain efficiency. DTM providers leverage technology and expertise to streamline operations, reduce costs, and enhance service levels for their clients. As businesses focus on scalability and agility, DTM's role in managing transportation details becomes increasingly pivotal in meeting customer demands.
Third Party Logistics 3PL Market By Transport
- Roadways
- Railways
- Waterways
- Airways
Roadways are the largest transport category in the third party logistics market due to their extensive network and flexibility. They offer door-to-door delivery, making them convenient for various industries including retail, manufacturing, and e-commerce. Road transport is adaptable to varying shipment sizes and types, from small parcels to oversized cargo, enhancing its appeal in the logistics chain. Additionally, advancements in technology have improved efficiency and tracking capabilities, further solidifying roadways as a preferred choice in the 3PL sector. Overall, their widespread coverage and versatility contribute significantly to largest transport category in the industry.
Third Party Logistics 3PL Market By End-Use
- Manufacturing
- Retail
- Healthcare
- Automotive
According to the third party logistics industry forecast, manufacturing sector is expected to dominates third party logistics market due to its complex supply chain needs. Manufacturers rely heavily on 3PL providers to streamline operations, reduce costs, and improve efficiency in warehousing, transportation, and distribution. This sector's demand for specialized services like inventory management, packaging, and reverse logistics further maintain its pivotal role in driving growth and innovation within the 3PL industry. As manufacturing expands globally, so does the opportunity for 3PLs to offer modified solutions and expand their market presence.
Third Party Logistics Market Regional Outlook
North America
- U.S.
- Canada
Europe
- U.K.
- Germany
- France
- Spain
- Rest of Europe
Asia-Pacific
- India
- Japan
- China
- Australia
- South Korea
- Rest of Asia-Pacific
Latin America
- Brazil
- Mexico
- Rest of Latin America
The Middle East & Africa
- South Africa
- GCC Countries
- Rest of the Middle East & Africa (ME&A)

Third Party Logistics Market Regional Analysis
For several reasons, Asia-Pacific dominates 3PL industry and also fastest-growing region in forecast year. India has been recognized with infrastructure status within the Asia Pacific region. Significant government investments have been directed towards the enhancement of national highways to bolster logistics infrastructure. Additionally, presence of robust key players contributes to its growth in market. For instance, in July 2023, A.P. Moller-Maersk launched its third Warehousing & Distribution (W&D) facility and first Cold Store in Dubai, UAE. The facility spans 13,000 sq. m and is located at Dubai Industrial City. It is conveniently placed for easy access to Jebel Ali Port, Al Maktoum International Airport, direct road connections throughout the UAE, and an Etihad Rail freight station. Overall, the region’s growth is largely attributed to increasing Internet and smartphone penetration, which positively impacts regional market expansion.
In North America, the third-party logistics market holds a substantial market share. The United States, with an impressive score maintained its position as the leading innovator in third-party logistics in the region. For instance, in January 2024, C.H. Robinson was the first third-party logistics provider to adopt an electronic version of an essential shipping document. The company has already implemented an eBOL with 10 top LTL carriers and is currently working with four more. The NMFTA's Digital LTL Council created eBOL standards to improve efficiency and real-time visibility for LTL shippers. As a result, due to presence of leading manufacturers region further maintain its position in 3PL industry.This factor significantly influences the growth trajectory of the North American third-party logistics market.
Third Party Logistics Market Players
Some of the top third party logistics companies offered in our report include C.H. Robinson, Nippon Express, DHL Group, Panalpina World Transport India Private Limited, United Parcel Service, Kuehne + Nagel International AG, DB Schenker, Ceva Logistics, FedEx Corporation, and JB Hunt.
Frequently Asked Questions
How big is the third party logistics market?
The third party logistics market size was valued at USD 1.08 trillion in 2023.
What is the CAGR of the global third party logistics market from 2024 to 2032?
The CAGR of third party logistics is 8.5% during the analysis period of 2024 to 2032.
Which are the key players in the third party logistics market?
The key players operating in the global market are including C.H. Robinson, Nippon Express, DHL Group, Panalpina World Transport India Private Limited, United Parcel Service, Kuehne + Nagel International AG, DB Schenker, Ceva Logistics, FedEx Corporation, and JB Hunt.
Which region dominated the global third party logistics market share?
Asia-Pacific held the dominating position in third party logistics industry during the analysis period of 2024 to 2032.
Which region registered fastest CAGR from 2024 to 2032?
Asia-Pacific region exhibited fastest growing CAGR for market of third party logistics during the analysis period of 2024 to 2032.
What are the current trends and dynamics in the global third party logistics industry?
The current trends and dynamics in the third party logistics industry include increasing globalization driving demand for efficient supply chain solutions, growing complexity in logistics networks requiring specialized expertise, and rising focus on cost reduction and operational efficiency by businesses.
Which Service held the maximum share in 2023?
The domestic transportation management (DTM) held the maximum share of the third party logistics industry.


