Thermal Ceramic Market Size - Global Industry, Share, Analysis, Trends and Forecast 2023 - 2032
Published :
Report ID:
Pages :
Format :
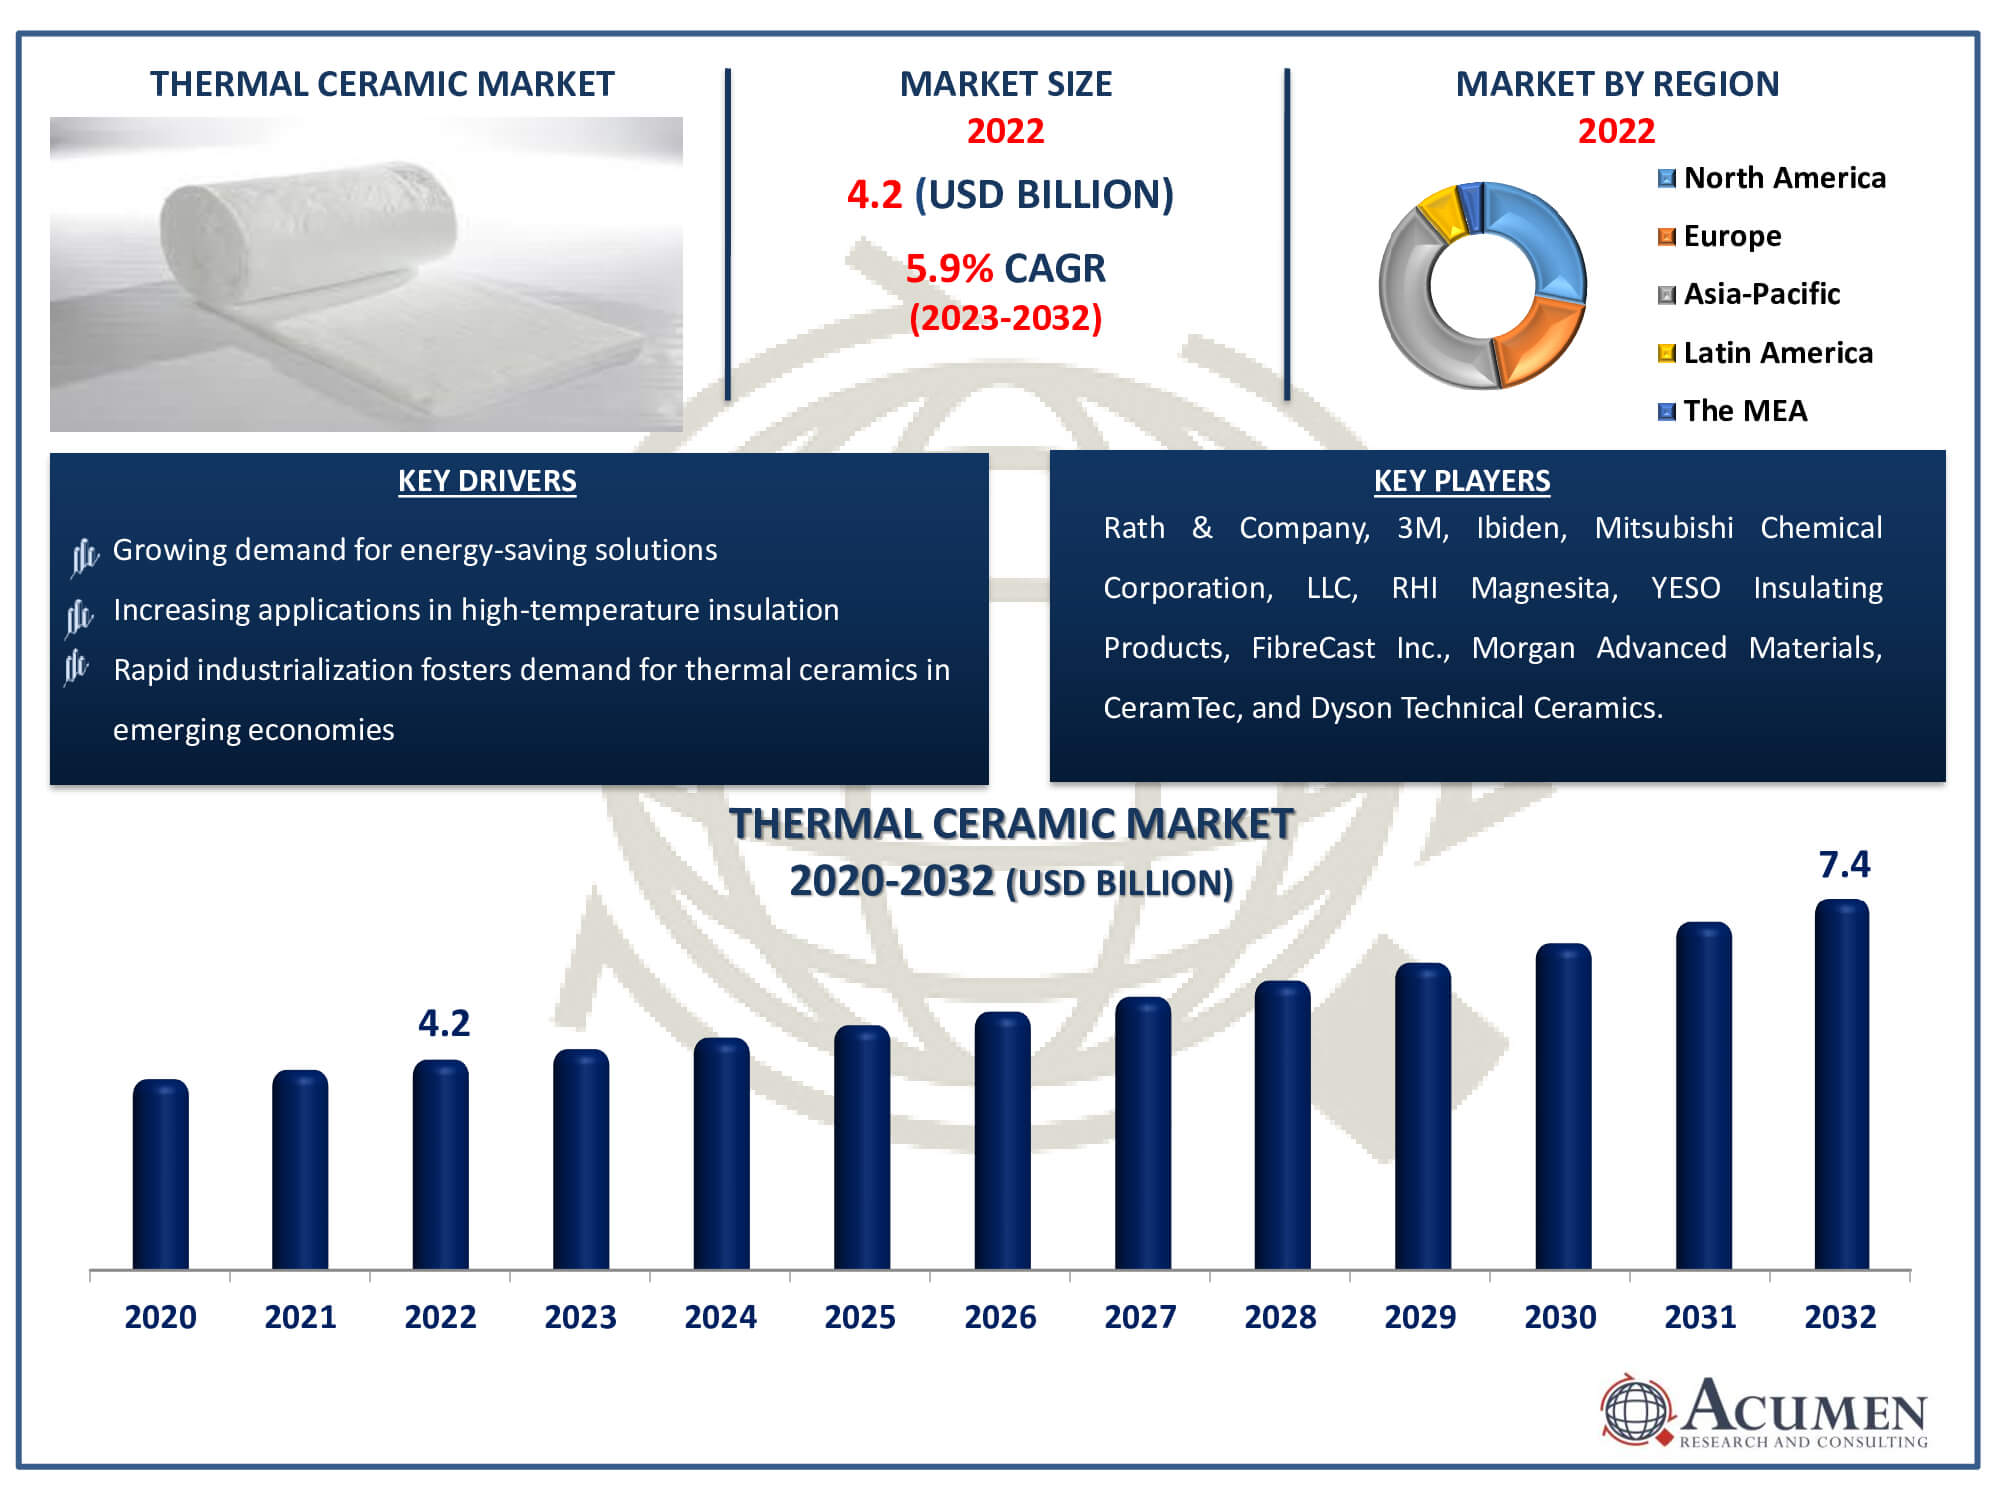
The Thermal Ceramic Market Size accounted for USD 4.2 Billion in 2022 and is estimated to achieve a market size of USD 7.4 Billion by 2032 growing at a CAGR of 5.9% from 2023 to 2032.
Thermal Ceramic Market Highlights
- Global thermal ceramic market revenue is poised to garner USD 7.4 billion by 2032 with a CAGR of 5.9% from 2023 to 2032
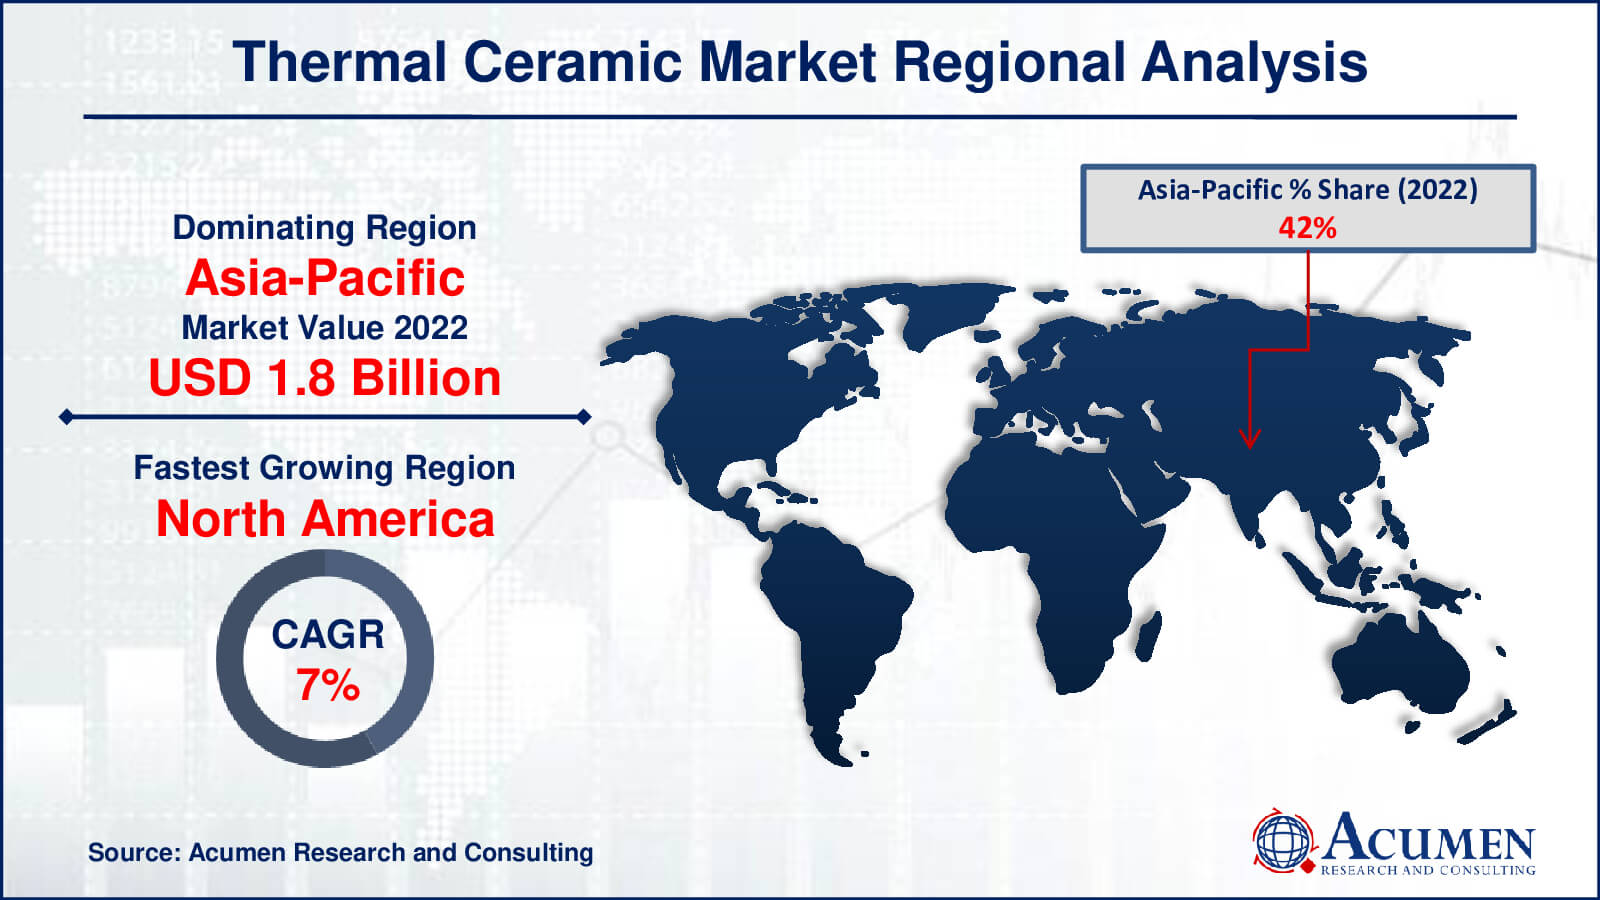
- Asia-Pacific thermal ceramic market value occupied around USD 1.8 billion in 2022
- North America thermal ceramic market growth will record a CAGR of more than 7% from 2023 to 2032
- Among type, the ceramic fibers sub-segment generated more that USD 2.3 billion revenue in 2022
- Based on end-use, the mining & metal processing sub-segment generated around 51% share in 2022
- Technological advancements in thermal ceramics is a popular thermal ceramic market trend that fuels the industry demand

In industries which produce or use high-temperature insulation, the temperature control is an essential parameter. Thermal ceramics not only allow temperature control and avoid heat losses and thus are in great demand for these products. The increasing demand for energy-saving and rapid industrialization is driving the growth of the thermal ceramics market in emerging economies. Ceramic fiber products are commonly utilized by different methods and operations due to their useful characteristics including low thermal conductivity, low temperature transport, high tensile strength, thermal shock resistance, and sound absorption.
Global Thermal Ceramic Market Dynamics
Market Drivers
- Growing demand for energy-saving solutions
- Increasing applications in high-temperature insulation
- Rapid industrialization fosters demand for thermal ceramics in emerging economies
- Rising emphasis on temperature control in various industries
Market Restraints
- High production costs pose a challenge to the thermal ceramic market
- Environmental concerns related to ceramic manufacturing
- Fluctuating raw material prices impact the profitability of thermal ceramics
Market Opportunities
- Innovations in ceramic manufacturing techniques
- Expanding applications in automotive and construction sectors offer market prospects
- Growing awareness of sustainable and eco-friendly insulation materials drives market potential
Thermal Ceramic Market Report Coverage
| Market | Thermal Ceramic Market |
| Thermal Ceramic Market Size 2022 | USD 4.2 Billion |
| Thermal Ceramic Market Forecast 2032 | USD 7.4 Billion |
| Thermal Ceramic Market CAGR During 2023 - 2032 | 5.9% |
| Thermal Ceramic Market Analysis Period | 2020 - 2032 |
| Thermal Ceramic Market Base Year |
2022 |
| Thermal Ceramic Market Forecast Data | 2023 - 2032 |
| Segments Covered | By Type, By Temperature Range, By End-Use, And By Geography |
| Regional Scope | North America, Europe, Asia Pacific, Latin America, and Middle East & Africa |
| Key Companies Profiled | Rath & Company, Mitsubishi Chemical Corporation, LLC, 3M, RHI Magnesita, YESO Insulating Products, Morgan Advanced Materials, CeramTec, Ibiden, FibreCast Inc., and Dyson Technical Ceramics. |
| Report Coverage |
Market Trends, Drivers, Restraints, Competitive Analysis, Player Profiling, Covid-19 Analysis, Regulation Analysis |
Thermal Ceramic Market Insights
Growing infrastructural development in developing countries is a major factor driving the growth of the global thermal ceramic market. The increased demand for the product has been met by expanded thermal ceramic applications, such as process heaters, high-temperature filtration, and ceramic furnaces. Ceramic fibers are the most common thermal ceramics due to their favorable features, including a wide range of temperatures, lightweight, and low thermal conductivity, which drive the market's growth, among other factors. Another feature of ceramic fibers is their improved flexibility, allowing them to transform into any shape, making them widely utilized in end-user industries such as glass, ceramics, petrochemicals, and aluminum. Environmental issues and the carcinogenic nature of ceramic fibers are factors that can hinder market development.
The carcinogenic nature of ceramic fibres and environmental concerns are obstacles facing the heated ceramic sector. The expansion of the market is impacted by these factors, which cause concerns among consumers and regulatory organizations. Further impediments to the industry are strict laws pertaining to worker safety and emissions. Sustainable market development requires addressing these health and environmental issues as well as adhering to regulations.
The growing global infrastructural development is driving huge prospects in the thermal ceramic industry. The need for high-temperature insulation is growing as businesses develop, and thermal ceramics can meet this demand. Thermal ceramics have a wide range of uses in the automotive, construction, and electronics industries. Innovations in ceramic fibre materials and continuous technological improvements further benefit the market. With their quick industrialization, emerging economies present a significant possibility for expansion. Manufacturers can concentrate on creating environmentally friendly substitutes, taking care of environmental issues. Strategic alliances and cooperation with research centres for cutting-edge materials and applications can improve a company's market visibility. Furthermore, a greater understanding of energy saving and the necessity of sustainable solutions sets the stage for the adoption and expansion of thermal ceramics.
Thermal Ceramic Market Segmentation
The worldwide market for thermal ceramic is split based on type, temperature range, end-use, and geography.
Thermal Ceramic Types
- Ceramic Fibers
- Insulation Bricks
Accordning to the thermal ceramic industry analysis, ceramic fibres have the largest market share in the thermal market due to their advantageous properties and adaptability. Because of their low thermal conductivity, lightweight design, and broad temperature range, these fibres are perfect for a variety of uses. They are widely sought after in industries like glass, ceramics, petrochemicals, and aluminium because of their flexibility, which makes it easier to adapt to varied shapes. To add to their substantial market share and steady expansion in the thermal ceramic industry, ceramic fibres are essential in high-temperature applications such as process heaters and ceramic furnaces.
Thermal Ceramic Temperature Ranges
- 650 to 1,000 ºC
- 1,000 to 1,400 ºC
- 1,400 to 1,600 ºC
The thermal ceramics industry primarily focuses on the 1,000-1,400 ºC temperature range. For many industrial applications that require high-temperature insulation, this range is essential. This section covers the wide range of applications that thermal ceramics, such as ceramic fibres and insulating blocks, are used in. These include high-temperature filtration systems, ceramic furnaces, and process heaters. The global thermal ceramic market is dominated by the 1,000 to 1,400 ºC segment, largely due to the presence of industries such metal alloy equipment, smelting, and mining that need thermal control within this temperature range.
Thermal Ceramic End-Uses
- Mining & Metal Processing
- Chemical & Petrochemical
- Manufacturing
- Power Generation
- Others
Mining & metal processing is a market leader in thermal ceramics owing to the vital function that thermal ceramics play in applications within this industry. For use in furnaces and other activities related to metal processing and mining operations, thermal ceramics such as ceramic fibres and insulation bricks offer high-temperature insulation. The mining and metal processing industries have high standards, and these materials help to satisfy those standards by improving temperature control, lowering heat losses, and increasing energy efficiency. The mining and metal processing industry's hegemony is cemented by the extensive use of thermal ceramics in furnaces and processing machinery.
Thermal Ceramic Market Regional Outlook
North America
- U.S.
- Canada
Europe
- U.K.
- Germany
- France
- Spain
- Rest of Europe
Asia-Pacific
- India
- Japan
- China
- Australia
- South Korea
- Rest of Asia-Pacific
Latin America
- Brazil
- Mexico
- Rest of Latin America
The Middle East & Africa
- South Africa
- GCC Countries
- Rest of the Middle East & Africa (ME&A)

Thermal Ceramic Market Regional Analysis
Asia-Pacific is expected to account for a large market share in the global industry and is projected to grow during the thermal ceramic market forecast period due to the increasing adoption of thermal ceramics for furnaces, primarily used in smelting, mining, and metal alloy machinery. The rise in steel production is also anticipated to drive demand for furnaces, fueled by growth in end-use industries in countries such as India and Japan, thus propelling regional market growth. North America is the fastest growing region in the market for thermal ceramics in 2022, owing to the increasing number of infrastructure projects in the region. According to the American Society of Civil Engineers, the U.S. aims to spend nearly US$ 4.5 trillion on roads, dams, highways, and others by 2025. The demand for clean energy sources is expected to rise significantly in Europe during the thermal ceramic industry forecast period. According to the European Commission, sustainable energy usage is projected to reach noteworthy percentage of the total energy consumed in the region by 20ww, reaching more that that by 2032. The increased use of green energy to boost the need for solar panels will also lead to an increased use of thermal ceramics.
Thermal Ceramic Market Players
Some of the top thermal ceramic companies offered in our report include Rath & Company, Mitsubishi Chemical Corporation, LLC, 3M, RHI Magnesita, YESO Insulating Products, Morgan Advanced Materials, CeramTec, Ibiden, FibreCast Inc., and Dyson Technical Ceramics.
Frequently Asked Questions
How big is the thermal ceramic market?
The thermal ceramic market size was valued at USD 4.2 billion in 2022.
What is the CAGR of the global thermal ceramic market from 2023 to 2032?
The CAGR of thermal ceramic is 5.9% during the analysis period of 2023 to 2032.
Which are the key players in the thermal ceramic market?
The key players operating in the global market are including Rath & Company, Mitsubishi Chemical Corporation, LLC, 3M, RHI Magnesita, YESO Insulating Products, Morgan Advanced Materials, CeramTec, Ibiden, FibreCast Inc., and Dyson Technical Ceramics.
Which region dominated the global thermal ceramic market share?
Asia-Pacific Asia-Pacific held the dominating position in thermal ceramic industry during the analysis period of 2023 to 2032.
Which region registered fastest CAGR from 2023 to 2032?
North America region exhibited fastest growing CAGR for market of thermal ceramic during the analysis period of 2023 to 2032.
What are the current trends and dynamics in the global thermal ceramic industry?
The current trends and dynamics in the thermal ceramic industry include growing demand for energy-saving solutionsincreasing applications in high-temperature insulation, rapid industrialization fosters demand for thermal ceramics in emerging economies, and rising emphasis on temperature control in various industries.
Which end-use held the maximum share in 2022?
The mining & metal processing end-use held the maximum share of the thermal ceramic industry.


