Swimming Pool Chemicals Market | Acumen Research and Consulting
Swimming Pool Chemicals Market Size - Global Industry, Share, Analysis, Trends and Forecast 2022 – 2030
Published :
Report ID:
Pages :
Format :
The Global Swimming Pool Chemicals Market Size accounted for USD 3,905 Million in 2021 and is projected to achieve a market size of USD 5,254 Million by 2030 rising at a CAGR of 3.5% from 2022 to 2030. Growing number of swimming sport events is a leading factor that is driving the swimming pool chemicals market share. In addition to that, the increasing number of hotels, villas, and resorts is considered a popular swimming pool chemicals market trend that is fueling the industry demand.

Swimming Pool Chemicals Market Report Statistics
- Global swimming pool chemicals market revenue is estimated to reach USD 5,254 Million by 2030 with a CAGR of 3.5% from 2022 to 2030
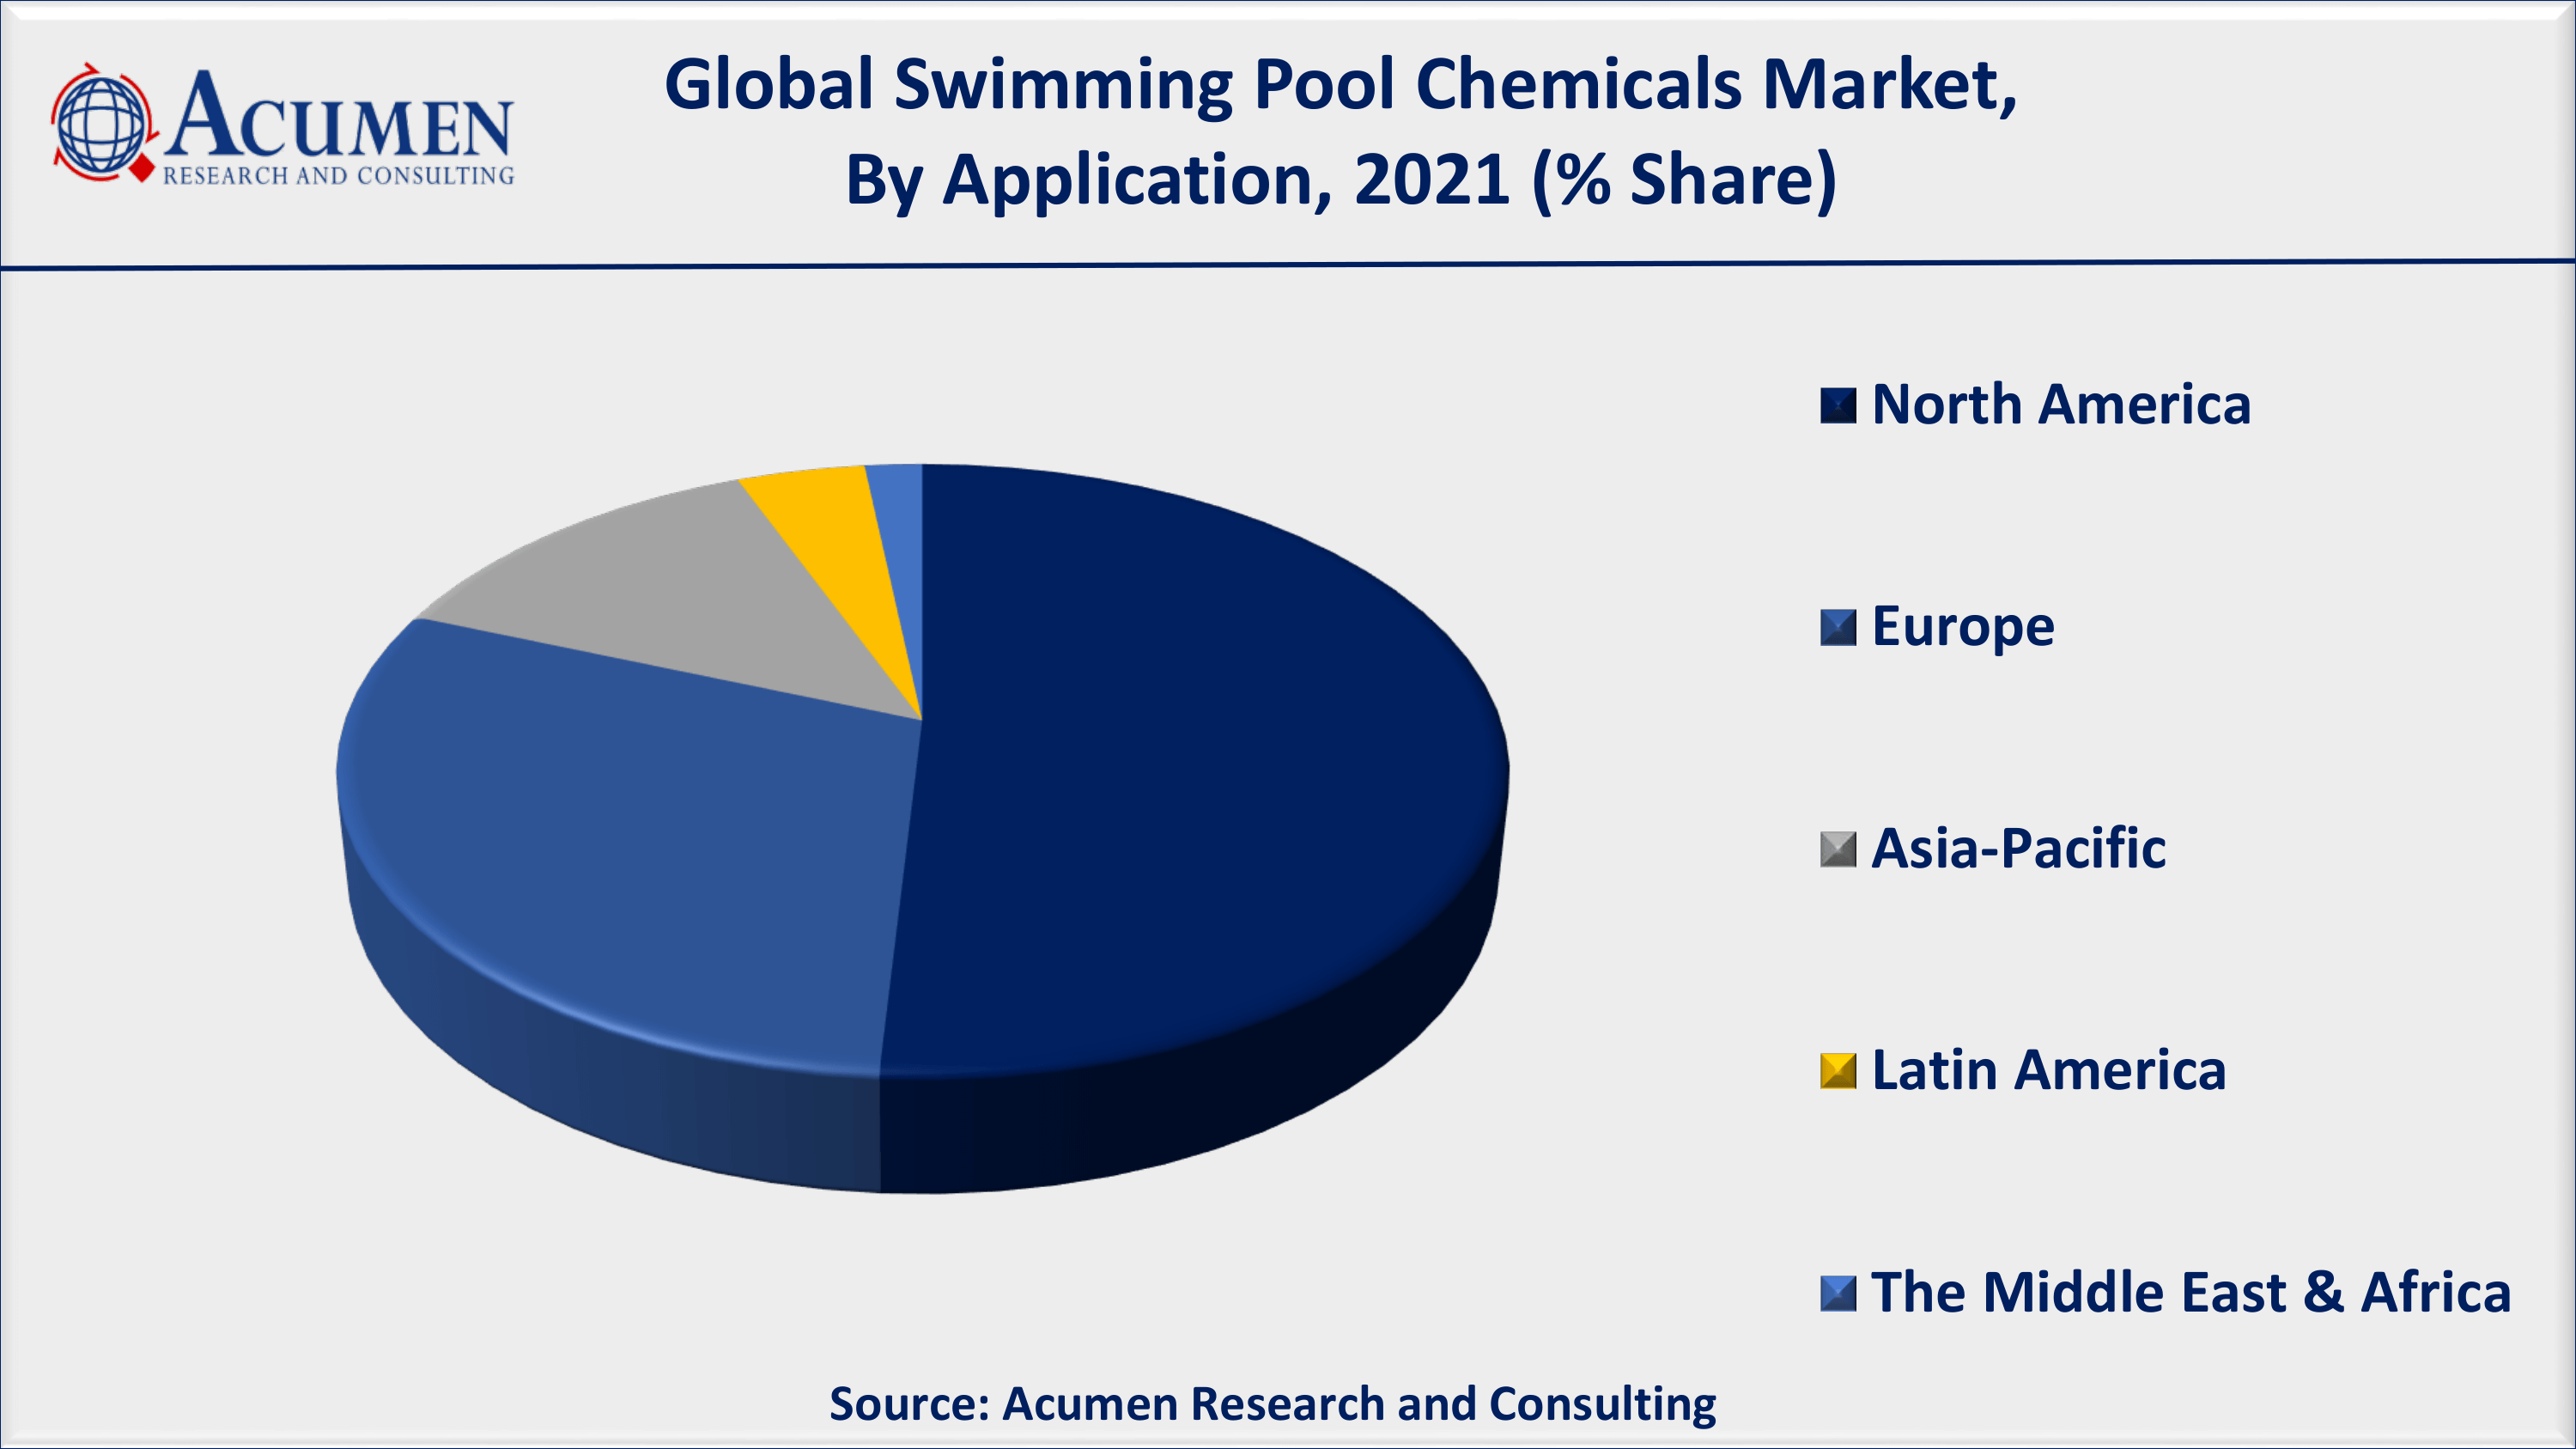
- North America swimming pool chemicals market share accounted for over 51% shares in 2021
- According to the Association of Pool and Spa Professionals, there are over 10.7 million swimming pools in the United States
- Asia-Pacific swimming pool chemicals market growth will register fastest CAGR from 2022 to 2030
- Based on type, chlorine covered for over 40% of the overall market share in 2021
- Rising number of road accidents primarily fuels the global swimming pool chemicals market value
Swimming pools are foreseen as luxury and sophisticated lifestyle worldwide. Fitness oriented population are majorly inclined towards the use of swimming pools for their routine exercise and as a result high adoption of swimming pools is observed in recent years. With the increasing adoption of swimming pool constructions, the adoption of chemicals for maintaining these pools has increased widely. These chemicals are utilized at regular basis for maintenance purpose and to ensure the safety of population from various diseases.
Global Swimming Pool Chemicals Market Dynamics
Market Drivers
- Growing number of swimming pools in emerging nations
- High demand for residential swimming pools
- Increase in swimming as a recreational activity
Market Restraints
- Risk of skin disease occurred by the exposure of high chemical dosage
- Surging preference for natural swimming pools
Market Opportunities
- Growing number of luxurious hotels, villas, and resorts
- Rapid urbanization among growing economies
Swimming Pool Chemicals Market Report Coverage
| Market | Swimming Pool Chemicals Market |
| Swimming Pool Chemicals Market Size 2021 | USD 3,905 Million |
| Swimming Pool Chemicals Market Forecast 2030 | USD 5,254 Million |
| Swimming Pool Chemicals Market CAGR During 2022 - 2030 | 3.5% |
| Swimming Pool Chemicals Market Analysis Period | 2018 - 2030 |
| Swimming Pool Chemicals Market Base Year | 2021 |
| Swimming Pool Chemicals Market Forecast Data | 2022 - 2030 |
| Segments Covered | By Type, By Application, And By Geography |
| Regional Scope | North America, Europe, Asia Pacific, Latin America, and Middle East & Africa |
| Key Companies Profiled | Solvay, Lonza, Olin Corporation., Ercros S.A., Arkema, Occidental Petroleum Corporation, BASF SE, AGC Inc., ICL, and Lenntech B.V. |
| Report Coverage |
Market Trends, Drivers, Restraints, Competitive Analysis, Player Profiling, Regulation Analysis |
Swimming Pool Chemicals Market Dynamics
The swimming pool chemical market is majorly driven owing to the factors such as increasing adoption of swimming pools in schools combined with maintaining standards for international sport events for swimmers. Conversely, high dosage of chemicals if mixed with pool water can lead to skin disease thus; growth of this market can be restraint to some extent. The increasing construction of luxurious apartment is also expected to lead to rise in pool constructions, thus increasing the adoption of swimming pool chemicals.
Some of the leading trends in the swimming pool chemicals market that are fueling demand in the coming years are an increase in the number of fitness enthusiasts, an increase in swimming as a recreational activity, and an increase in the number of swimming sporting events. The ongoing residential construction recovery in the United States, top European countries, China, India, and several other countries around the world is a positive growth factor for swimming pool construction. Furthermore, an increase in the number of international tourists and a thriving tourism industry, supported by higher income and tourism spending, are expected to boost hotel output. Natural pools, also known as eco pools or organic pools use natural components to keep the water clean and safe for swimming. There are no chemicals required in this swimming pool. As a result, the demand for swimming pool chemicals will decline in the near future.
Swimming Pool Chemicals Market Segmentation
The worldwide swimming pool chemicals market is split based on type, application, and geography.
Swimming Pool Chemicals Market By Type
- Trichlor
- Dichlor
- Cal hypo
- Liquid Chlorine
- Algaecides
- Balancers
- Specialty Product

According to our swimming pool chemicals industry analysis, the liquid chlorine segment was the most profitable in the swimming pool chemicals market. The most common chemical used to sterilize a pool is chlorine. According to the American Chemistry Council, chlorine is a powerful oxidant of unwanted pollutants as well as a fast and effective sanitizer.
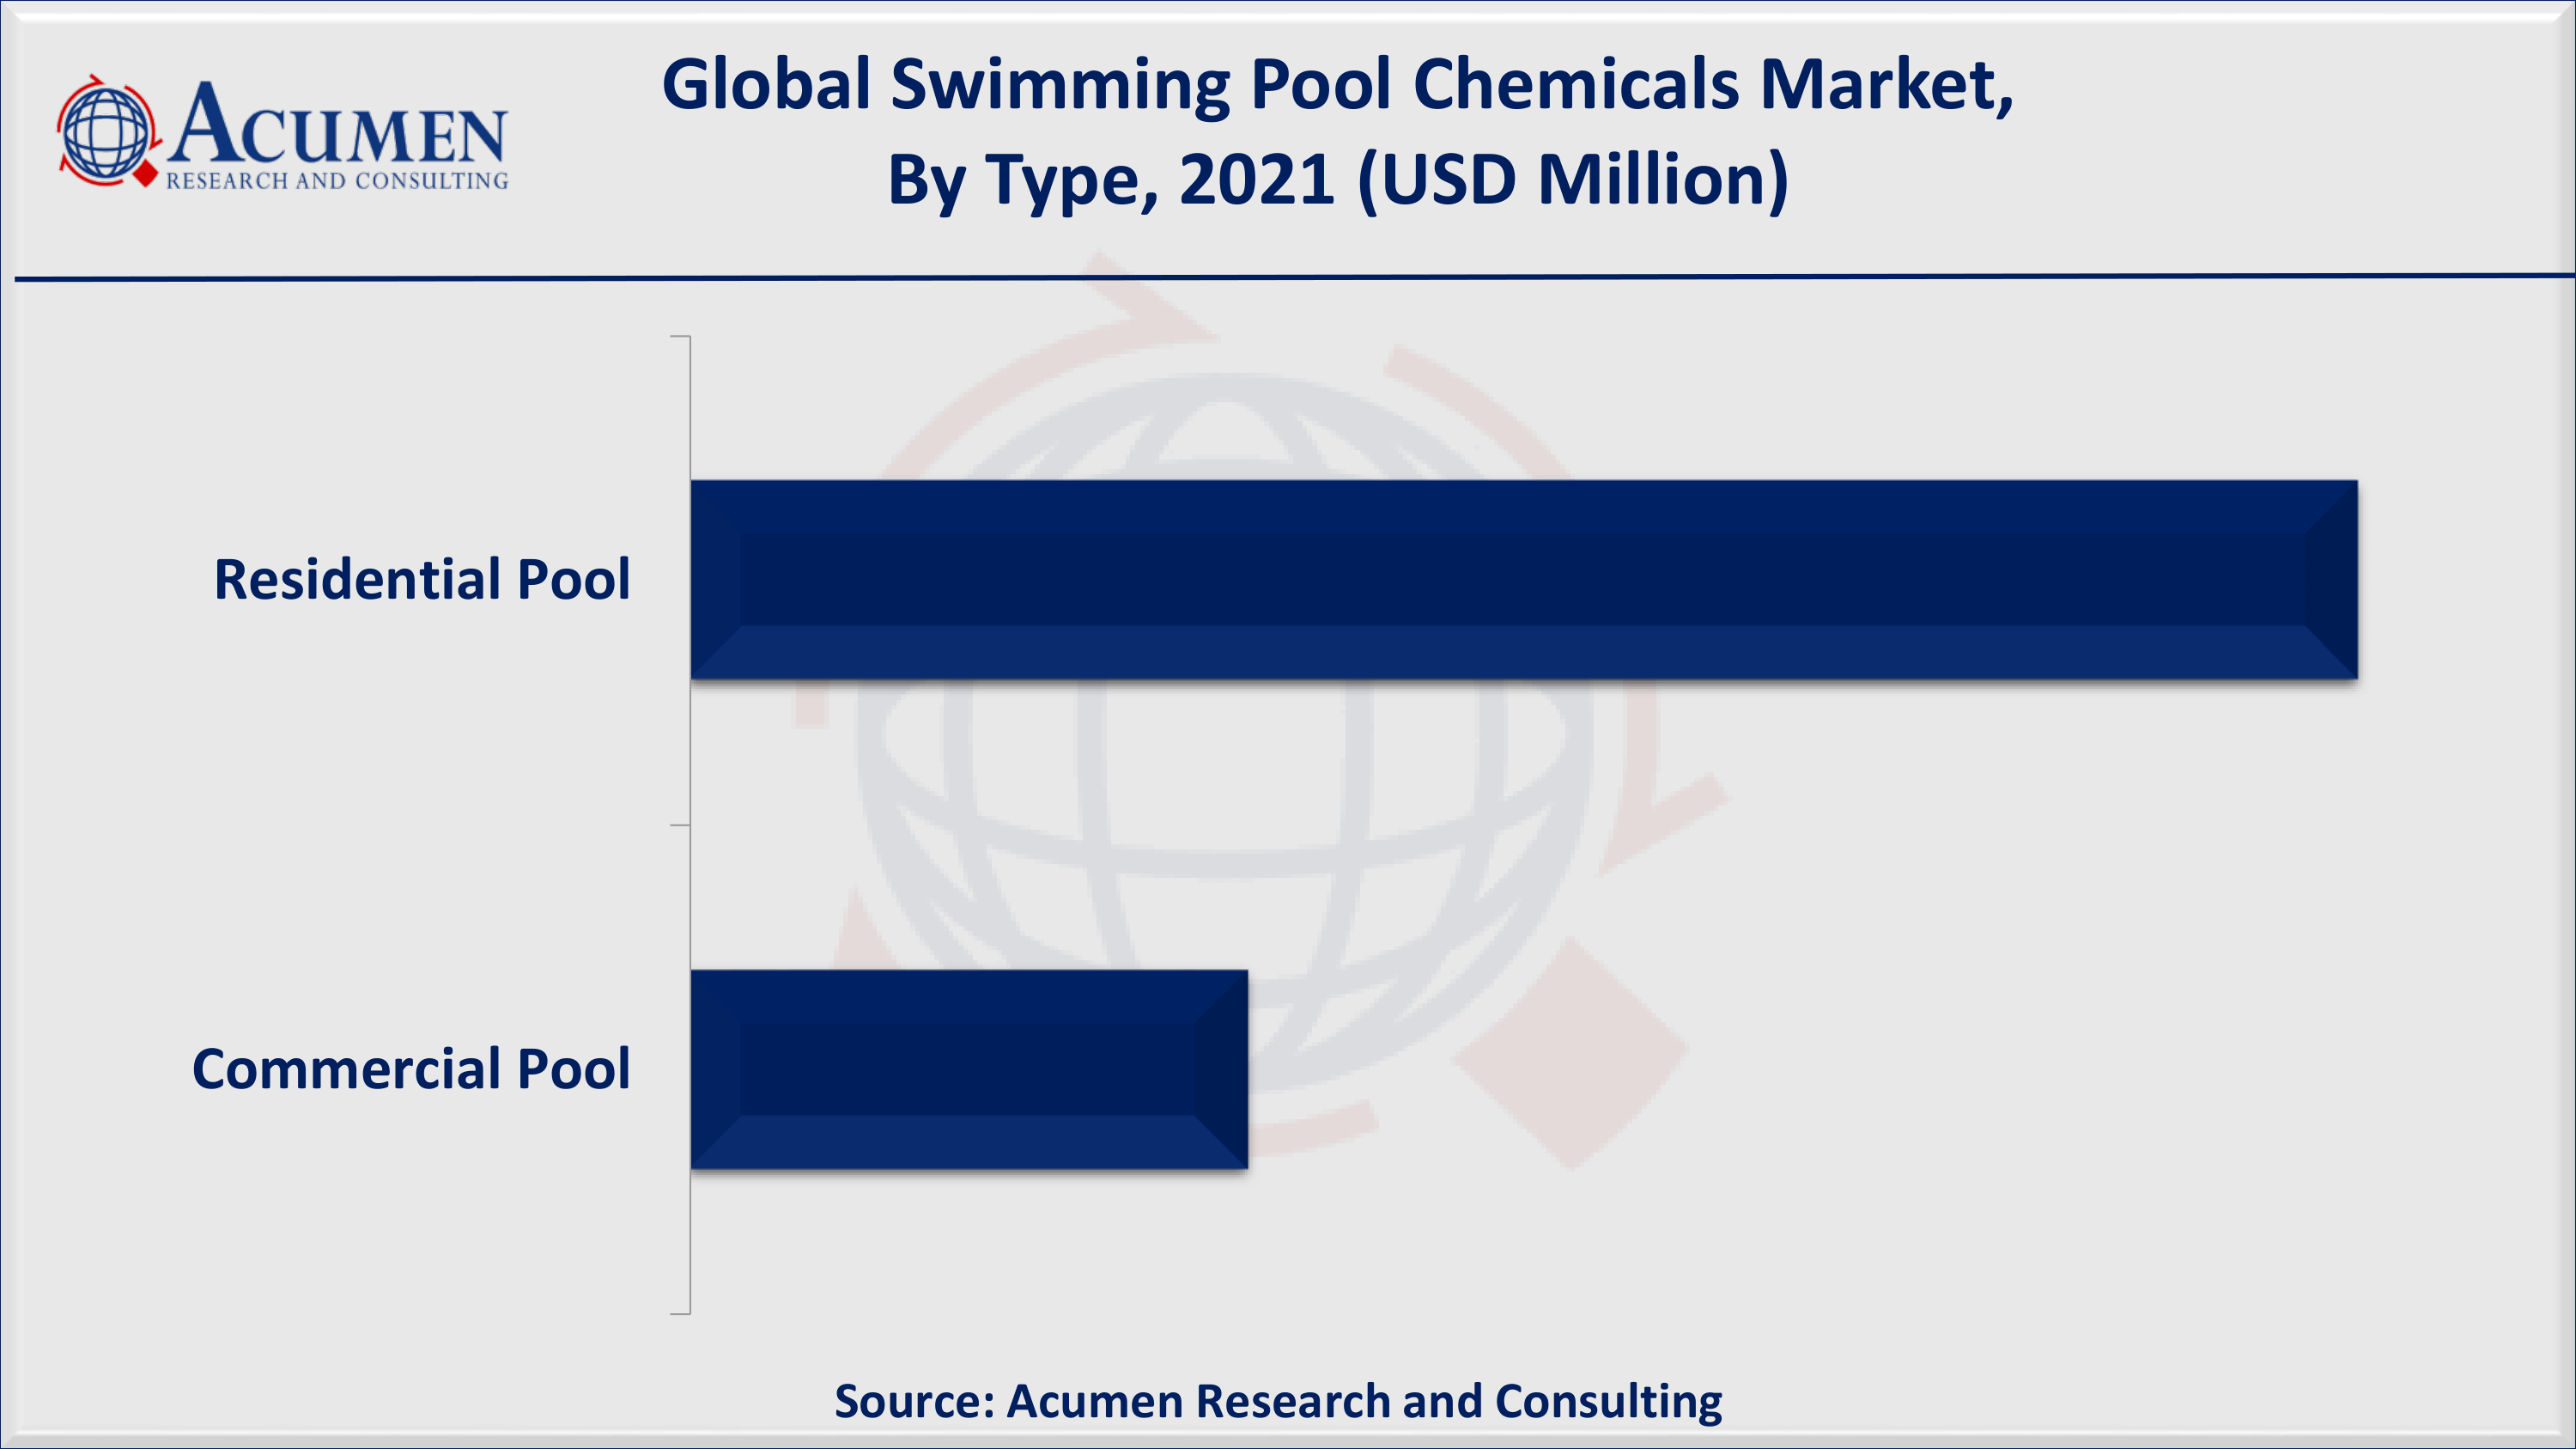
Swimming Pool Chemicals Market By Application
- Residential Pool
- Commercial Pool

As per swimming pool chemicals market forecast, the commercial pools segment is expected to witness highest growth in forthcoming years. Rise in disposable income, along with sophisticated lifestyle has augmented the demand for residential and commercial swimming pools. However, residential pools are dominating the growth of this market and are expected to maintain its dominance throughout the forecast period from 2022 to 2030.
Swimming Pool Chemicals Market Regional Outlook
North America
- U.S.
- Canada
Europe
- U.K.
- Germany
- France
- Spain
- Rest of Europe
Latin America
- Mexico
- Brazil
- Rest of Latin America
Asia-Pacific
- India
- Japan
- China
- Australia
- South Korea
- Rest of Asia-Pacific
The Middle East & Africa (MEA)
- Gulf Cooperation Council (GCC)
- South Africa
- Rest of the Middle East & Africa
Swimming Pool Chemicals Market Regional Analysis
U.S. Pool Owners Spend Billions on Swimming Pool Maintenance Each Year
According to our swimming pool chemicals industry analysis, North America region conquered the global market with tremendous shares and is likely to continue its dominance throughout the forecast timeframe from 2022 to 2030. US alone is the home of 10.7 million swimming pools (10.4 million residential and 309,000 are public). The United States has 130 million households, with an estimated 8% having a swimming pool. In terms of pool design, nearly 59% of residential pools are in-ground, while 41% are above-ground. Thus, our industry analysis found that the Americans spend over US$ 4 billion on the maintenance of swimming pool every year. On top of that, growing swimming sporting events, growth in swimming as a recreational activity, and increasing consumer awareness about water-based disease caused from polluted swimming pool water are some of the key factors that are supporting the North America swimming pool chemicals industry. On the other hand, the Asia-Pacific region is anticipated to witness a quick growth during the projected timeframe from 2022 to 2030. The increasing construction projects, rising urbanization, increasing disposable income, and growth in number of hotels and villas are supporting the APAC swimming pool chemicals market.
Swimming Pool Chemicals Market Players
Some of the key swimming pool chemicals companies in the market are AGC Inc., Arkema, BASF SE, Ercros S.A., ICL, Lenntech B.V., Lonza, Occidental Petroleum Corporation, Olin Corporation., and Solvay.
Frequently Asked Questions
What is the size of global swimming pool chemicals market in 2021?
The market size of swimming pool chemicals market in 2021 was accounted to be USD 3,905 Million.
What is the CAGR of global swimming pool chemicals market during forecast period of 2022 to 2030?
The projected CAGR of swimming pool chemicals market during the analysis period of 2022 to 2030 is 3.5%.
Which are the key players operating in the market?
The prominent players of the global swimming pool chemicals market are AGC Inc., Arkema, BASF SE, Ercros S.A., ICL, Lenntech B.V., Lonza, Occidental Petroleum Corporation, Olin Corporation., and Solvay.
Which region held the dominating position in the global swimming pool chemicals market?
North America held the dominating swimming pool chemicals during the analysis period of 2022 to 2030.
Which region registered the fastest growing CAGR for the forecast period of 2022 to 2030?
Asia-Pacific region exhibited fastest growing CAGR for swimming pool chemicals during the analysis period of 2022 to 2030.
What are the current trends and dynamics in the global swimming pool chemicals market?
Growing number of swimming pools in emerging nations, high demand for residential swimming pools, and increase in swimming as a recreational activity drives the growth of global swimming pool chemicals market.
Which application held the maximum share in 2021?
Based on application, residential segment is expected to hold the maximum share swimming pool chemicals market.


