STS Cranes Market Size - Global Industry, Share, Analysis, Trends and Forecast 2024 - 2032
Published :
Report ID:
Pages :
Format :
STS Cranes Market Size - Global Industry, Share, Analysis, Trends and Forecast 2024 - 2032
Report Coverage
- Industry Dynamics
- Market Size and Forecast Data
- Segment Analysis
- Competitive Landscape
- Regional Analysis with a Niche Focus on Country-Level Data
- High Level Analysis - Porter's, PESTEL, Value Chain, etc.
- Company Profiles of Key Players
- Option to Customize the Report As Per Your Specific Need
Request Sample Report
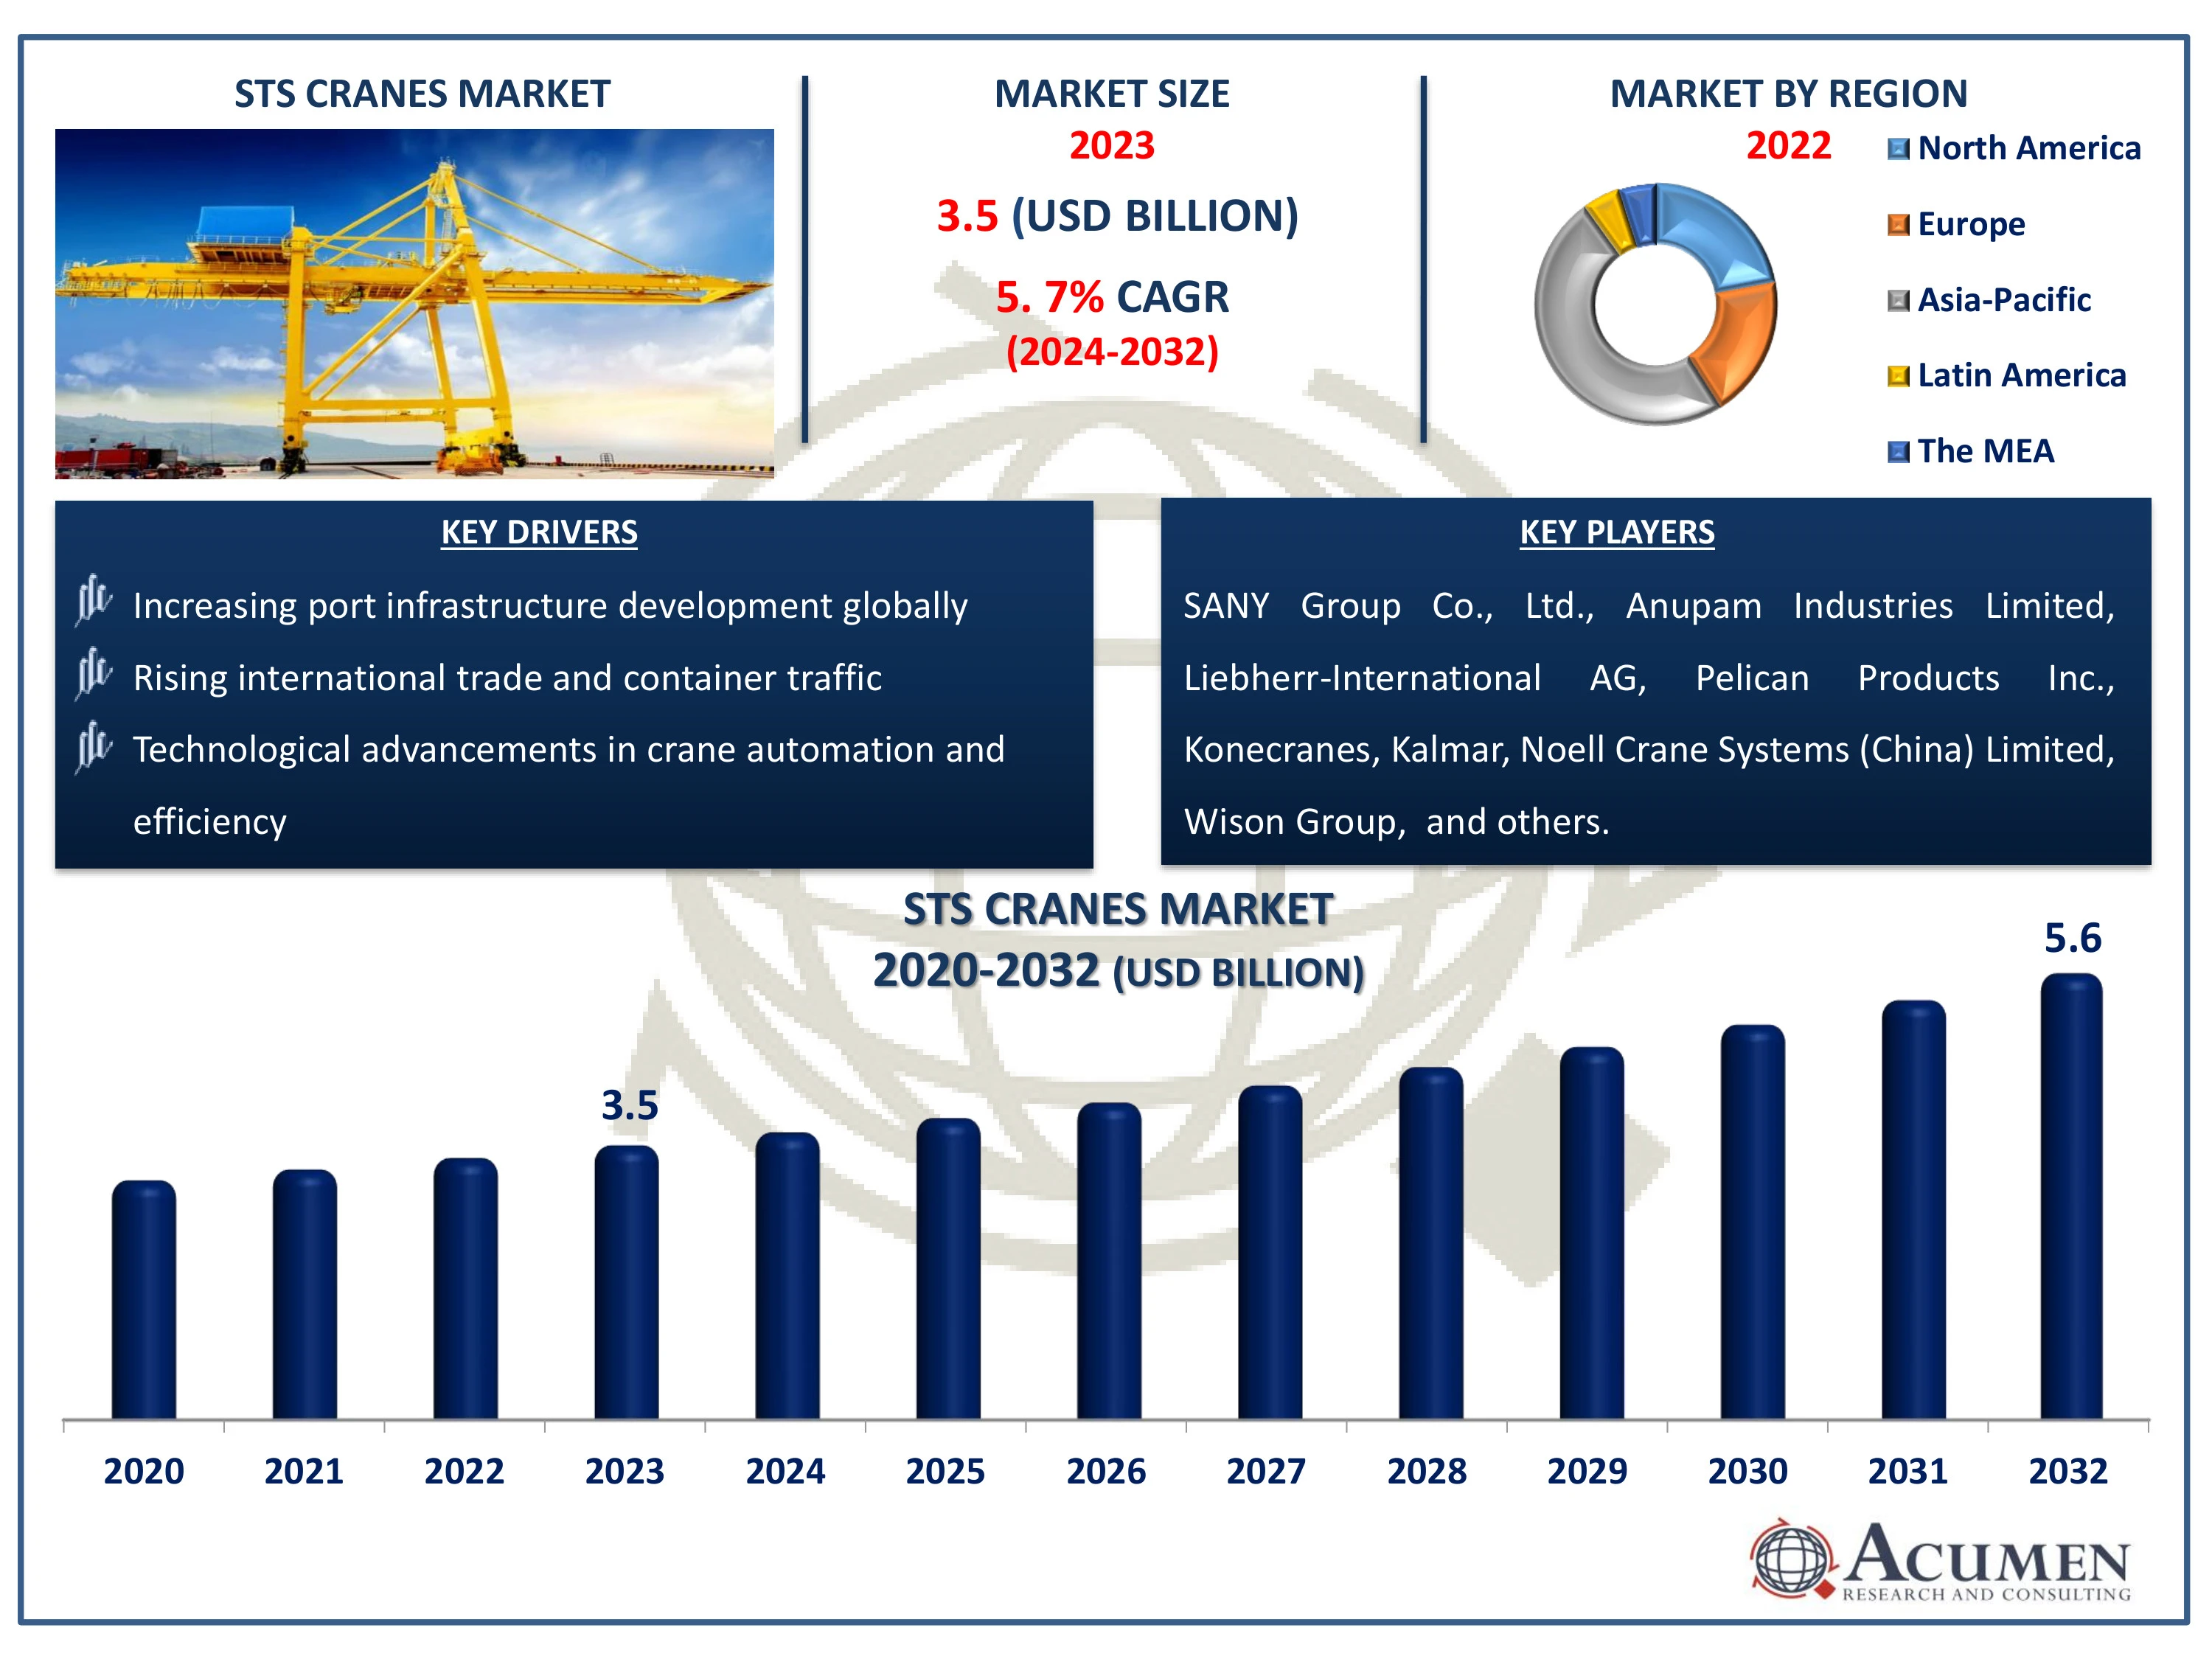
The Global STS Cranes Market Size accounted for USD3.5 Billion in 2023 and is estimated to achieve a market size of USD 5.6 Billion by 2032 growing at a CAGR of 5.7% from 2024 to 2032.
STS Cranes Market Highlights
- Global STS cranes market revenue is poised to garner USD 5.6billion by 2032 with a CAGR of 5.7%from 2024 to 2032
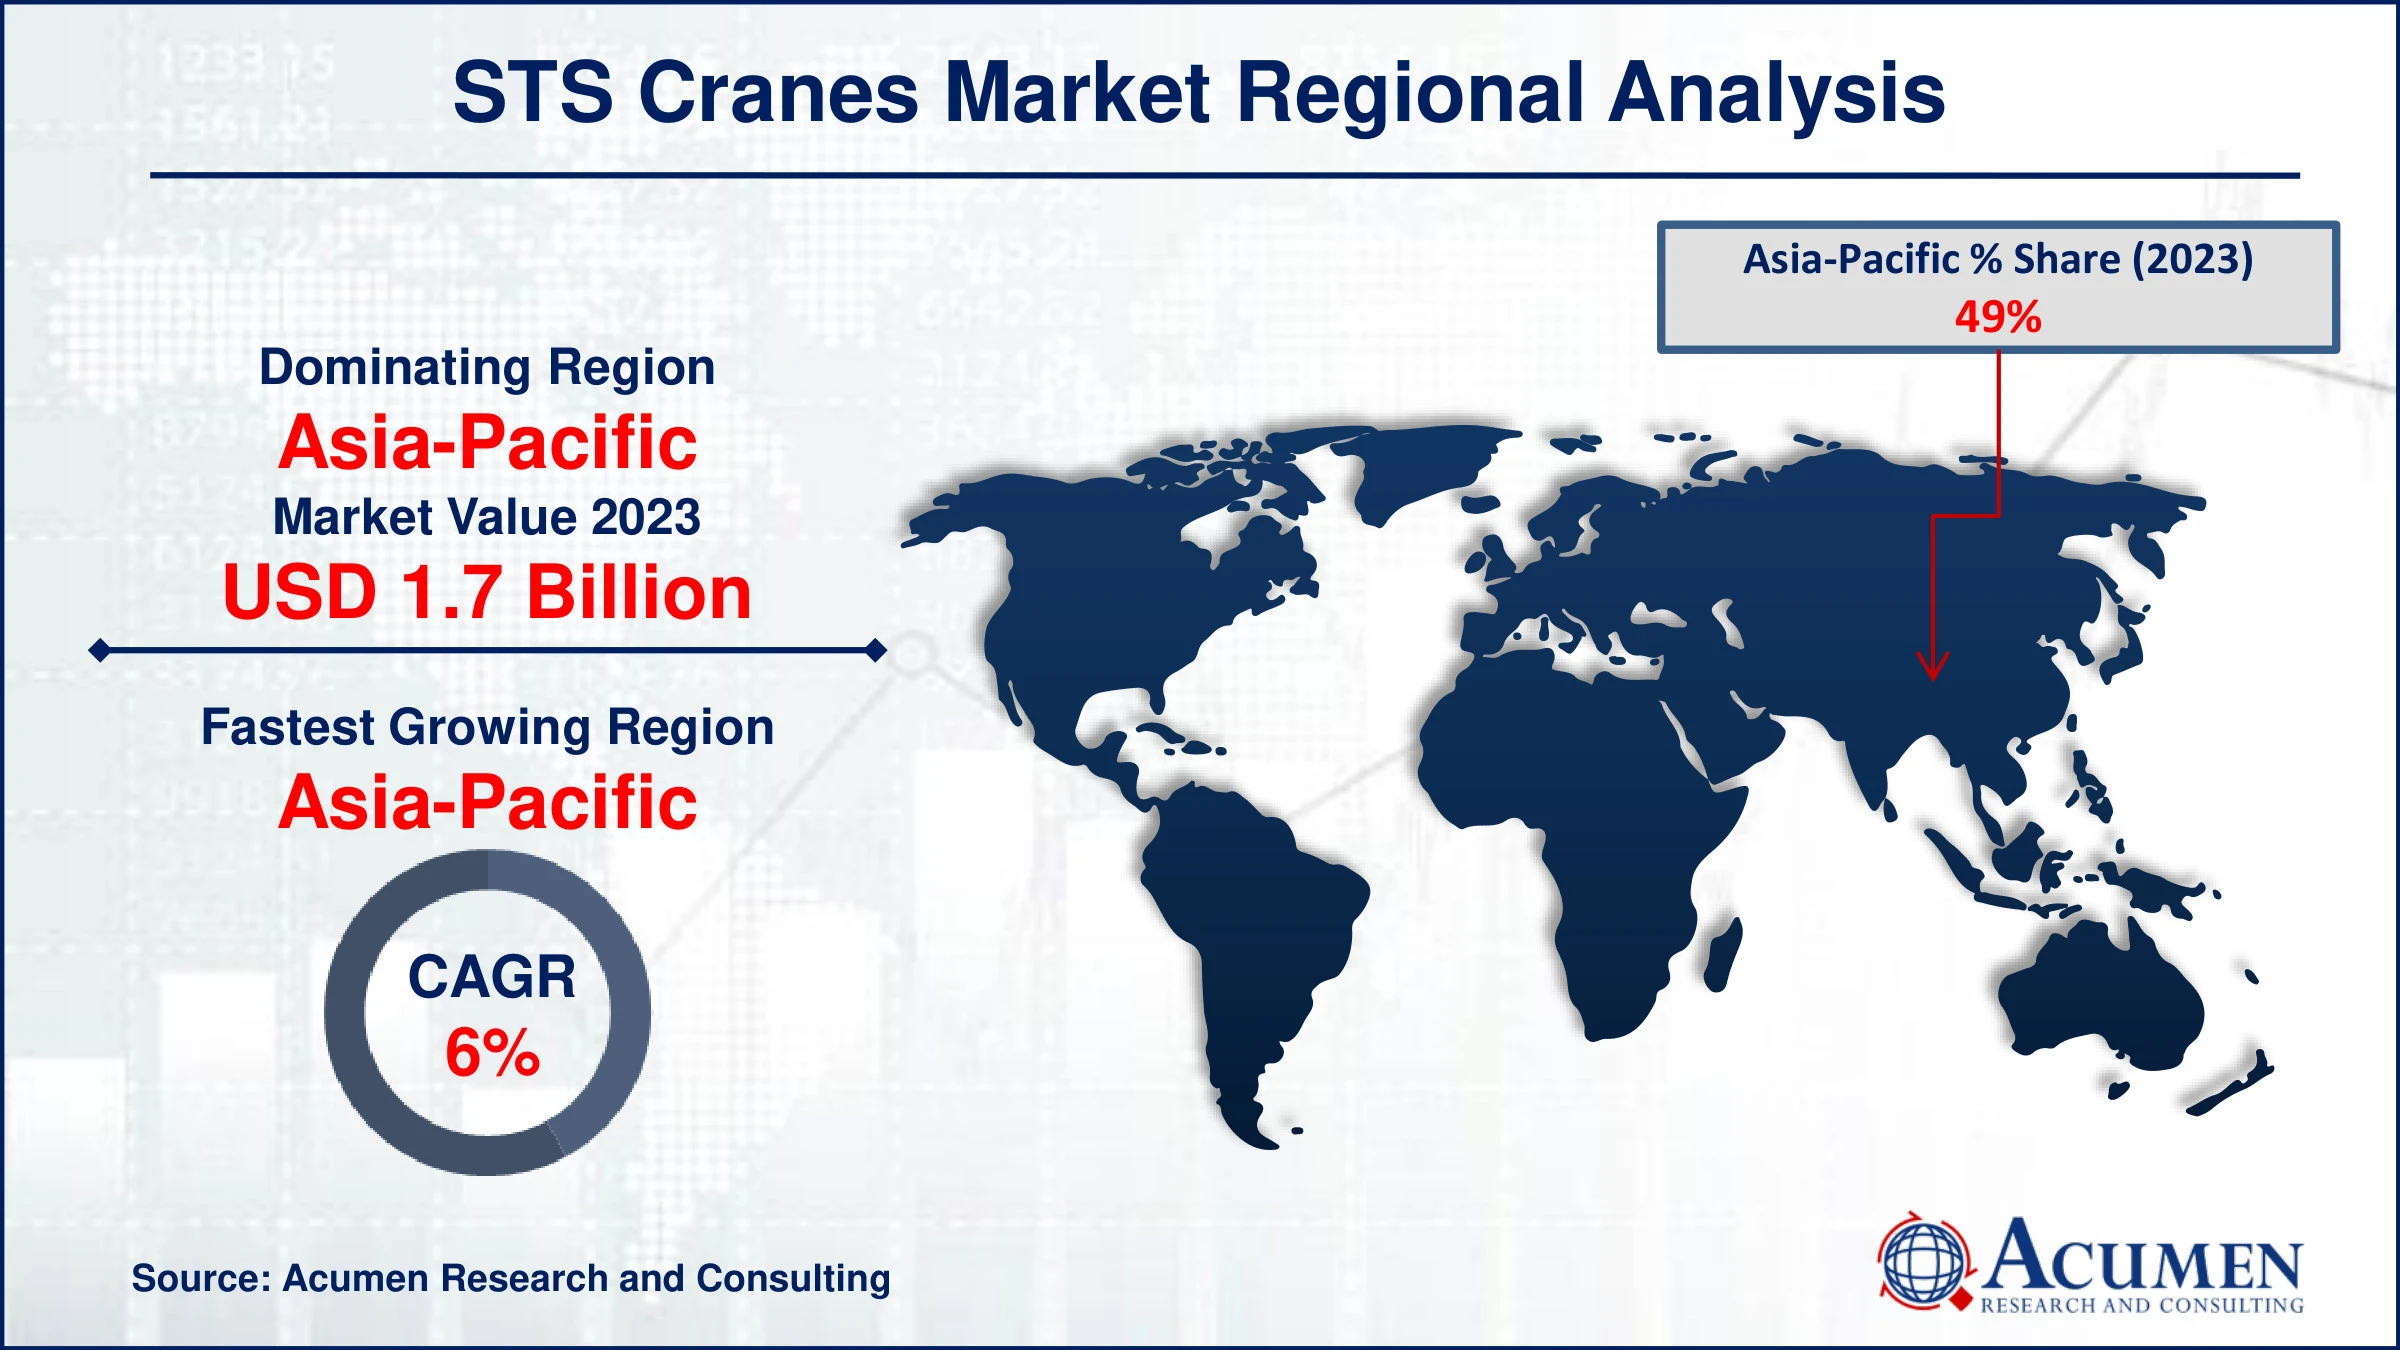
- Asia-Pacific STS cranes market value occupied aroundUSD 1.7 billion in 2023
- Asia-PacificSTS cranes market growth will record a CAGR of more than 6% from 2024 to 2032
- Among power supply, the electric sub-segment generated USD1.4 billionrevenuein 2023
- Based on product, the high-profile cranes segment occupied60% market share in 2023
- Based on lifting capacity, the post panamax STS cranes segment contributed 46% market share in 2023
- Increased adoption of automated and remote-controlled cranes is the STS cranes market trend that fuels the industry demand

STS (ship-to-shore) cranes are specialized gantry cranes used in ports for loading and unloading containers from ships. These towering structures are positioned on the dock and have long reach capabilities to handle containers across the ship's width. They are crucial for efficient port operations, providing high-speed, precise movements of containers to and from the vessel. STS cranes are equipped with advanced control systems to ensure safe and accurate placement of cargo. Their applications extend to managing various container types, including refrigerated and hazardous goods. By streamlining the cargo handling process, STS cranes play a vital role in global trade and supply chain efficiency. Their design and functionality contribute significantly to the overall throughput of port operations.
Global STS Cranes Market Dynamics
Market Drivers
- Increasing port infrastructure development globally
- Rising international trade and container traffic
- Technological advancements in crane automation and efficiency
Market Restraints
- High initial investment and maintenance costs
- Environmental concerns and regulations
- Volatility in raw material prices affecting production costs
Market Opportunities
- Integration of IoT and AI for predictive maintenance and operational efficiency
- Expansion in emerging markets with growing port activities
- Increasing adoption of green and eco-friendly crane technologies
STS Cranes Market Report Coverage
|
Market |
STS Cranes Market |
|
STS CranesMarket Size 2023 |
USD 3.5Billion |
|
STS CranesMarket Forecast 2032 |
USD 5.6Billion |
|
STS Cranes Market CAGR During 2024 - 2032 |
5.7% |
|
STS Cranes Market Analysis Period |
2020 - 2032 |
|
STS Cranes Market Base Year |
2023 |
|
STS Cranes Market Forecast Data |
2024 - 2032 |
|
Segments Covered |
By Product Type, By Outreach, By Power Supply, By Lifting Capacity, and By Geography |
|
Regional Scope |
North America, Europe, Asia Pacific, Latin America, and Middle East & Africa |
|
Key Companies Profiled |
SANY Group Co., Ltd., Anupam Industries Limited, Pelican Products Inc., Liebherr-International AG, Konecranes, Kalmar, Noell Crane Systems (China) Limited, Wison Group, Shanghai Zhenhua Heavy Industries Co., Ltd, and Kranunion GmbH. |
|
Report Coverage |
Market Trends, Drivers, Restraints, Competitive Analysis, Player Profiling, Covid-19 Analysis, Regulation Analysis |
STS Cranes Market Insights
The surge in global port infrastructure development is a key driver of growth in the STS (ship-to-shore) cranes market. For instance, the U.S. Department of Transportation (USDOT) is providing $450 Billion in grants to enhance ports. This funding is part of a program aimed at upgrading and expanding port facilities to make shipping and trade operations more effective. As international trade and container traffic increase, ports are expanding and modernizing to handle larger volumes and bigger vessels. This expansion necessitates the adoption of advanced STS cranes, which enhance operational efficiency and capacity. Additionally, investments in port automation and smart technologies further bolster demand for high-performance STS cranes.
Environmental concerns and regulations are significantly restraining the ship-to-shore crane market. Stricter emission standards and noise pollution controls are driving up compliance costs for manufacturers and port operators. Additionally, the push for greener technologies necessitates substantial investments in research and development. These factors collectively limit market growth and impose financial burdens on industry stakeholders.
The increasing adoption of green and eco-friendly technologies in the crane industry is significantly impacting the STS (ship-to-shore) cranes market. These technologies focus on reducing carbon emissions and improving energy efficiency, aligning with global environmental sustainability goals. This shift is driven by regulatory pressures and the growing preference of port operators for sustainable solutions. Consequently, manufacturers are innovating to produce STS cranes with advanced energy recovery systems and electric drives, creating new market opportunities.
STS Cranes Market Segmentation
The worldwide market for STS cranes is split based on product type, outreach, power supply, lifting capacity, and geography.
STS Cranes Product Type
- High Profile Cranes
- Low Profile Cranes
According to the STS cranes industry analysis, high-profile cranes dominate the market due to their ability to handle larger vessels with higher efficiency, crucial for modern port operations. These cranes offer greater outreach and lifting capacity, facilitating quicker loading and unloading processes. Their advanced technology and automation capabilities enhance operational productivity and safety. Consequently, ports investing in high-profile STS cranes are better equipped to meet the demands of increased global trade and larger container ships.
STS Cranes Outreach
- <40
- 40-49
- 50-60
- 60+
According to the STS cranes industry forecast, the 60+ outreach capability is expected to becoming dominant in the ship-to-shore crane market due to the rising demand for larger cranes that can service the largest container ships. This trend is driven by the need for greater efficiency and faster loading and unloading times at ports, as well as the push for higher throughput. As global trade volumes continue to grow, ports are investing in these advanced STS cranes to remain competitive and meet the demands of modern shipping logistics.
STS Cranes Power Supply
- Diesel
- Electric
- Hybrid
According to the STS cranes industry analysis, electric power supply is the dominant energy source in the market due to its efficiency and lower operational costs compared to diesel alternatives. Electrification of STS cranes enhances environmental sustainability by reducing carbon emissions and noise pollution. It also improves reliability and performance, minimizing downtime and maintenance needs. The growing emphasis on green port initiatives and regulatory pressure to reduce emissions further drives the adoption of electric power in this sector.
STS Cranes Lifting Capacity
- Panamax STS Cranes
- Post Panamax STS Cranes
- Super-Post Panamax STS Cranes
According to the STS cranes industry analysis, post-panamax ship-to-shore cranes dominate the market due to their ability to handle larger vessels, which are increasingly common in global trade. These cranes offer higher lifting capacities and extended outreach, accommodating the size and operational demands of modern container ships. Their efficiency in loading and unloading enhances port productivity and reduces turnaround times. As global shipping continues to evolve, the demand for post-panamax STS cranes remains strong.
STS Cranes Market Regional Outlook
North America
- U.S.
- Canada
Europe
- U.K.
- Germany
- France
- Spain
- Rest of Europe
Asia-Pacific
- India
- Japan
- China
- Australia
- South Korea
- Rest of Asia-Pacific
Latin America
- Brazil
- Mexico
- Rest of LATAM
The Middle East & Africa
- South Africa
- GCC Countries
- Rest of the Middle East & Africa (ME&A)

STS Cranes Market Regional Analysis
For several reasons, The Asia-Pacific dominates and fastest-growing region the STS (ship-to-shore) crane market due to its booming maritime trade and robust port infrastructure development. Countries like China, Japan, and South Korea are key players, investing heavily in advanced crane technologies to enhance their port efficiency. The region's strategic position as a global shipping hub further drives demand for state-of-the-art STS cranes. For instance, in December 2022, the South Pacific International Container Terminal (SPICT) at the Port of Lae in Papua New Guinea received two new ship-to-shore (STS) cranes. This significant development will enhance the port's container handling capacity, enabling it to manage more cargo and accommodate larger vessels. As a result, the port is expected to attract more shipping lines and boost trade in the region. Additionally, the rapid growth of containerized cargo and expansion of trade routes contribute to the market's dominance in this area.
North America shows notable growth in STS (ship-to-shore) crane market due to the robust expansion of its port infrastructure and increasing trade volumes. The region’s significant investments in upgrading port facilities and the need for efficient cargo handling are driving demand for advanced STS cranes. For instance, according to the U.S. Department of Transportation, the Biden-Harris Administration announced an investment of over $653 Billion in ports on November 3, 2023, aimed at strengthening American supply chains. Additionally, the adoption of automation and technological advancements in crane operations is enhancing productivity and attracting more investments in North American region.
STS Cranes Market Players
Some of the top STS cranes companies offered in our report include SANY Group Co., Ltd., Anupam Industries Limited, Pelican Products Inc., Liebherr-International AG, Konecranes, Kalmar, Noell Crane Systems (China) Limited, Wison Group, Shanghai Zhenhua Heavy Industries Co., Ltd, and Kranunion GmbH.
Frequently Asked Questions
How big is the STS cranes market?
The STS cranes market size was valued at USD 3.5 billion in 2023.
What is the CAGR of the global STS cranes market from 2024 to 2032?
The CAGR of STS crane is 5.6% during the analysis period of 2024 to 2032.
Which are the key players in the STS cranes market?
Which are the key players in the STS cranes market?
Which region dominated the global STS cranes market share?
Asia-Pacific held the dominating position in STS Crane�s industry during the analysis period of 2024 to 2032.
Which region registered fastest CAGR from 2024 to 2032?
Asia-Pacific region exhibited fastest growing CAGR for market of STS cranes during the analysis period of 2024 to 2032.
What are the current trends and dynamics in the global STS cranes industry?
The current trends and dynamics in the STS cranes industry include increasing port infrastructure development globally, rising international trade and container traffic, and technological advancements in crane automation and efficiency.
Which product type held the maximum share in 2023?
The high profile cranes product type held the maximum share of the STS cranes industry.


