Sterility Indicators Market Size - Global Industry, Share, Analysis, Trends and Forecast 2024 - 2032
Published :
Report ID:
Pages :
Format :
Sterility Indicators Market Size - Global Industry, Share, Analysis, Trends and Forecast 2024 - 2032
Report Coverage
- Industry Dynamics
- Market Size and Forecast Data
- Segment Analysis
- Competitive Landscape
- Regional Analysis with a Niche Focus on Country-Level Data
- High Level Analysis - Porter's, PESTEL, Value Chain, etc.
- Company Profiles of Key Players
- Option to Customize the Report As Per Your Specific Need
Request Sample Report
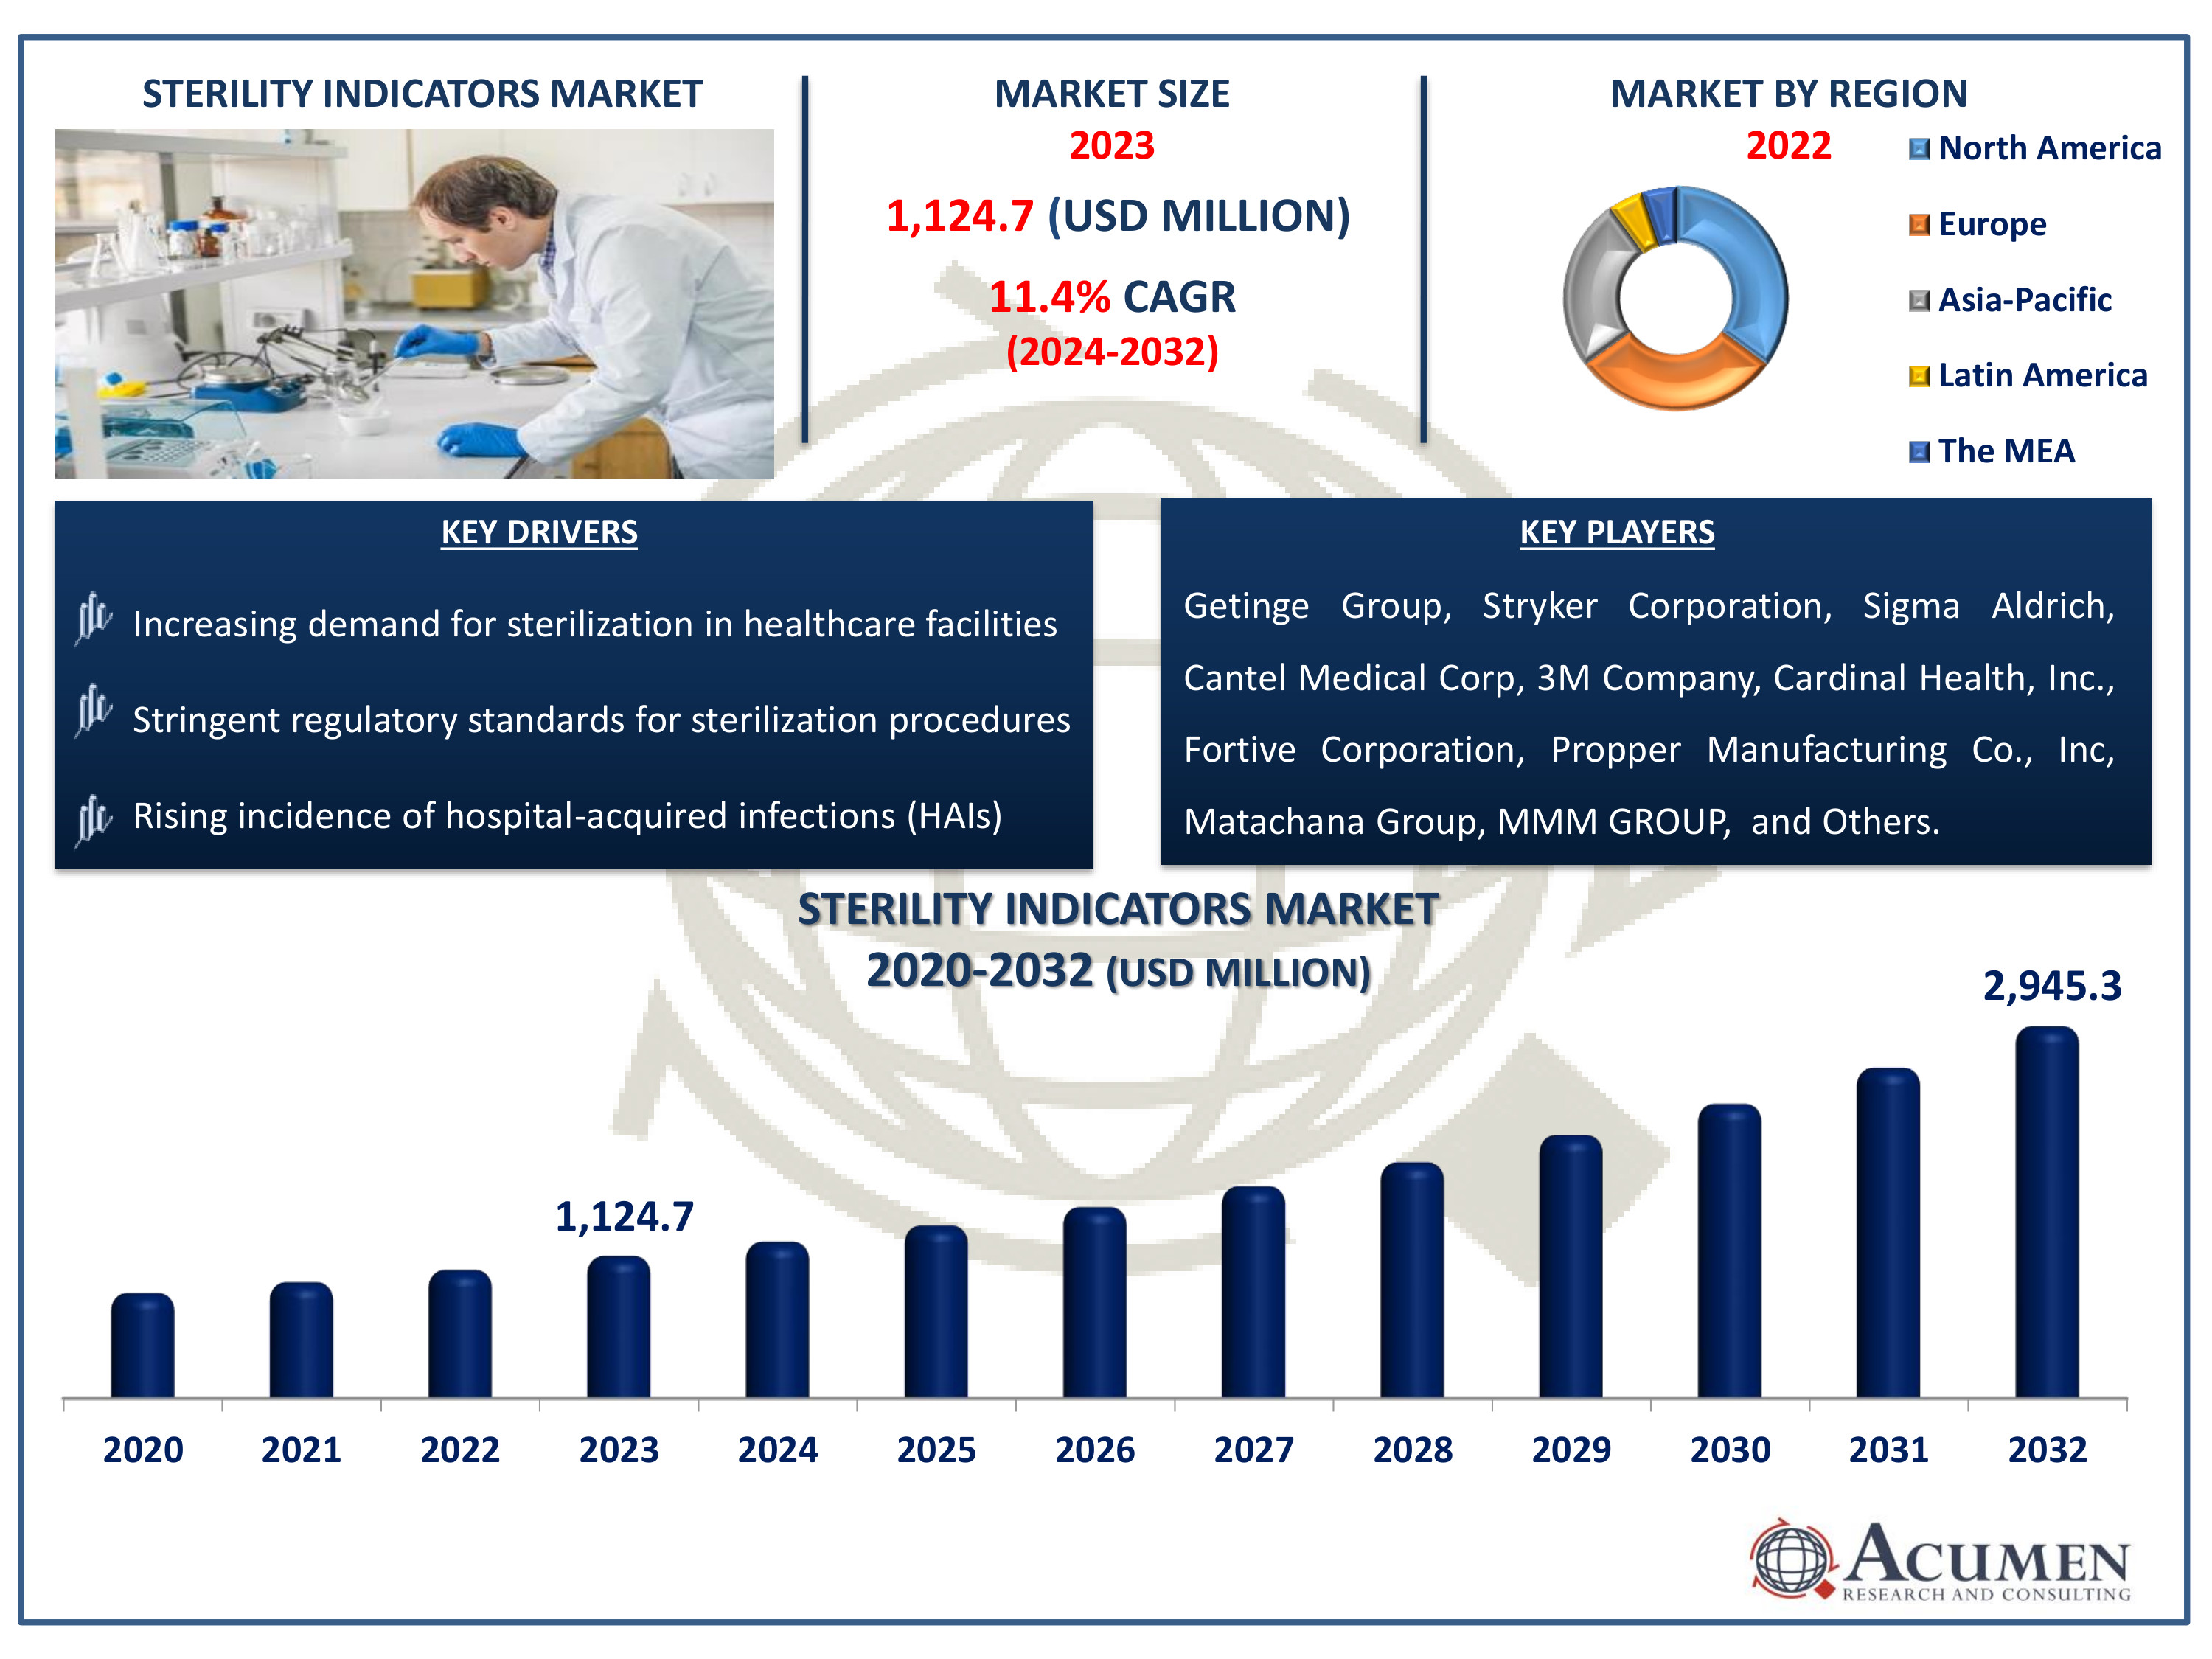
The Sterility Indicators Market Size accounted for USD 1,124.7 Million in 2023 and is estimated to achieve a market size of USD 2,945.3 Million by 2032 growing at a CAGR of 11.4% from 2024 to 2032.
Sterility Indicators Market Highlights
- Global sterility indicators market revenue is poised to garner USD 2,945.3 million by 2032 with a CAGR of 11.4% from 2024 to 2032
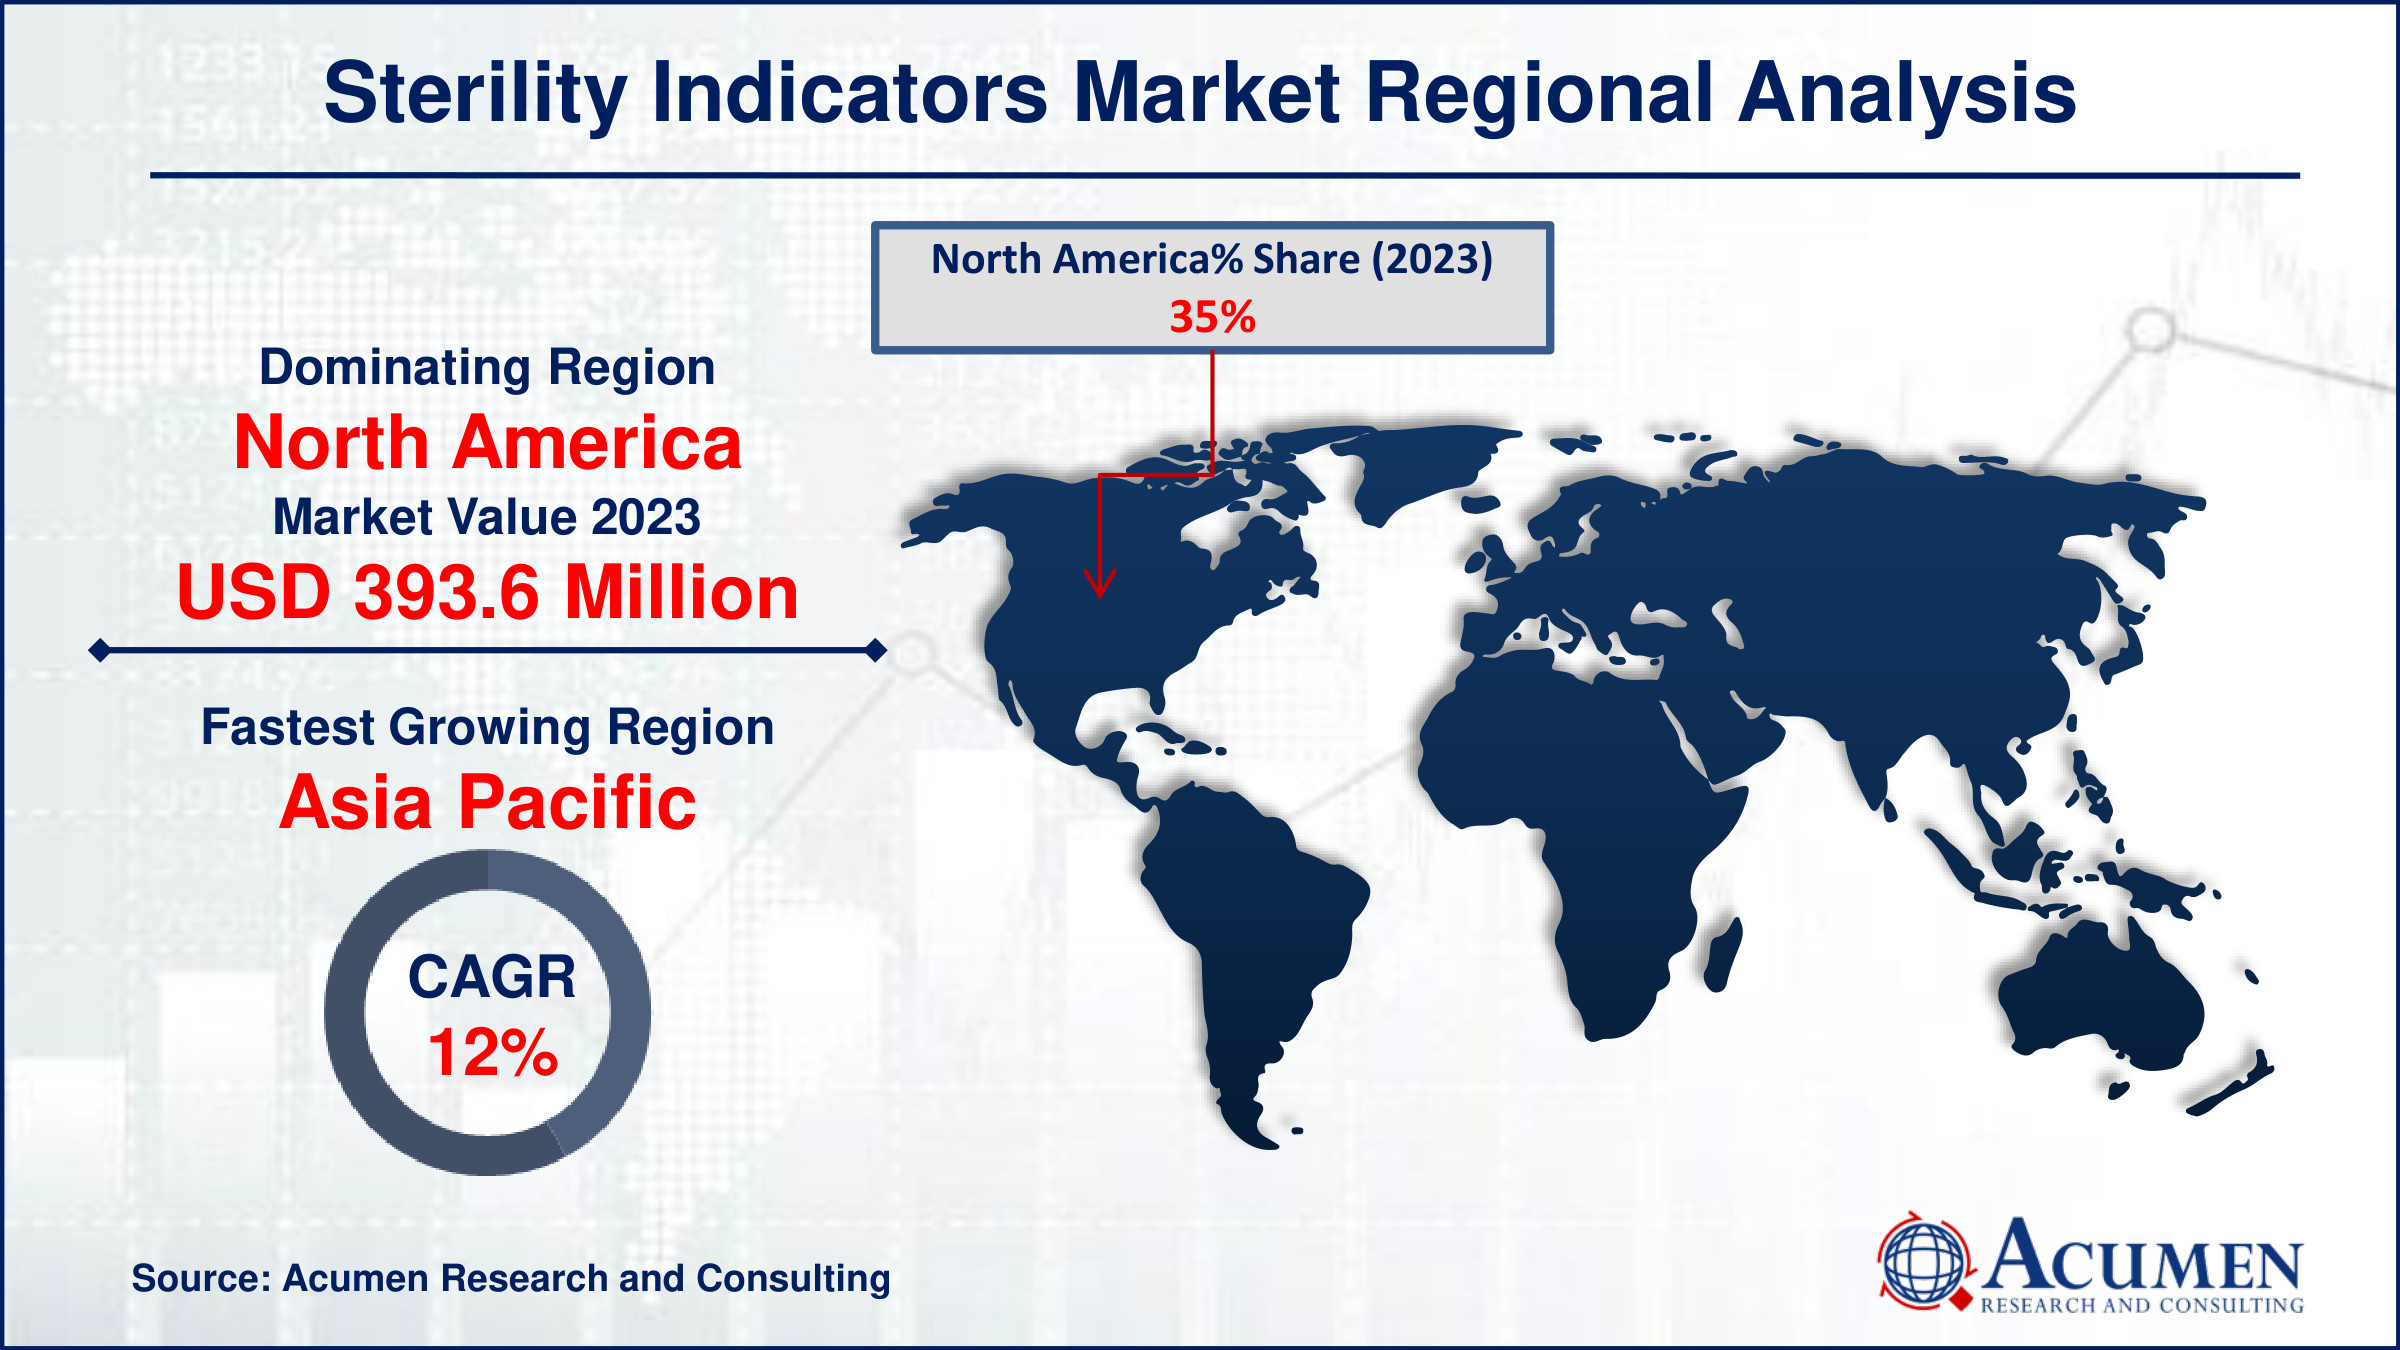
- North America sterility indicators market value occupied around USD 393.6 million in 2023
- Asia Pacific sterility indicators market growth will record a CAGR of more than 12% from 2024 to 2032
- Among type, the biological indicators sub-segment generated 60% of the market share in 2023
- Based on end users, the pharmaceutical companies sub-segment generated 25% of market share in 2023
- Growth of digital and connected sterility indicators to enhance real-time monitoring and compliance in healthcare settings is the sterility indicators market trend that fuels the industry demand

Sterility indicators are tools used to confirm the effectiveness of sterilization processes in medical and pharmaceutical settings. They typically change color or undergo a visible change when exposed to specific sterilization conditions such as heat, steam, or chemical agents. These indicators are crucial for ensuring that instruments, equipment, or packaging intended for sterile environments have indeed undergone proper sterilization. They serve as a visual or chemical indication that sterilization parameters have been met, offering reassurance of safety and efficacy in healthcare practices. Sterility indicators are applied to various items before sterilization, providing a quick and reliable means to verify the success of sterilization cycles without compromising sterility. Their use helps prevent infections and ensures compliance with stringent sterilization standards mandated by regulatory bodies.
Global Sterility Indicators Market Dynamics
Market Drivers
- Increasing demand for sterilization in healthcare facilities
- Stringent regulatory standards for sterilization procedures
- Rising incidence of hospital-acquired infections (HAIs)
Market Restraints
- High cost of advanced sterility indicators
- Limited awareness and adoption in developing regions
- Technical complexities and accuracy issues in some sterility indicators
Market Opportunities
- Growing pharmaceutical and biotechnology industries
- Technological advancements in sterility testing methods
- Expansion of healthcare infrastructure in emerging markets
Sterility Indicators Market Report Coverage
| Market | Sterility Indicators Market |
| Sterility Indicators Market Size 2022 | USD 1,124.7 Million |
| Sterility Indicators Market Forecast 2032 | USD 2,945.3 Million |
| Sterility Indicators Market CAGR During 2023 - 2032 | 11.4% |
| Sterility Indicators Market Analysis Period | 2020 - 2032 |
| Sterility Indicators Market Base Year |
2022 |
| Sterility Indicators Market Forecast Data | 2023 - 2032 |
| Segments Covered | By Type, By Technique, By End-User, And By Geography |
| Regional Scope | North America, Europe, Asia Pacific, Latin America, and Middle East & Africa |
| Key Companies Profiled | Getinge Group, Stryker Corporation, Sigma Aldrich, Cantel Medical Corp, 3M Company, Cardinal Health, Inc., Fortive Corporation, Propper Manufacturing Co., Inc, Matachana Group, MMM GROUP, Crosstex International, Inc., Mesa Laboratories, Inc., Noxilizer Inc, Steris plc, and Andersen Products, Inc. |
| Report Coverage |
Market Trends, Drivers, Restraints, Competitive Analysis, Player Profiling, Covid-19 Analysis, Regulation Analysis |
Sterility Indicators Market Insights
The rising need for sterilization in healthcare facilities is fueling the demand for sterility indicators. For instance, Contraceptive methods, sterilization procedures, and patient education and counseling approved by the Food and Drug Administration, as recommended by healthcare providers for women of reproductive age. Firstly, sterility indicators are essential in ensuring that sterilization processes are effective, thereby preventing infections and ensuring patient safety. As healthcare standards and regulations become more stringent, the adoption of sterility indicators is increasing. The growing number of surgical procedures and the emphasis on hygiene in healthcare environments further drive this demand. Consequently, the sterility indicators market is experiencing significant growth as healthcare providers prioritize sterility assurance.
The high cost of advanced sterility indicators significantly impacts the sterility indicators market by limiting accessibility for smaller healthcare facilities and laboratories. These advanced indicators, while offering superior accuracy and reliability, require substantial investment, which can strain budgets, particularly in developing regions. This financial barrier reduces the adoption rate, thereby slowing market growth. Additionally, the high costs can lead to a reliance on less effective, traditional methods, potentially compromising sterility assurance. As a result, the market faces a constraint in achieving widespread implementation and advancements.
The expanding pharmaceutical and biotechnology sectors drive demand for sterility indicators, essential for ensuring the sterility of products and processes. For instance, the Indian pharmaceutical industry holds a significant position in the global market. It is projected to achieve a market size of $65 billion by 2024 and is anticipated to double to $130 billion by 2030. With stringent regulations and quality standards, these industries require reliable sterility testing to prevent contamination. The growing production of medical devices, biologics, and pharmaceuticals boosts the need for sterility indicators. As innovations in drug development and manufacturing continue, the sterility indicators market sees significant growth opportunities. Enhanced focus on patient safety and product efficacy further propels market expansion.
Sterility Indicators Market Segmentation
The worldwide market for sterility indicators is split based on type, technique, end-user, and geography.
Sterility Indicator Market By Type
- Chemical Indicators
- Class 1
- Class 2
- Class 3
- Class 4
- Class 5
- Biological Indicators
- Spore Ampoules
- Spore Suspensions
- Self-containedVials
- Spore Strips
According to the sterility indicators industry analysis, biological indicators dominate the sterility indicators market due to their high reliability and accuracy in detecting viable microorganisms, ensuring comprehensive sterilization validation. These indicators use live spores, providing a true assessment of sterilization efficacy, crucial for industries like healthcare and pharmaceuticals. Technological advancements and stringent regulatory standards further drive their adoption. Consequently, their role in maintaining sterility and safety across various applications underscores their market leadership.
Sterility Indicator Market By Technique
- Heat Sterilization
- Low Temperature Sterilization
- Filtration Sterilization
- Radiation Sterilization
- Liquid Sterilization
The heat sterilization segment is expected to largest technique category in the sterility indicators market, due to its reliability and effectiveness in eliminating all forms of microbial life. This method uses high-pressure saturated steam to achieve sterilization, ensuring comprehensive decontamination. Its widespread adoption in healthcare and laboratory settings is driven by its ability to sterilize a variety of instruments and materials quickly and efficiently. Additionally, the robust and consistent results provided by heat sterilization make it the preferred choice over other methods such as chemical or radiation sterilization.
Sterility Indicator Market By End-user
- Hospitals
- Pharmaceutical Companies
- Medical device Companies
- Clinical laboratories/Research Centers
- Others
According to the sterility indicators industry analysis, pharmaceutical companies dominate market due to their stringent regulatory requirements and commitment to ensuring product safety and efficacy. These indicators are crucial in pharmaceutical manufacturing to verify sterilization processes and maintain product integrity. Companies invest significantly in advanced technologies and rigorous testing protocols to meet regulatory standards and customer expectations. This market dominance is driven by the pharmaceutical industry's emphasis on quality control and adherence to Good Manufacturing Practices (GMP), ensuring that only sterile products reach consumers, thereby safeguarding public health.
Sterility Indicators Market Regional Outlook
North America
- U.S.
- Canada
Europe
- U.K.
- Germany
- France
- Spain
- Rest of Europe
Asia-Pacific
- India
- Japan
- China
- Australia
- South Korea
- Rest of Asia-Pacific
Latin America
- Brazil
- Mexico
- Rest of Latin America
The Middle East & Africa
- South Africa
- GCC Countries
- Rest of the Middle East & Africa (ME&A)

Sterility Indicators Market Regional Analysis
For several reasons, North America's dominance in the sterility indicators market is driven by advanced healthcare infrastructure, high adoption of stringent sterilization standards, and significant investment in research and development. Additionally, the presence of key market players and increasing healthcare expenditure contribute to its leading position. For instance, according to American Medical Association healthcare spending in the U.S. rose by 4.1% in 2022, reaching $4.5 trillion, or approximately $13,493 per person. The region's robust pharmaceutical and medical device industries further fuel demand.
The Asia-Pacific region is the fastest-growing market for sterility indicators, driven by the rapid expansion of the pharmaceutical and biotechnology sectors. For instance, according to International Trade Administration, China's pharmaceutical market has been experiencing steady growth and is projected to reach $161.8 billion by 2023, capturing approximately 30% of the global market share. Increasing healthcare investments, rising awareness about sterilization importance, and stringent regulatory standards are boosting demand. Additionally, the growing number of surgeries and healthcare facilities, coupled with advancements in sterilization technologies, are further propelling market growth in this region.
Sterility Indicators Market Players
Some of the top sterility indicators companies offered in our report include Getinge Group, Stryker Corporation, Sigma Aldrich, Cantel Medical Corp, 3M Company, Cardinal Health, Inc., Fortive Corporation, Propper Manufacturing Co., Inc, Matachana Group, MMM GROUP, Crosstex International, Inc., Mesa Laboratories, Inc., Noxilizer Inc, Steris plc, and Andersen Products, Inc.
Frequently Asked Questions
How big is the sterility indicators market?
The sterility indicators market size was valued at USD 1,124.7 Million in 2023.
What is the CAGR of the global sterility indicators market from 2024 to 2032?
The CAGR of sterility indicators is 11.4% during the analysis period of 2024 to 2032.
Which are the key players in the sterility indicators market?
The key players operating in the global market are including Getinge Group, Stryker Corporation, Sigma Aldrich, Cantel Medical Corp, 3M Company, Cardinal Health, Inc., Fortive Corporation, Propper Manufacturing Co., Inc, Matachana Group, MMM GROUP, , Crosstex International, Inc., Mesa Laboratories, Inc., Noxilizer Inc, Steris plc, and Andersen Products, Inc.
Which region dominated the global sterility indicators market share?
North America held the dominating position in sterility indicators industry during the analysis period of 2024 to 2032.
Which region registered fastest CAGR from 2024 to 2032?
Asia Pacific region exhibited fastest growing CAGR for market of sterility indicators during the analysis period of 2024 to 2032.
What are the current trends and dynamics in the global sterility indicators industry?
The current trends and dynamics in the sterility indicators industry include increasing demand for sterilization in healthcare facilities, stringent regulatory standards for sterilization procedures, and rising incidence of hospital-acquired infections (HAIs).
Which type held the maximum share in 2023?
The biological indicators type held the maximum share of the sterility indicators industry.


