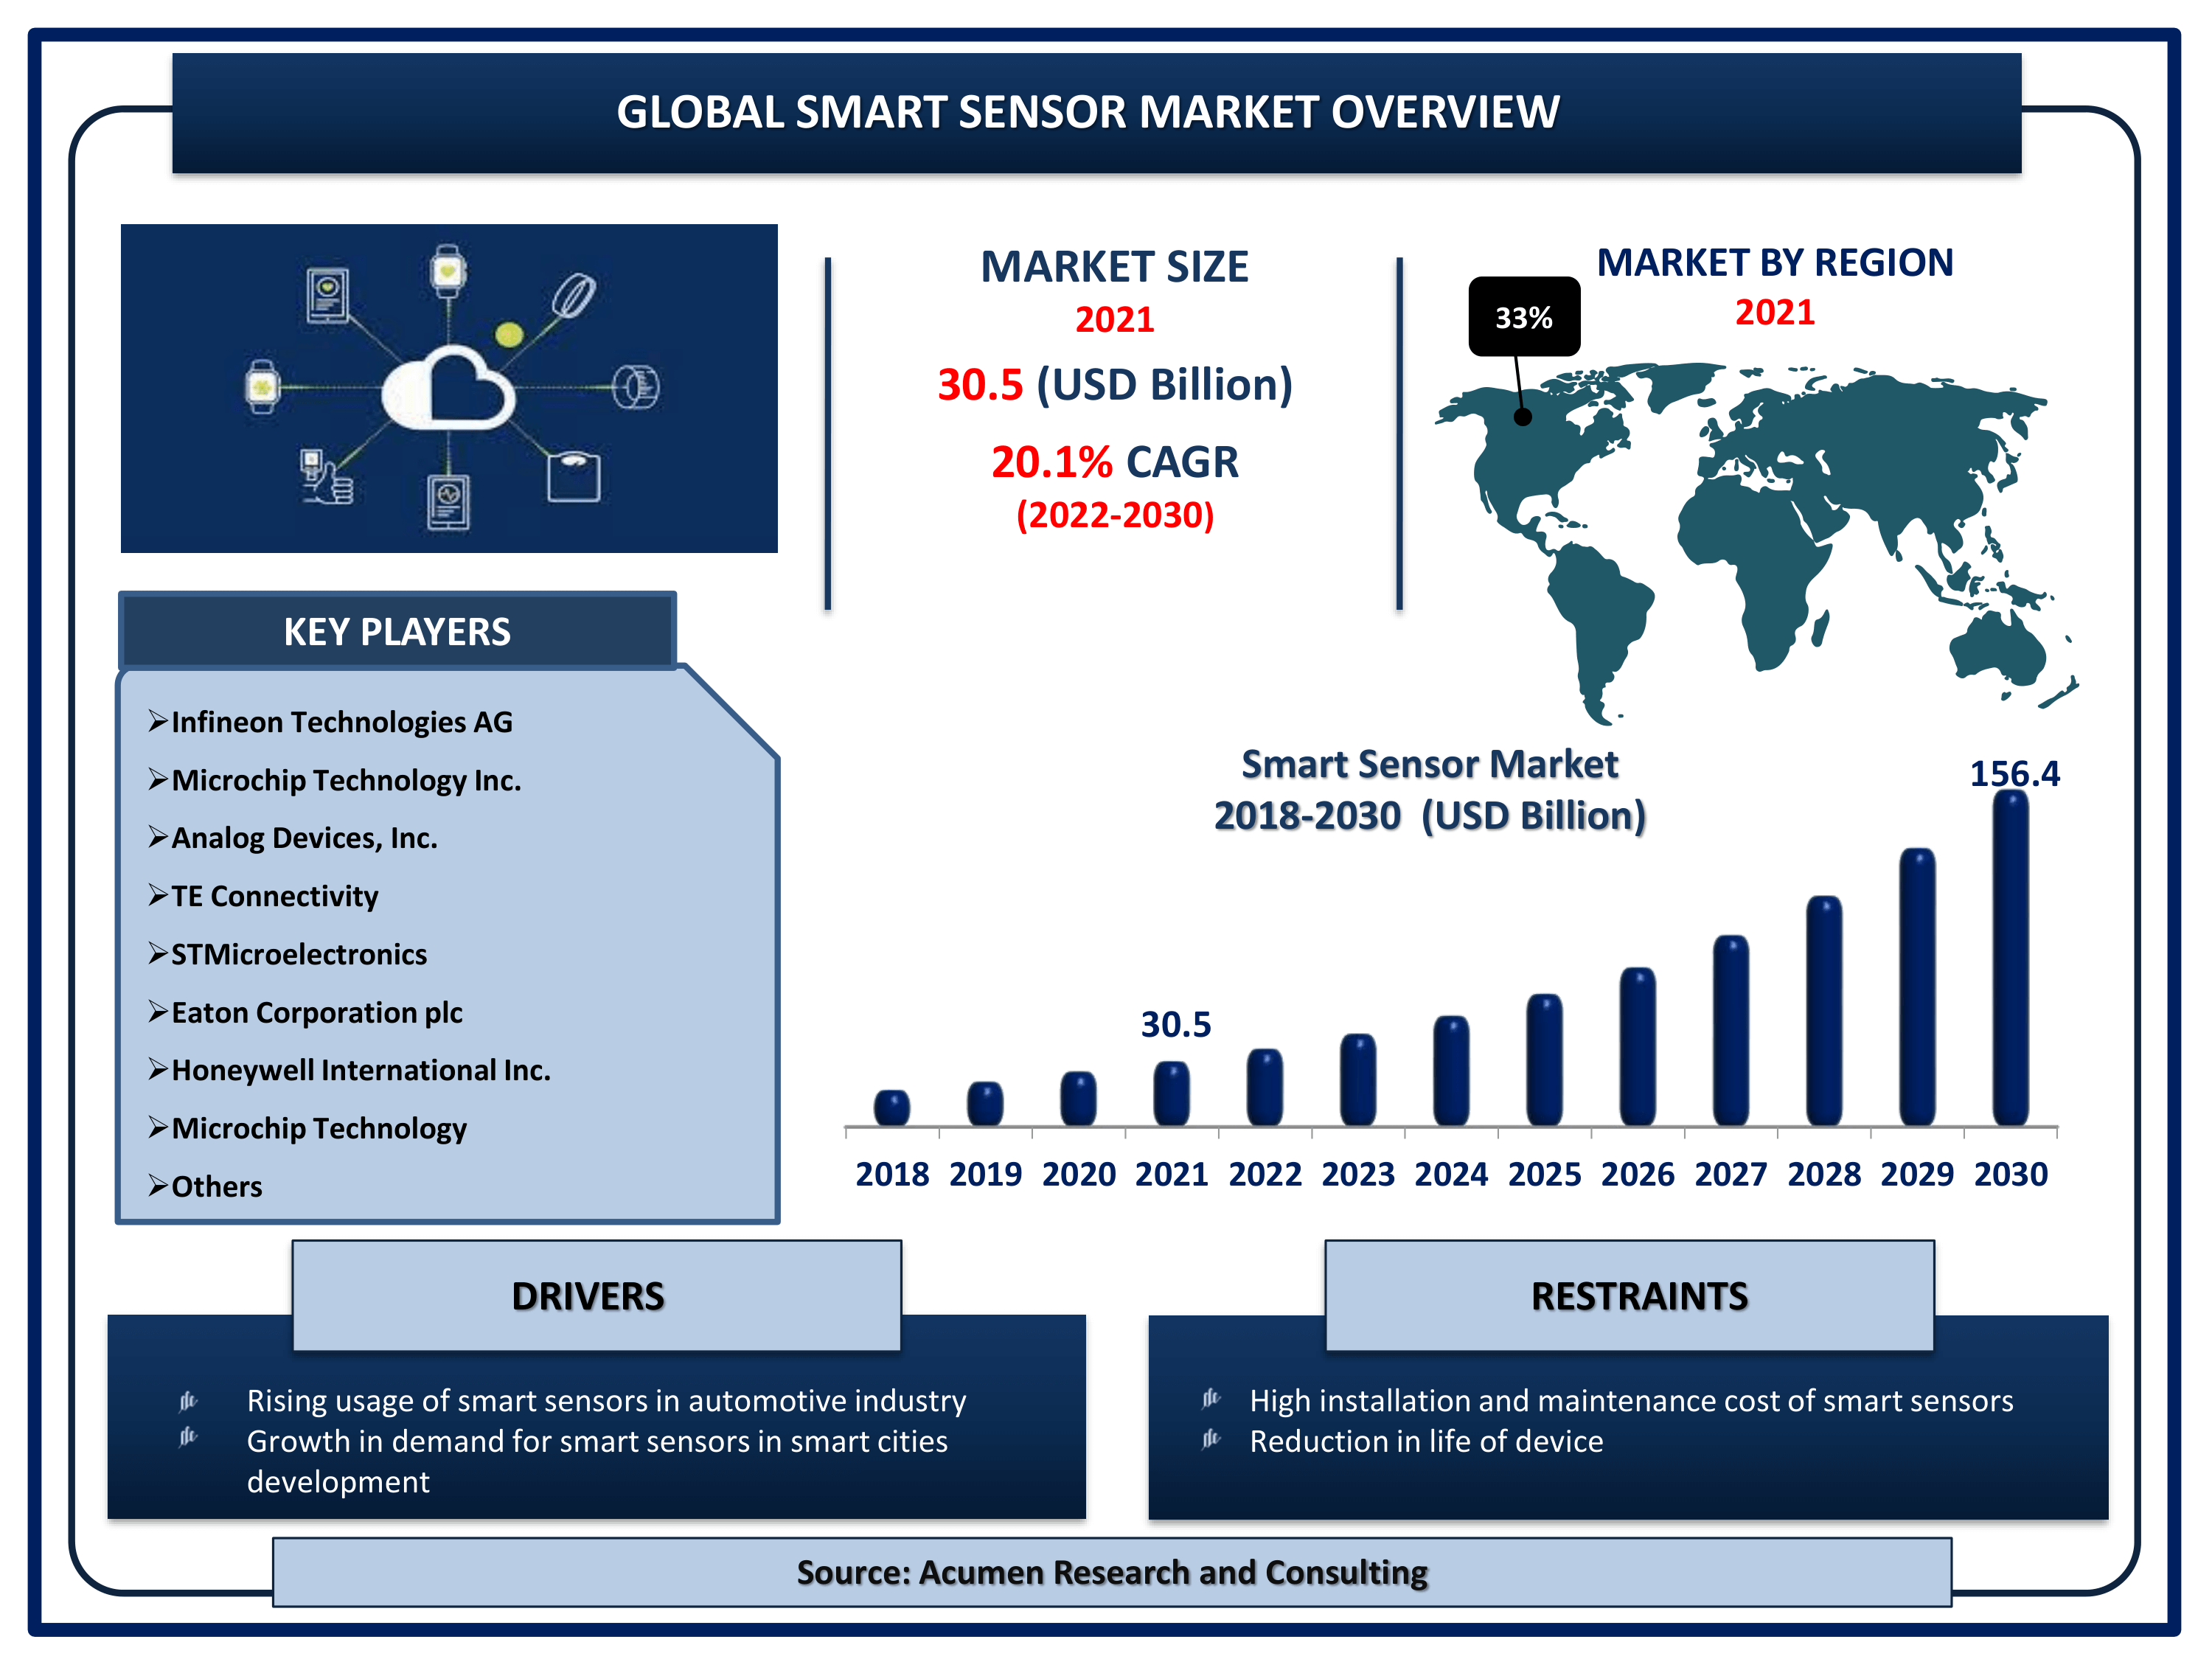
The Global Smart Sensor Market Size accounted for USD 30.5 Billion in 2021 and is projected to achieve a market size of USD 156.4 Billion by 2030 rising at a CAGR of 20.1% from 2022 to 2030. According to The Apache ADC Foundation, a smart sensor is a service (run by a built-in DAG) that significantly reduces Airflow infrastructure costs by combining multiple instances of small, lightweight Sensors into a single process. The main idea of the smart sensor service is to improve the efficiency of these long-running tasks by using centralized processes to execute those tasks in batches, rather than using one process for each task.
Smart Sensor Market Report Statistics
- Global smart sensor market revenue is estimated to reach USD 156.4 Billion by 2030 with a CAGR of 20.1% from 2022 to 2030 smart sensor
- North America smart sensor market share accounted for over 33% shares in 2021
- According to the our analysis, there were around 10 billion active IoT devices in the world in 2021
- Asia-Pacific smart sensor market growth will register fastest CAGR from 2022 to 2030
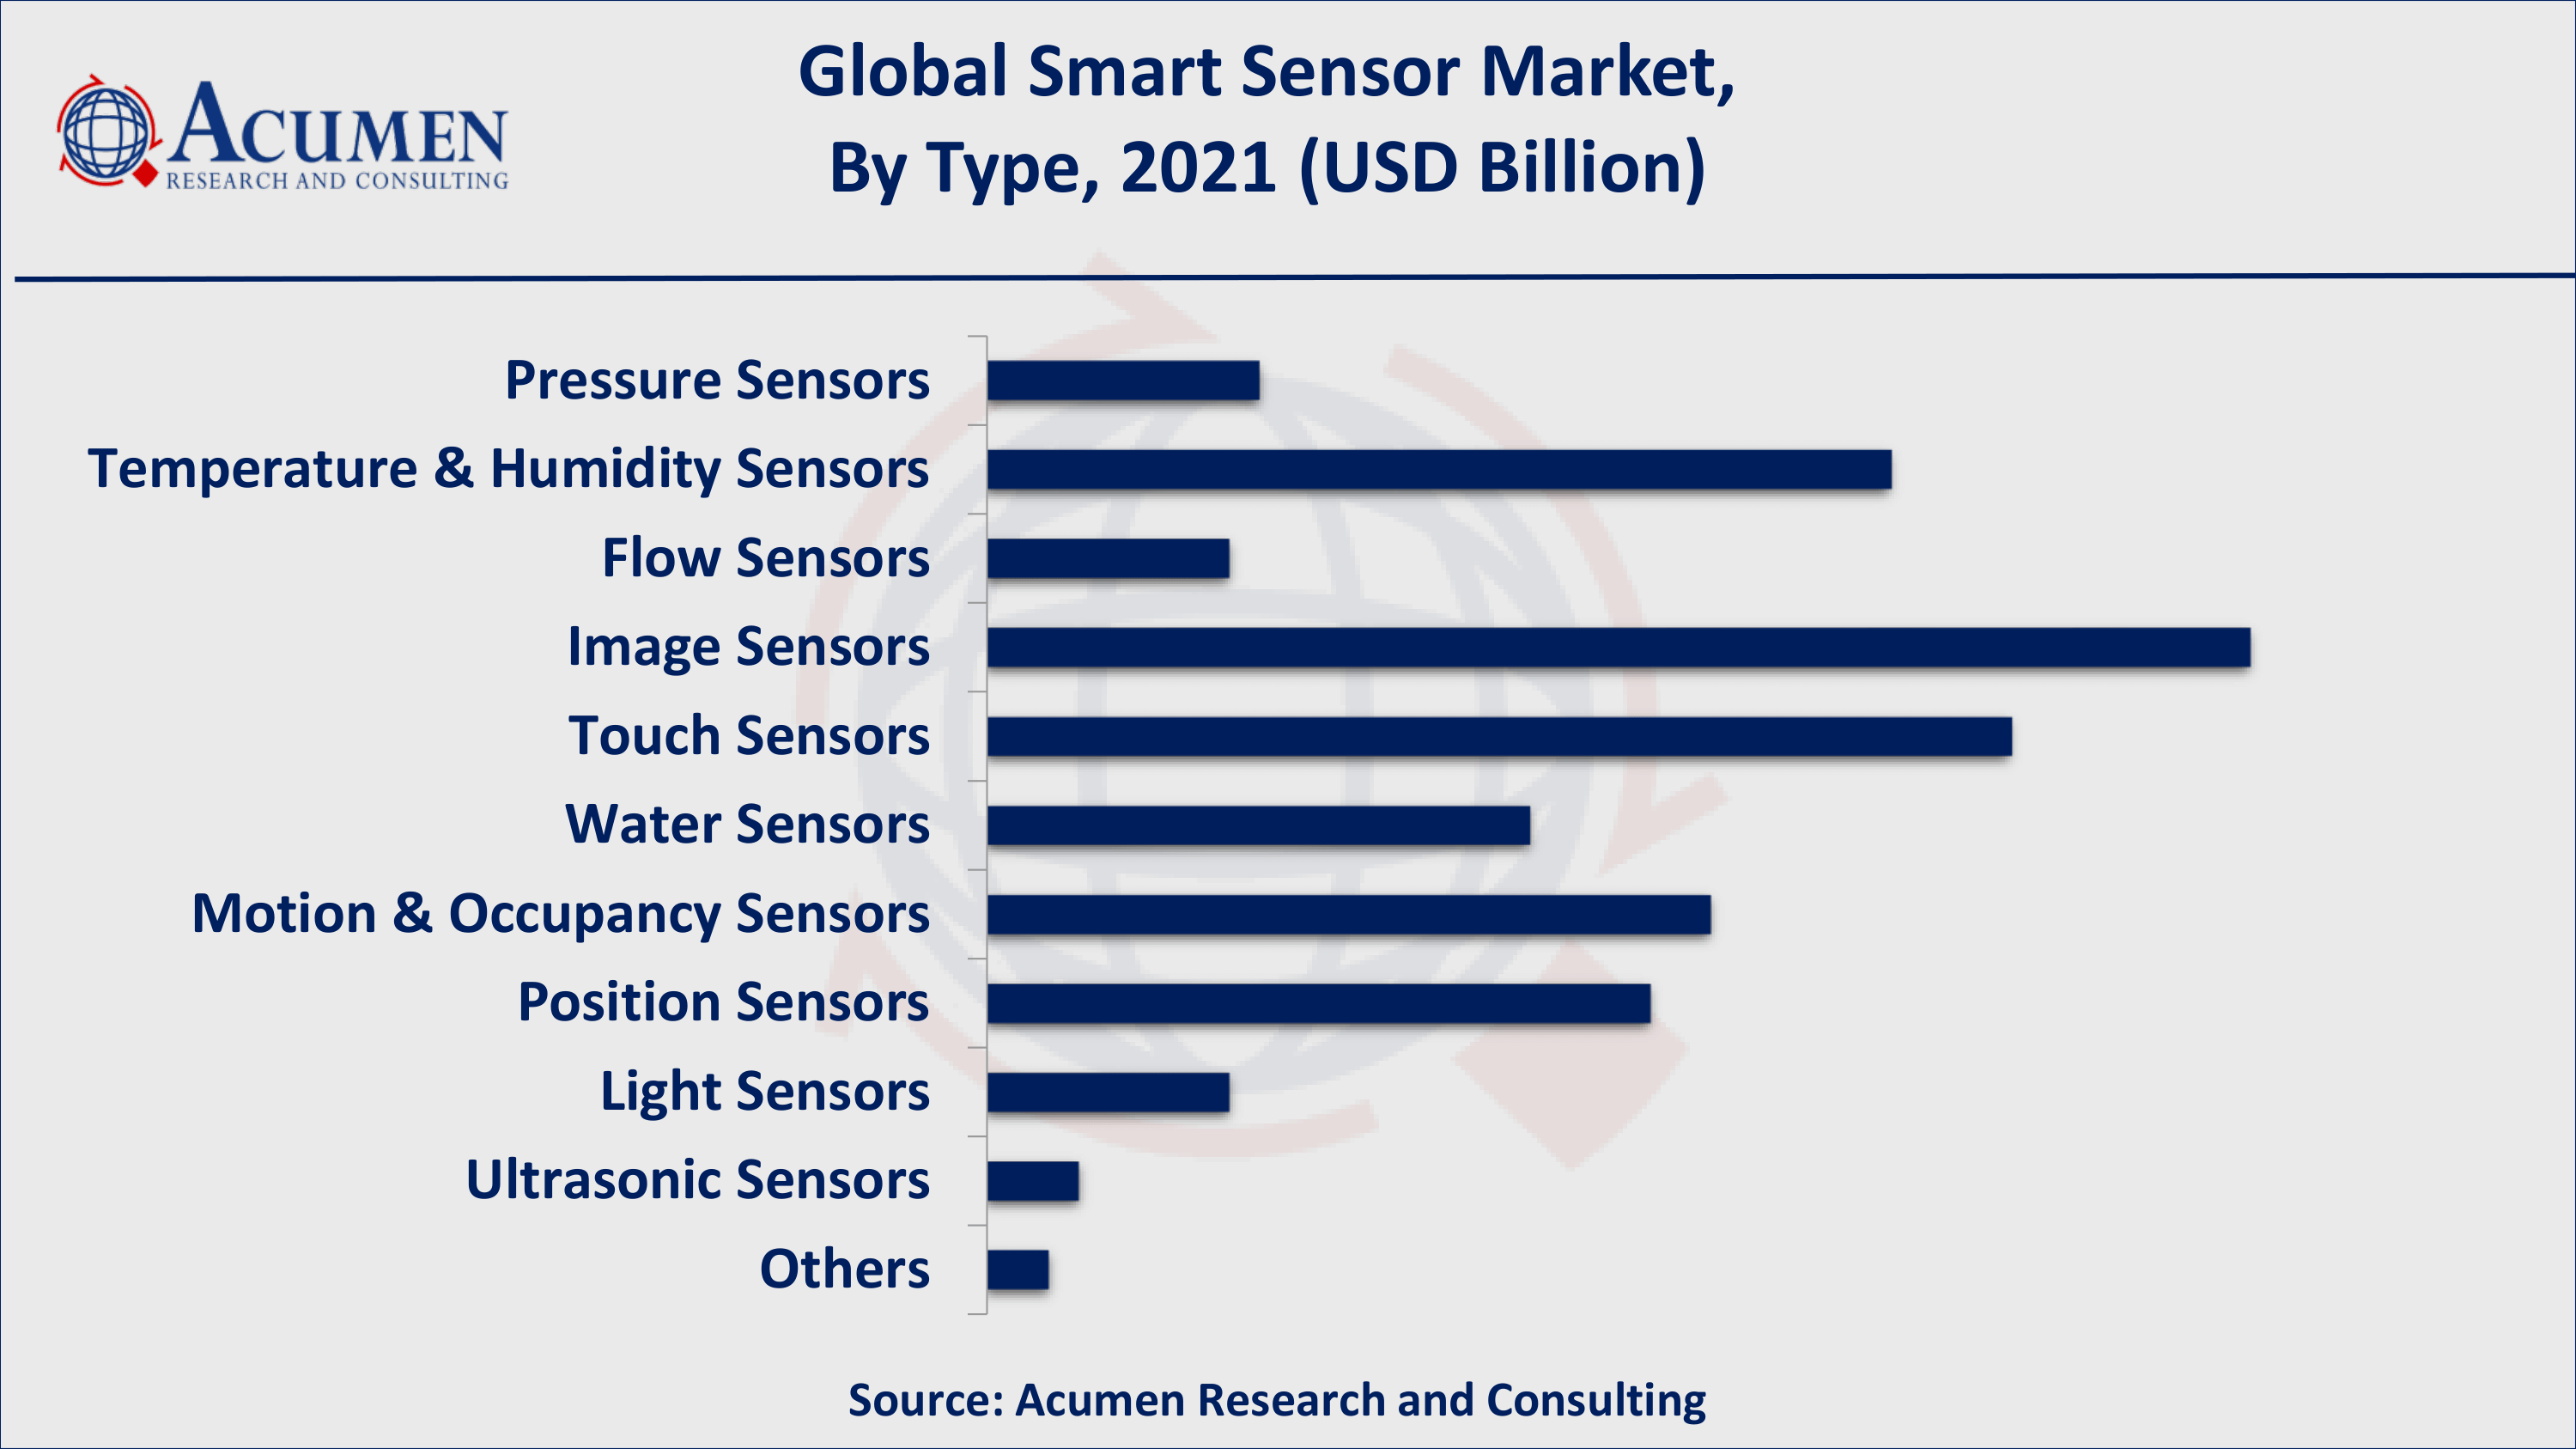
- Based on type, image sensor gathered over 20% of the overall market share in 2021
- Increasing demand for smart sensors in IoT-based devices will fuel the global smart sensor market value
- Growing miniaturization of sensors in wearables is a popular smart sensor market trend that is fueling the industry demand
COVID-19 has positive impact on smart sensors market
As energy costs continue to rise and environmental concerns persist around the world, there is increasing pressure for increased adoption of energy-saving and cost-effective solutions, particularly in smart buildings and cities. Technology will play a critical role in ensuring the safe return of businesses to their offices, particularly as lockdown restrictions ease. Automation of shared touch points such as door handles, elevators, and sanitary systems is a simple way to limit cross-contamination in shared office space. According to the ADJACENT DIGITAL POLITICS LTD report, technology can also be used to monitor hand soap and sanitizer bottle fill levels, monitor and alarm the mandatory two-meter distance between people using infrared beams, and analyze movement around the office and density in recreational areas using thermal imaging camera systems. Specialized equipment is also being used to take temperature readings of employees and visitors in order to detect high temperatures, which is a key indicator of COVID-19 positivity. Room sensors could be installed in offices to measure humidity and temperature levels and send alerts when the optimal conditions for virus multiplication are met, allowing for preventative measures to be taken.
Global Smart Sensor Market Dynamics
Market Drivers
- Increasing demand for consumer electronics and IoT-based devices
- Rising usage of smart sensors in automotive industry
- Growth in demand for smart sensors in smart cities development
- Rise in use of wireless technology
Market Restraints
- High installation and maintenance cost of smart sensors
- Reduction in life of device caused by smart sensors
Market Opportunities
- Government support to promote green building construction
- Surging adoption of wearables and increasing application in biomedical sector
Smart Sensor Market Report Coverage
Market |
Smart Sensor Market |
Smart Sensor Market Size 2021 |
USD 30.5 Billion |
Smart Sensor Market Forecast 2030 |
USD 156.4 Billion |
Smart Sensor Market CAGR During 2022 - 2030 |
20.1% |
Smart Sensor Market Analysis Period |
2018 - 2030 |
Smart Sensor Market Base Year |
2021 |
Smart Sensor Market Forecast Data |
2022 - 2030 |
Segments Covered |
By Type, By Component, By Technology, By Industry, By Connectivity, And By Geography
|
Regional Scope |
North America, Europe, Asia Pacific, Latin America, and Middle East & Africa |
Key Companies Profiled |
Infineon Technologies AG, Microchip Technology Inc., Analog Devices, Inc., TE Connectivity, STMicroelectronics, Eaton Corporation plc, Honeywell International Inc., Microchip Technology, NXP Semiconductors, Robert Bosch GmbH, and Siemens AG among others. |
Report Coverage
|
Market Trends, Drivers, Restraints, Competitive Analysis, Player Profiling, Regulation Analysis |
Market Dynamics
Smart sensors mean energy savings; R&D has 100% gains in the global market
According to the ACEEE report, smart sensors installed in buildings save energy by automating controls and optimizing systems. This can result in energy savings of 5-15% when smart sensors are installed. Furthermore, smart sensors installed in buildings by incorporating such integrated systems can account for 30-50% of savings in buildings that would otherwise be inefficient. The purchase price, energy savings, and payback time of smart technologies vary depending on the type of technology. BAS installation, for example, is more cost effective when installed in larger buildings. Thus, the wireless capability of smart controls and smart sensors makes them a user-friendly retrofit choice for installation.
Additionally, The DOE Pacific Northwest National Laboratory (PNNL) in 2017 considered a broader set of smart energy efficiency measures, finding that integrating smart sensors and controls throughout the commercial building stock has the potential to save as much as 29% of building energy consumption through high-performance sequencing of operations, optimizing settings based on occupancy patterns, and detecting and diagnosing inadequate equipment operation and installation problems.
Big calls for “smart sensors” in development of smart cities majorly drive the growth of global market
Smart cities are proving to be an excellent model for researching the suitability of sensor-based monitoring instruments. According to a report published by downtoearth.org, smart cities - much-needed platforms for on-field use and evaluation of sensor-based technology - are projects launched in 2015 by the Union Ministry of Housing and Urban Affairs (MoHUA) under the Smart Cities Mission (SCM). Smart sensors improve traffic flow, transportation efficiency, and solid waste collection routes; mobile applications allow citizens to report problems in real time and interact directly with city Microcontroller. Low-cost mobile messaging, telemedicine, and video-consultations improve health outcomes and lower healthcare costs, while self-driving cars and car-sharing platforms relieve pressure on land use according to the statistics released by the OECD 2019. Furthermore, it can have a significant impact on the local job market; for example, new ways of delivering public Microcontroller may provide opportunities for start-ups, Biomedical & Healthcare, and consultancies related to digital innovation, as well as attract skilled workers.
Smart Sensor Market Segmentation
The worldwide smart sensor market is split based on type, component, technology, industry, connectivity, and geography.
According to our smart sensor market forecast, temperature and humidity sensors are expected to grow significantly in the coming years. Temperature sensors that are smart are widely used in measurement control systems and instrumentation. Temperature sensors provide an interpretable temperature reading in a digital format that can be used in a variety of applications including healthcare, automotive, and building automation. Such factors contribute to the expansion of the global intelligent sensors market.
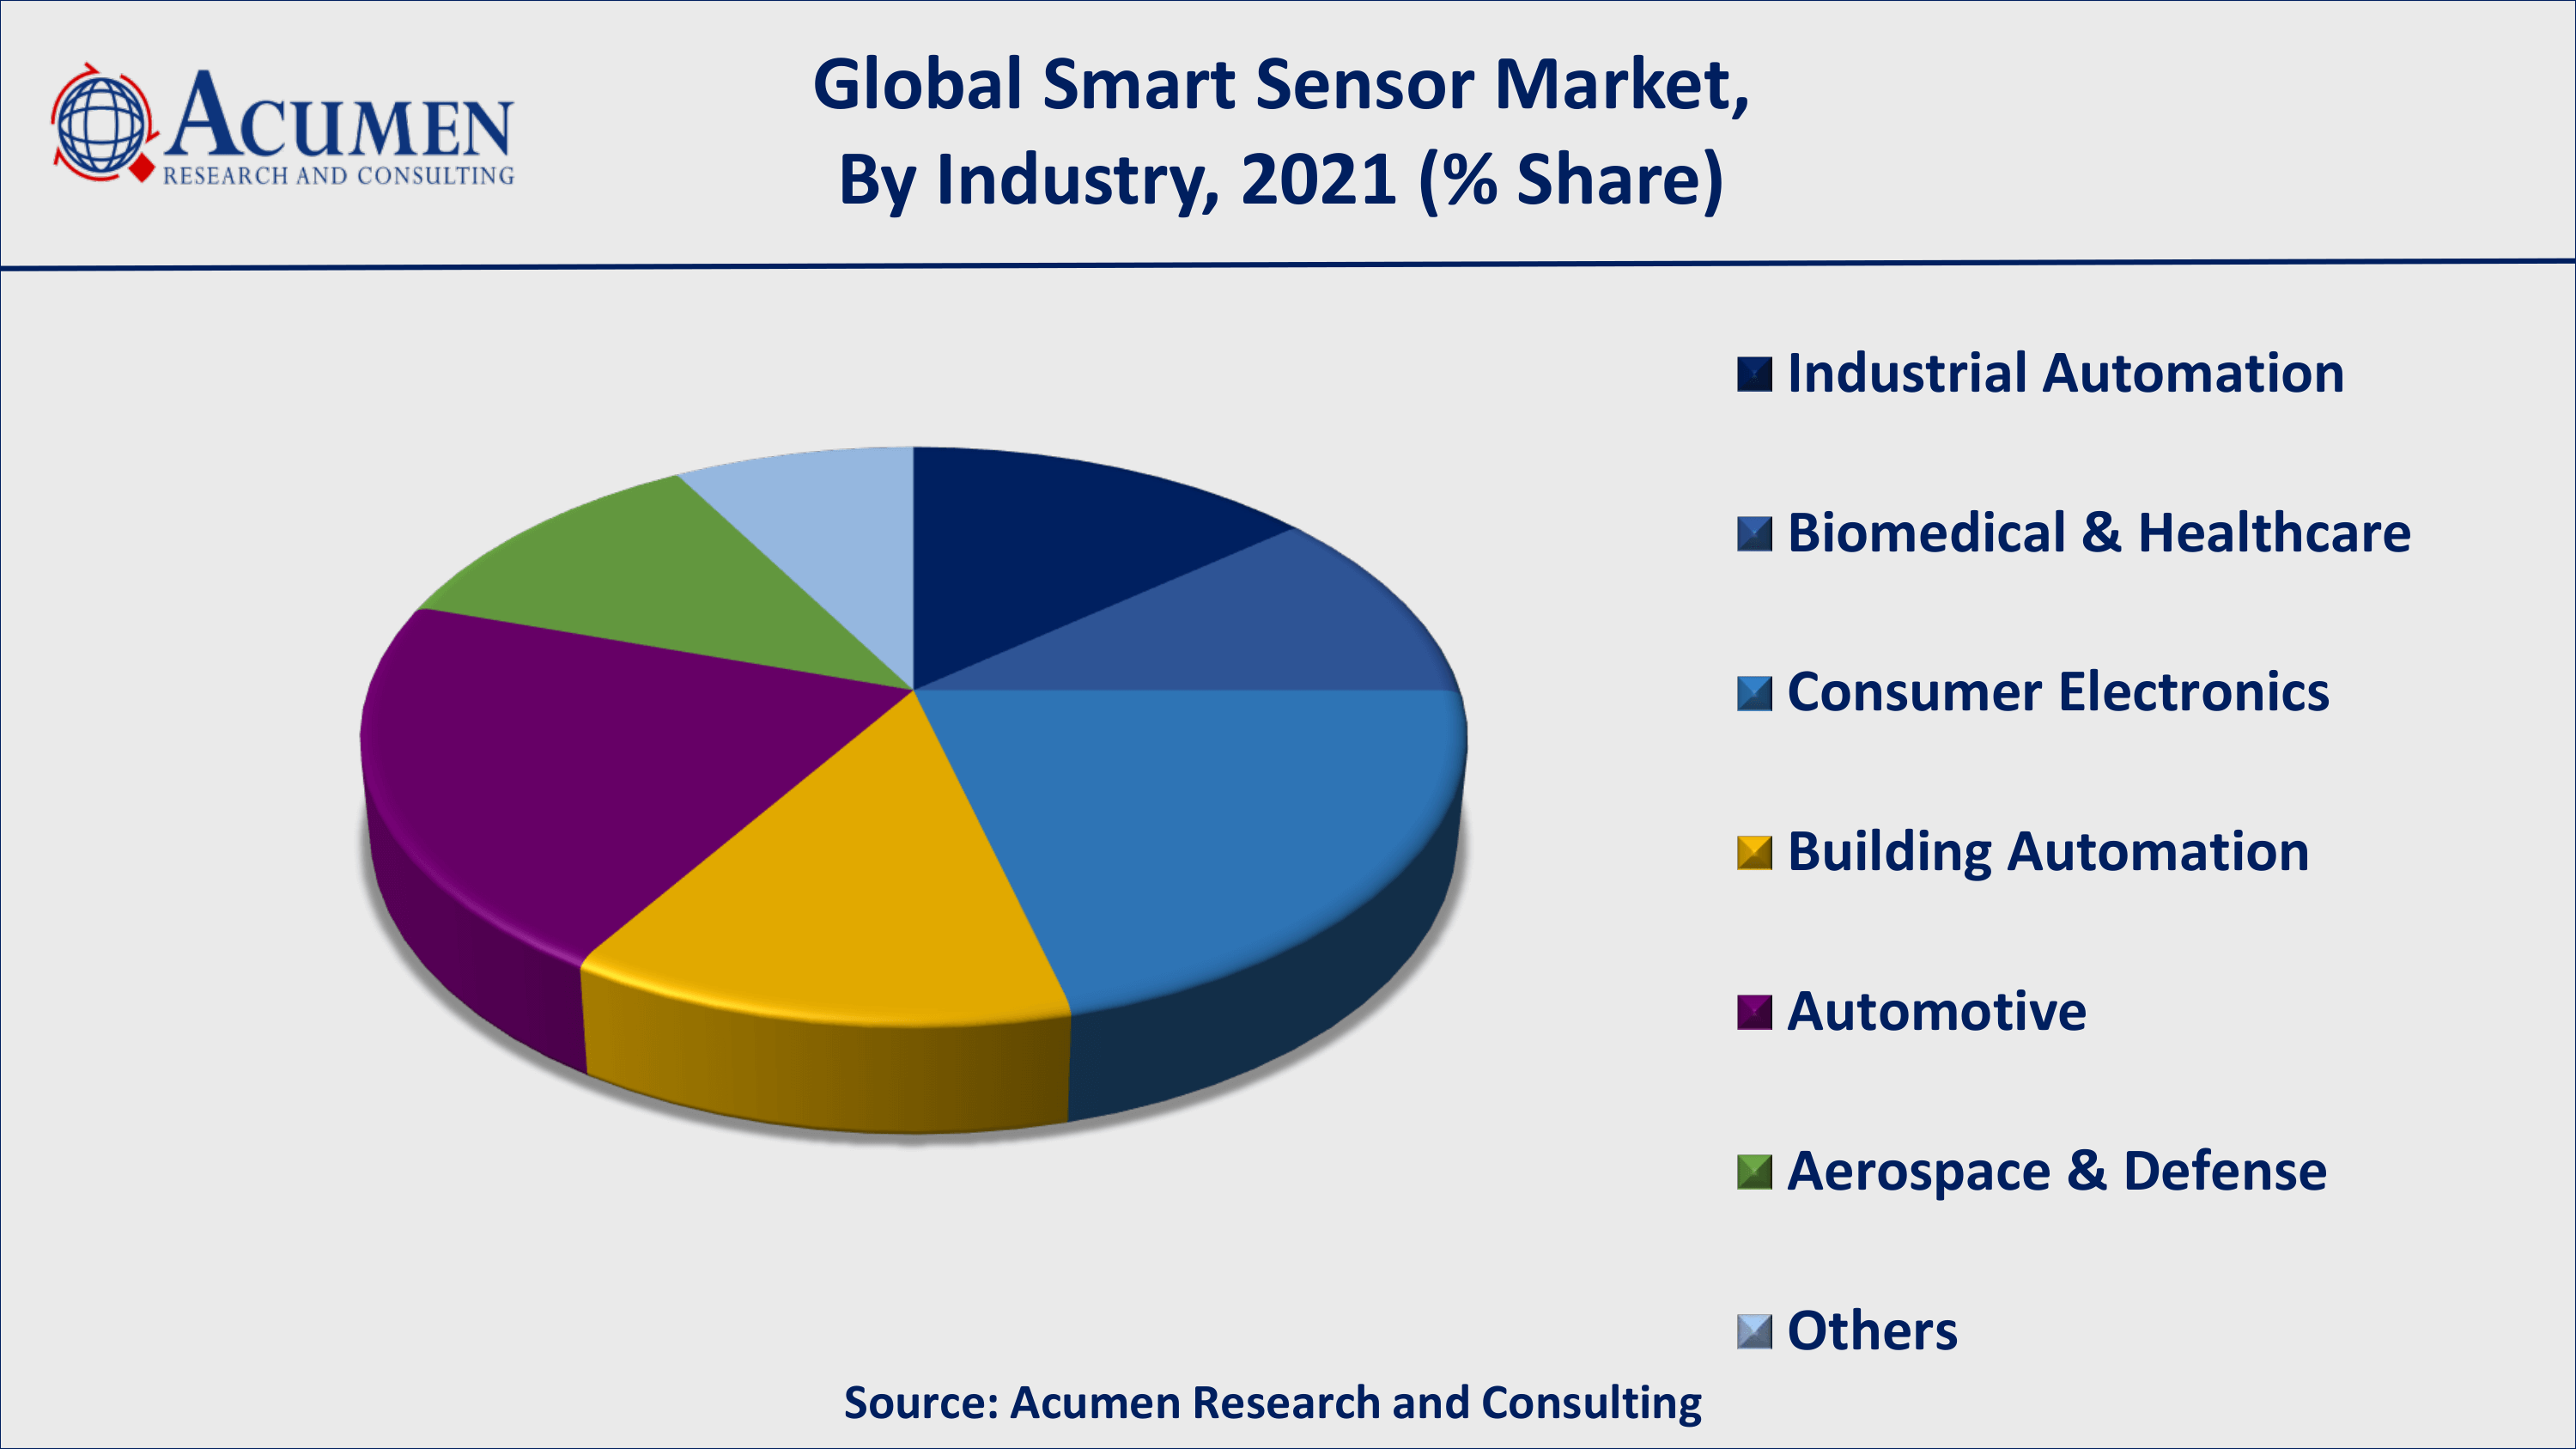
According to the smart sensor industry analysis, consumer electronics is growing at an exponential rate and will continue to do so throughout the forecast period. As consumers become more technologically savvy, the adoption of advanced technology is increasing at a rapid pace. As a result, many smart cities have taken the first step toward installing smart sensors in buildings. With the advancement of technology, it now provides tangible benefits to an ever-increasing consumer base. The installation of such smart sensors is cost-effective, simple to deploy, and requires less maintenance. This outcome will result in significant benefits, including improvements to energy use, hyper-efficiency, and automated operational purposes, resulting in both energy and cost savings.
Smart Sensor Market By Type
- Pressure Sensors
- Temperature & Humidity Sensors
- Flow Sensors
- Image Sensors
- Touch Sensors
- Water Sensors
- Motion & Occupancy Sensors
- Position Sensors Light Sensors
- Ultrasonic Sensors
- Others
Smart Sensor Market By Component
- ADC
- Microcontroller
- Transceivers
- Amplifier
- DAC
- Others
Smart Sensor Market By Technology
Smart Sensor Market By Industry
- Industrial Automation
- Biomedical & Healthcare
- Consumer Electronics
- Building Automation
- Automotive
- Aerospace & Defense
- Others
Smart Sensor Market By Connectivity
Smart Sensor Market Regional Outlook
North America
Europe
- U.K.
- Germany
- France
- Spain
- Rest of Europe
Asia-Pacific
- India
- Japan
- China
- Australia
- South Korea
- Rest of Asia-Pacific
Latin America
- Brazil
- Mexico
- Rest of Latin America
The Middle East & Africa
- South Africa
- GCC Countries
- Rest of the Middle East & Africa (ME&A)
Smart Sensor Market Regional Analysis
Asia-Pacific Region to Grow At a Highest CAGR for the Smart Sensor Market
Asia-Pacific is expected to have the fastest growing CAGR and to maintain its dominance throughout the forecast period. Rising technological adoptions, combined with the government's increased emphasis on infrastructure development, will drive demand for smart sensors in this region even higher. India is expected to be the fastest growing market for smart and intelligent sensors in APAC during the forecast period. India is one of the world's fastest developing countries, with the government heavily investing in advanced technologies and smarter infrastructure. With such rapid advancements, sensors in the country are finding widespread use in smart phones, automobiles, and healthcare, among other areas.
Smart Sensor Market Players
The prominent players of the global smart sensor market involve Infineon Technologies AG, Microchip Technology Inc., Analog Devices, Inc., TE Connectivity, STMicroelectronics, Eaton Corporation plc, Honeywell International Inc., Microchip Technology, NXP Semiconductors, Robert Bosch GmbH, and Siemens AG among others.
CHAPTER 1. Industry Overview of Smart Sensor Market
1.1. Definition and Scope
1.1.1. Definition of Smart Sensor
1.1.2. Market Segmentation
1.1.3. Years Considered for the Study
1.1.4. Assumptions and Acronyms Used
1.1.4.1. Market Assumptions and Market Forecast
1.1.4.2. Acronyms Used in Global Smart Sensor Market
1.2. Summary
1.2.1. Executive Summary
1.2.2. Smart Sensor Market By Type
1.2.3. Smart Sensor Market By Component
1.2.4. Smart Sensor Market By Technology
1.2.5. Smart Sensor Market By Industry
1.2.6. Smart Sensor Market By Connectivity
1.2.7. Smart Sensor Market By Region
CHAPTER 2. Research Approach
2.1. Methodology
2.1.1. Research Programs
2.1.2. Market Size Estimation
2.1.3. Market Breakdown and Data Triangulation
2.2. Data Source
2.2.1. Secondary Sources
2.2.2. Primary Sources
CHAPTER 3. Market Dynamics And Competition Analysis
3.1. Market Drivers
3.1.1. Driver 1
3.1.2. Driver 2
3.2. Restraints and Challenges
3.2.1. Restraint 1
3.2.2. Restraint 2
3.3. Growth Opportunities
3.3.1. Opportunity 1
3.3.2. Opportunity 2
3.4. Porter’s Five Forces Analysis
3.4.1. Bargaining Power of Suppliers
3.4.2. Bargaining Power of Buyers
3.4.3. Threat of Substitute
3.4.4. Threat of New Entrants
3.4.5. Degree of Competition
3.5. Market Concentration Ratio and Market Maturity Analysis of Smart Sensor Market
3.5.1. Go To Market Strategy
3.5.1.1. Introduction
3.5.1.2. Growth
3.5.1.3. Maturity
3.5.1.4. Saturation
3.5.1.5. Possible Development
3.6. Technological Roadmap for Smart Sensor Market
3.7. Value Chain Analysis
3.7.1. List of Key Manufacturers
3.7.2. List of Customers
3.7.3. Level of Integration
3.8. Cost Structure Analysis
3.8.1. Price Trend of Key Raw Materials
3.8.2. Raw Material Suppliers
3.8.3. Proportion of Manufacturing Cost Structure
3.8.3.1. Raw Material
3.8.3.2. Labor Cost
3.8.3.3. Manufacturing Expense
3.9. Regulatory Compliance
3.10. Competitive Landscape, 2021
3.10.1. Player Positioning Analysis
3.10.2. Key Strategies Adopted By Leading Players
CHAPTER 4. Manufacturing Plant Analysis
4.1. Manufacturing Plant Location and Establish Date of Major Manufacturers in 2021
4.2. R&D Status of Major Manufacturers in 2021
CHAPTER 5. Smart Sensor Market By Type
5.1. Introduction
5.2. Smart Sensor Revenue By Type
5.2.1. Smart Sensor Revenue (USD Billion) and Forecast, By Type, 2018-2030
5.2.2. Pressure Sensors
5.2.2.1. Pressure Sensors Market Revenue (USD Billion) and Growth Rate (%), 2018-2030
5.2.3. Temperature & Humidity Sensors
5.2.3.1. Temperature & Humidity Sensors Market Revenue (USD Billion) and Growth Rate (%), 2018-2030
5.2.4. Light Sensors
5.2.4.1. Light Sensors Market Revenue (USD Billion) and Growth Rate (%), 2018-2030
5.2.5. Flow Sensors
5.2.5.1. Flow Sensors Market Revenue (USD Billion) and Growth Rate (%), 2018-2030
5.2.6. Image Sensors
5.2.6.1. Image Sensors Market Revenue (USD Billion) and Growth Rate (%), 2018-2030
5.2.7. Touch Sensors
5.2.7.1. Touch Sensors Market Revenue (USD Billion) and Growth Rate (%), 2018-2030
5.2.8. Water Sensors
5.2.8.1. Water Sensors Market Revenue (USD Billion) and Growth Rate (%), 2018-2030
5.2.9. Motion & Occupancy Sensors
5.2.9.1. Motion & Occupancy Sensors Market Revenue (USD Billion) and Growth Rate (%), 2018-2030
5.2.10. Position Sensors
5.2.10.1. Position Sensors Market Revenue (USD Billion) and Growth Rate (%), 2018-2030
5.2.11. Ultrasonic Sensors
5.2.11.1. Ultrasonic Sensors Market Revenue (USD Billion) and Growth Rate (%), 2018-2030
5.2.12. Others
5.2.12.1. Others Market Revenue (USD Billion) and Growth Rate (%), 2018-2030
CHAPTER 6. Smart Sensor Market By Component
6.1. Introduction
6.2. Smart Sensor Revenue By Component
6.2.1. Smart Sensor Revenue (USD Billion) and Forecast, By Component, 2018-2030
6.2.2. ADC
6.2.2.1. ADC Market Revenue (USD Billion) and Growth Rate (%), 2018-2030
6.2.3. Microcontroller
6.2.3.1. Microcontroller Market Revenue (USD Billion) and Growth Rate (%), 2018-2030
6.2.4. Transceivers
6.2.4.1. Transceivers Market Revenue (USD Billion) and Growth Rate (%), 2018-2030
6.2.5. Amplifier
6.2.5.1. Amplifier Market Revenue (USD Billion) and Growth Rate (%), 2018-2030
6.2.6. DAC
6.2.6.1. DAC Market Revenue (USD Billion) and Growth Rate (%), 2018-2030
6.2.7. Others
6.2.7.1. Others Market Revenue (USD Billion) and Growth Rate (%), 2018-2030
CHAPTER 7. Smart Sensor Market By Technology
7.1. Introduction
7.2. Smart Sensor Revenue By Technology
7.2.1. Smart Sensor Revenue (USD Billion) and Forecast, By Technology, 2018-2030
7.2.2. CMOS
7.2.2.1. CMOS Market Revenue (USD Billion) and Growth Rate (%), 2018-2030
7.2.3. MEMS
7.2.3.1. MEMS Market Revenue (USD Billion) and Growth Rate (%), 2018-2030
7.2.4. Others
7.2.4.1. Others Market Revenue (USD Billion) and Growth Rate (%), 2018-2030
CHAPTER 8. Smart Sensor Market By Industry
8.1. Introduction
8.2. Smart Sensor Revenue By Industry
8.2.1. Smart Sensor Revenue (USD Billion) and Forecast, By Industry, 2018-2030
8.2.2. Industrial Automation
8.2.2.1. Industrial Automation Market Revenue (USD Billion) and Growth Rate (%), 2018-2030
8.2.3. Biomedical & Healthcare
8.2.3.1. Biomedical & Healthcare Market Revenue (USD Billion) and Growth Rate (%), 2018-2030
8.2.4. Consumer Electronics
8.2.4.1. Consumer Electronics Market Revenue (USD Billion) and Growth Rate (%), 2018-2030
8.2.5. Automotive
8.2.5.1. Automotive Market Revenue (USD Billion) and Growth Rate (%), 2018-2030
8.2.6. Aerospace & Defense
8.2.6.1. Aerospace & Defense Market Revenue (USD Billion) and Growth Rate (%), 2018-2030
8.2.7. Building Automation
8.2.7.1. Building Automation Market Revenue (USD Billion) and Growth Rate (%), 2018-2030
8.2.8. Others
8.2.8.1. Others Market Revenue (USD Billion) and Growth Rate (%), 2018-2030
CHAPTER 9. Smart Sensor Market By Connectivity
9.1. Introduction
9.2. Smart Sensor Revenue By Connectivity
9.2.1. Smart Sensor Revenue (USD Billion) and Forecast, By Connectivity, 2018-2030
9.2.2. Wired
9.2.2.1. Wired Market Revenue (USD Billion) and Growth Rate (%), 2018-2030
9.2.3. Wireless
9.2.3.1. Wireless Market Revenue (USD Billion) and Growth Rate (%), 2018-2030
CHAPTER 10. North America Smart Sensor Market By Country
10.1. North America Smart Sensor Market Overview
10.2. U.S.
10.2.1. U.S. Smart Sensor Revenue (USD Billion) and Forecast By Type, 2018-2030
10.2.2. U.S. Smart Sensor Revenue (USD Billion) and Forecast By Component, 2018-2030
10.2.3. U.S. Smart Sensor Revenue (USD Billion) and Forecast By Technology, 2018-2030
10.2.4. U.S. Smart Sensor Revenue (USD Billion) and Forecast By Industry, 2018-2030
10.2.5. U.S. Smart Sensor Revenue (USD Billion) and Forecast By Connectivity, 2018-2030
10.3. Canada
10.3.1. Canada Smart Sensor Revenue (USD Billion) and Forecast By Type, 2018-2030
10.3.2. Canada Smart Sensor Revenue (USD Billion) and Forecast By Component, 2018-2030
10.3.3. Canada Smart Sensor Revenue (USD Billion) and Forecast By Technology, 2018-2030
10.3.4. Canada Smart Sensor Revenue (USD Billion) and Forecast By Industry, 2018-2030
10.3.5. Canada Smart Sensor Revenue (USD Billion) and Forecast By Connectivity, 2018-2030
10.4. North America PEST Analysis
CHAPTER 11. Europe Smart Sensor Market By Country
11.1. Europe Smart Sensor Market Overview
11.2. U.K.
11.2.1. U.K. Smart Sensor Revenue (USD Billion) and Forecast By Type, 2018-2030
11.2.2. U.K. Smart Sensor Revenue (USD Billion) and Forecast By Component, 2018-2030
11.2.3. U.K. Smart Sensor Revenue (USD Billion) and Forecast By Technology, 2018-2030
11.2.4. U.K. Smart Sensor Revenue (USD Billion) and Forecast By Industry, 2018-2030
11.2.5. U.K. Smart Sensor Revenue (USD Billion) and Forecast By Connectivity, 2018-2030
11.3. Germany
11.3.1. Germany Smart Sensor Revenue (USD Billion) and Forecast By Type, 2018-2030
11.3.2. Germany Smart Sensor Revenue (USD Billion) and Forecast By Component, 2018-2030
11.3.3. Germany Smart Sensor Revenue (USD Billion) and Forecast By Technology, 2018-2030
11.3.4. Germany Smart Sensor Revenue (USD Billion) and Forecast By Industry, 2018-2030
11.3.5. Germany Smart Sensor Revenue (USD Billion) and Forecast By Connectivity, 2018-2030
11.4. France
11.4.1. France Smart Sensor Revenue (USD Billion) and Forecast By Type, 2018-2030
11.4.2. France Smart Sensor Revenue (USD Billion) and Forecast By Component, 2018-2030
11.4.3. France Smart Sensor Revenue (USD Billion) and Forecast By Technology, 2018-2030
11.4.4. France Smart Sensor Revenue (USD Billion) and Forecast By Industry, 2018-2030
11.4.5. France Smart Sensor Revenue (USD Billion) and Forecast By Connectivity, 2018-2030
11.5. Spain
11.5.1. Spain Smart Sensor Revenue (USD Billion) and Forecast By Type, 2018-2030
11.5.2. Spain Smart Sensor Revenue (USD Billion) and Forecast By Component, 2018-2030
11.5.3. Spain Smart Sensor Revenue (USD Billion) and Forecast By Technology, 2018-2030
11.5.4. Spain Smart Sensor Revenue (USD Billion) and Forecast By Industry, 2018-2030
11.5.5. Spain Smart Sensor Revenue (USD Billion) and Forecast By Connectivity, 2018-2030
11.6. Rest of Europe
11.6.1. Rest of Europe Smart Sensor Revenue (USD Billion) and Forecast By Type, 2018-2030
11.6.2. Rest of Europe Smart Sensor Revenue (USD Billion) and Forecast By Component, 2018-2030
11.6.3. Rest of Europe Smart Sensor Revenue (USD Billion) and Forecast By Technology, 2018-2030
11.6.4. Rest of Europe Smart Sensor Revenue (USD Billion) and Forecast By Industry, 2018-2030
11.6.5. Rest of Europe Smart Sensor Revenue (USD Billion) and Forecast By Connectivity, 2018-2030
11.7. Europe PEST Analysis
CHAPTER 12. Asia Pacific Smart Sensor Market By Country
12.1. Asia Pacific Smart Sensor Market Overview
12.2. China
12.2.1. China Smart Sensor Revenue (USD Billion) and Forecast By Type, 2018-2030
12.2.2. China Smart Sensor Revenue (USD Billion) and Forecast By Component, 2018-2030
12.2.3. China Smart Sensor Revenue (USD Billion) and Forecast By Technology, 2018-2030
12.2.4. China Smart Sensor Revenue (USD Billion) and Forecast By Industry, 2018-2030
12.2.5. China Smart Sensor Revenue (USD Billion) and Forecast By Connectivity, 2018-2030
12.3. Japan
12.3.1. Japan Smart Sensor Revenue (USD Billion) and Forecast By Type, 2018-2030
12.3.2. Japan Smart Sensor Revenue (USD Billion) and Forecast By Component, 2018-2030
12.3.3. Japan Smart Sensor Revenue (USD Billion) and Forecast By Technology, 2018-2030
12.3.4. Japan Smart Sensor Revenue (USD Billion) and Forecast By Industry, 2018-2030
12.3.5. Japan Smart Sensor Revenue (USD Billion) and Forecast By Connectivity, 2018-2030
12.4. India
12.4.1. India Smart Sensor Revenue (USD Billion) and Forecast By Type, 2018-2030
12.4.2. India Smart Sensor Revenue (USD Billion) and Forecast By Component, 2018-2030
12.4.3. India Smart Sensor Revenue (USD Billion) and Forecast By Technology, 2018-2030
12.4.4. India Smart Sensor Revenue (USD Billion) and Forecast By Industry, 2018-2030
12.4.5. India Smart Sensor Revenue (USD Billion) and Forecast By Connectivity, 2018-2030
12.5. Australia
12.5.1. Australia Smart Sensor Revenue (USD Billion) and Forecast By Type, 2018-2030
12.5.2. Australia Smart Sensor Revenue (USD Billion) and Forecast By Component, 2018-2030
12.5.3. Australia Smart Sensor Revenue (USD Billion) and Forecast By Technology, 2018-2030
12.5.4. Australia Smart Sensor Revenue (USD Billion) and Forecast By Industry, 2018-2030
12.5.5. Australia Smart Sensor Revenue (USD Billion) and Forecast By Connectivity, 2018-2030
12.6. South Korea
12.6.1. South Korea Smart Sensor Revenue (USD Billion) and Forecast By Type, 2018-2030
12.6.2. South Korea Smart Sensor Revenue (USD Billion) and Forecast By Component, 2018-2030
12.6.3. South Korea Smart Sensor Revenue (USD Billion) and Forecast By Technology, 2018-2030
12.6.4. South Korea Smart Sensor Revenue (USD Billion) and Forecast By Industry, 2018-2030
12.6.5. South Korea Smart Sensor Revenue (USD Billion) and Forecast By Connectivity, 2018-2030
12.7. Rest of Asia-Pacific
12.7.1. Rest of Asia-Pacific Smart Sensor Revenue (USD Billion) and Forecast By Type, 2018-2030
12.7.2. Rest of Asia-Pacific Smart Sensor Revenue (USD Billion) and Forecast By Component, 2018-2030
12.7.3. Rest of Asia-Pacific Smart Sensor Revenue (USD Billion) and Forecast By Technology, 2018-2030
12.7.4. Rest of Asia-Pacific Smart Sensor Revenue (USD Billion) and Forecast By Industry, 2018-2030
12.7.5. Rest of Asia-Pacific Smart Sensor Revenue (USD Billion) and Forecast By Connectivity, 2018-2030
12.8. Asia Pacific PEST Analysis
CHAPTER 13. Latin America Smart Sensor Market By Country
13.1. Latin America Smart Sensor Market Overview
13.2. Brazil
13.2.1. Brazil Smart Sensor Revenue (USD Billion) and Forecast By Type, 2018-2030
13.2.2. Brazil Smart Sensor Revenue (USD Billion) and Forecast By Component, 2018-2030
13.2.3. Brazil Smart Sensor Revenue (USD Billion) and Forecast By Technology, 2018-2030
13.2.4. Brazil Smart Sensor Revenue (USD Billion) and Forecast By Industry, 2018-2030
13.2.5. Brazil Smart Sensor Revenue (USD Billion) and Forecast By Connectivity, 2018-2030
13.3. Mexico
13.3.1. Mexico Smart Sensor Revenue (USD Billion) and Forecast By Type, 2018-2030
13.3.2. Mexico Smart Sensor Revenue (USD Billion) and Forecast By Component, 2018-2030
13.3.3. Mexico Smart Sensor Revenue (USD Billion) and Forecast By Technology, 2018-2030
13.3.4. Mexico Smart Sensor Revenue (USD Billion) and Forecast By Industry, 2018-2030
13.3.5. Mexico Smart Sensor Revenue (USD Billion) and Forecast By Connectivity, 2018-2030
13.4. Rest of Latin America
13.4.1. Rest of Latin America Smart Sensor Revenue (USD Billion) and Forecast By Type, 2018-2030
13.4.2. Rest of Latin America Smart Sensor Revenue (USD Billion) and Forecast By Component, 2018-2030
13.4.3. Rest of Latin America Smart Sensor Revenue (USD Billion) and Forecast By Technology, 2018-2030
13.4.4. Rest of Latin America Smart Sensor Revenue (USD Billion) and Forecast By Industry, 2018-2030
13.4.5. Rest of Latin America Smart Sensor Revenue (USD Billion) and Forecast By Connectivity, 2018-2030
13.5. Latin America PEST Analysis
CHAPTER 14. Middle East & Africa Smart Sensor Market By Country
14.1. Middle East & Africa Smart Sensor Market Overview
14.2. GCC
14.2.1. GCC Smart Sensor Revenue (USD Billion) and Forecast By Type, 2018-2030
14.2.2. GCC Smart Sensor Revenue (USD Billion) and Forecast By Component, 2018-2030
14.2.3. GCC Smart Sensor Revenue (USD Billion) and Forecast By Technology, 2018-2030
14.2.4. GCC Smart Sensor Revenue (USD Billion) and Forecast By Industry, 2018-2030
14.2.5. GCC Smart Sensor Revenue (USD Billion) and Forecast By Connectivity, 2018-2030
14.3. South Africa
14.3.1. South Africa Smart Sensor Revenue (USD Billion) and Forecast By Type, 2018-2030
14.3.2. South Africa Smart Sensor Revenue (USD Billion) and Forecast By Component, 2018-2030
14.3.3. South Africa Smart Sensor Revenue (USD Billion) and Forecast By Technology, 2018-2030
14.3.4. South Africa Smart Sensor Revenue (USD Billion) and Forecast By Industry, 2018-2030
14.3.5. South Africa Smart Sensor Revenue (USD Billion) and Forecast By Connectivity, 2018-2030
14.4. Rest of Middle East & Africa
14.4.1. Rest of Middle East & Africa Smart Sensor Revenue (USD Billion) and Forecast By Type, 2018-2030
14.4.2. Rest of Middle East & Africa Smart Sensor Revenue (USD Billion) and Forecast By Component, 2018-2030
14.4.3. Rest of Middle East & Africa Smart Sensor Revenue (USD Billion) and Forecast By Technology, 2018-2030
14.4.4. Rest of Middle East & Africa Smart Sensor Revenue (USD Billion) and Forecast By Industry, 2018-2030
14.4.5. Rest of Middle East & Africa Smart Sensor Revenue (USD Billion) and Forecast By Connectivity, 2018-2030
14.5. Middle East & Africa PEST Analysis
CHAPTER 15. Player Analysis Of Smart Sensor Market
15.1. Smart Sensor Market Company Share Analysis
15.2. Competition Matrix
15.2.1. Competitive Benchmarking of key players by price, presence, market share, and R&D investment
15.2.2. New Product Launches and Product Enhancements
15.2.3. Mergers And Acquisition In Global Smart Sensor Market
15.2.4. Partnership, Joint Ventures and Strategic Alliances/ Sales Agreements
CHAPTER 16. Company Profile
16.1. Infineon Technologies AG
16.1.1. Company Snapshot
16.1.2. Business Overview
16.1.3. Financial Overview
16.1.3.1. Revenue (USD Billion), 2021
16.1.3.2. Infineon Technologies AG 2021 Smart Sensor Business Regional Distribution
16.1.4. Product /Service and Specification
16.1.5. Recent Developments & Business Strategy
16.2. Microchip Technology Inc.
16.3. Analog Devices, Inc.
16.4. TE Connectivity
16.5. STMicroelectronics
16.6. Eaton Corporation plc
16.7. Honeywell International Inc.
16.8. Microchip Technology
16.9. NXP Semiconductors
16.10. Robert Bosch GmbH
16.11. Siemens AG