Smart Manufacturing Market Size - Global Industry, Share, Analysis, Trends and Forecast 2023 - 2032
Published :
Report ID:
Pages :
Format :
Smart Manufacturing Market Size - Global Industry, Share, Analysis, Trends and Forecast 2023 - 2032
Report Coverage
- Industry Dynamics
- Market Size and Forecast Data
- Segment Analysis
- Competitive Landscape
- Regional Analysis with a Niche Focus on Country-Level Data
- High Level Analysis - Porter's, PESTEL, Value Chain, etc.
- Company Profiles of Key Players
- Option to Customize the Report As Per Your Specific Need
Request Sample Report
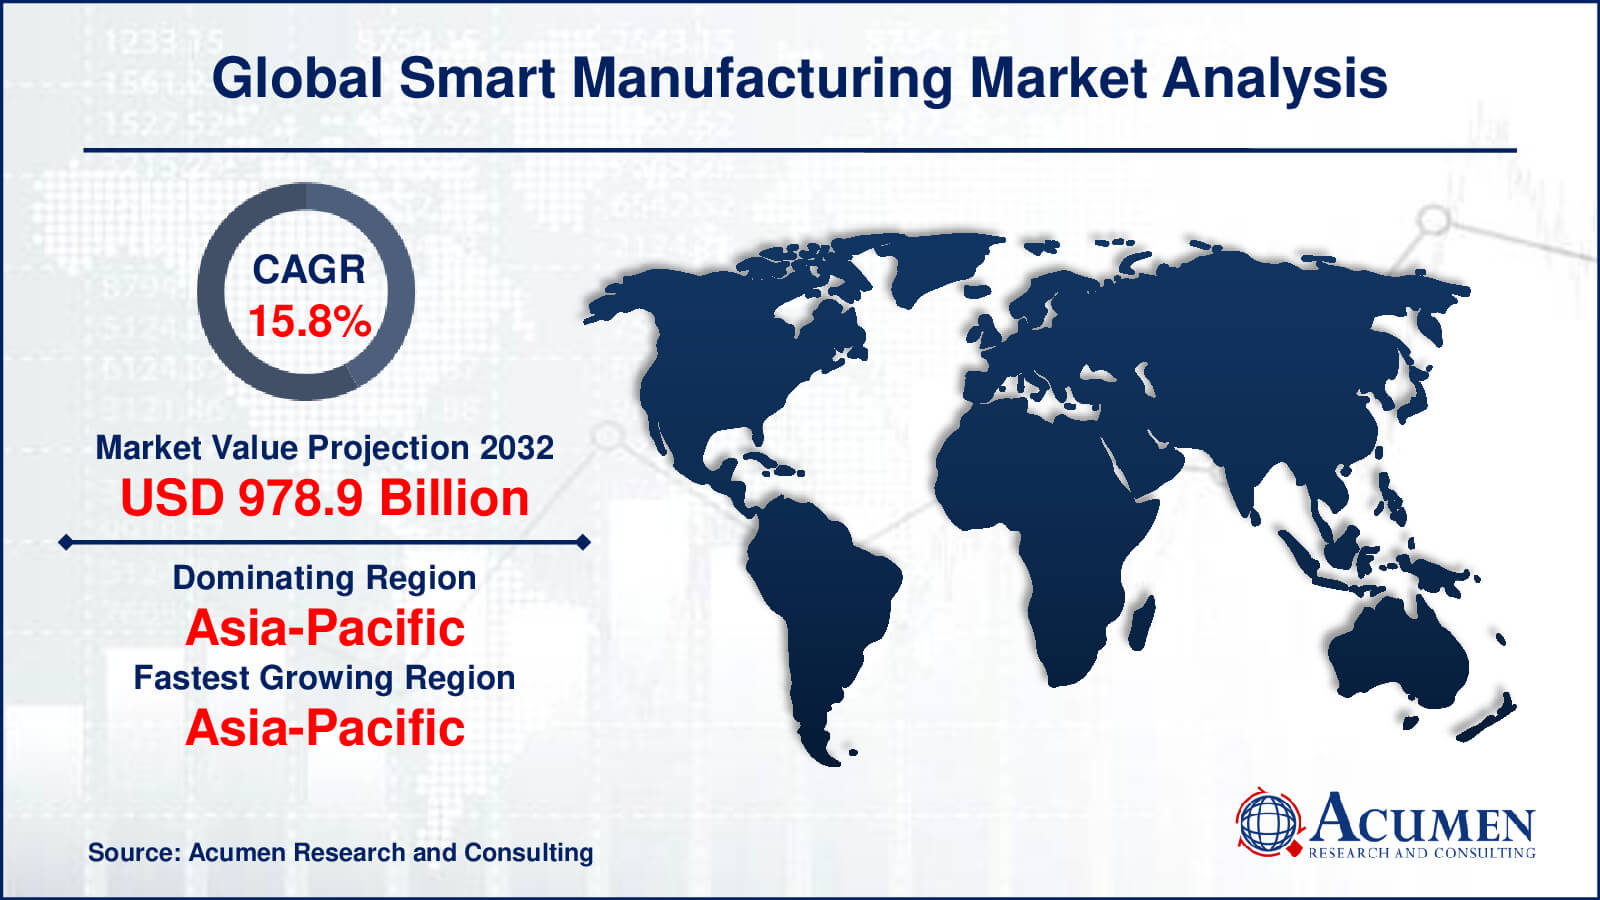
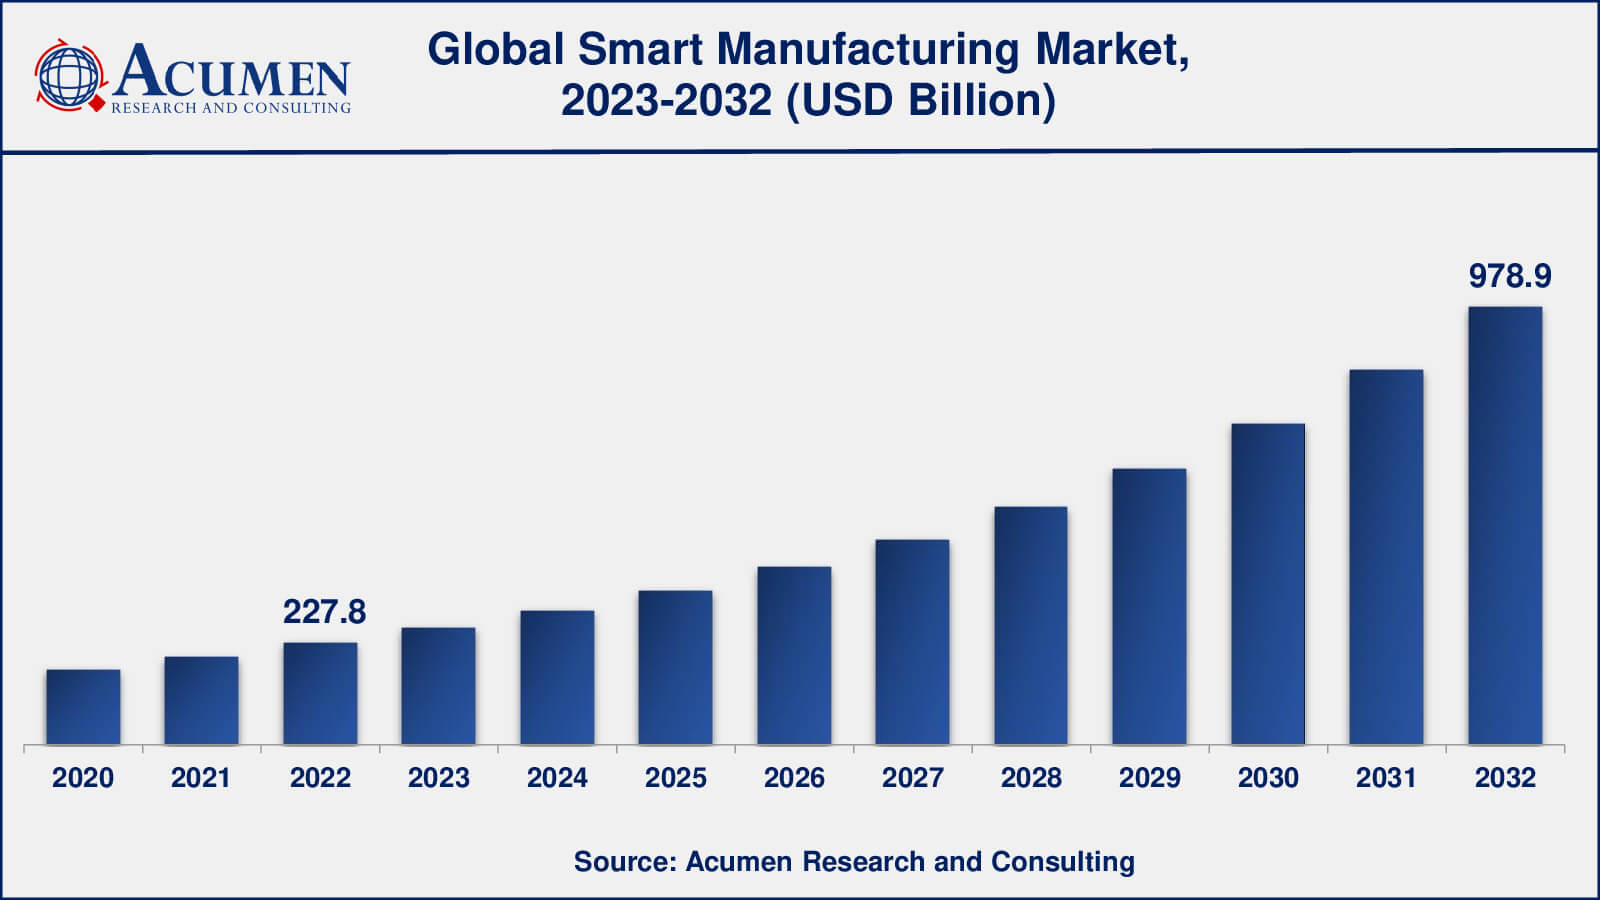
The Global Smart Manufacturing Market Size accounted for USD 227.8 Billion in 2022 and is estimated to achieve a market size of USD 978.9 Billion by 2032 growing at a CAGR of 15.8% from 2023 to 2032.
Smart Manufacturing Market Highlights
- Global smart manufacturing market revenue is poised to garner USD 978.9 billion by 2032 with a CAGR of 15.8% from 2023 to 2032
- Asia-Pacific smart manufacturing market value occupied around USD 84.3 billion in 2022
- Asia-Pacific smart manufacturing market growth will record a CAGR of more than 17% from 2023 to 2032
- Among component, the hardware sub-segment generated over US$ 125.6 billion revenue in 2022
- Based on end-user industry, the automotive sub-segment generated around 24% share in 2022
- Increasing integration of IoT and connectivity is a popular smart manufacturing market trend that fuels the industry demand
Smart manufacturing is a method used to automate the manufacturing of products and transaction processes. Intelligent manufacturing requires the use of automation devices, and its purpose is to support the global economy. This output reduces workload and makes the processes more efficient. Smart manufacturing includes various technologies such as robotics, artificial intelligence, and machine learning. For example, robots can perform tasks with greater efficiency and accuracy compared to human tasks, thereby reducing human efforts. With the help of artificial intelligence (AI) and machine learning, we can identify areas for improvement and analyze data to optimize production processes. Smart manufacturing is applicable in all stages of the industry, ranging from digitization in the industry supply chain, production, design process, distribution, to marketing.
Global Smart Manufacturing Market Dynamics
Market Drivers
- Increasing demand for automation, quality, and efficiency
- Rising government involvement in supporting smart manufacturing
- Need for compliance and government support for digitization
Market Restraints
- High investments and cost of implementing smart manufacturing solutions
- Security concerns
Market Opportunities
- Proliferation of smart manufacturing in developing countries
- Increase in adoption of cloud technologies and enterprise resource planning
Smart Manufacturing Market Report Coverage
| Market | Smart Manufacturing Market |
| Smart Manufacturing Market Size 2022 | USD 227.8 Billion |
| Smart Manufacturing Market Forecast 2032 | USD 978.9 Billion |
| Smart Manufacturing Market CAGR During 2023 - 2032 | 15.8% |
| Smart Manufacturing Market Analysis Period | 2020 - 2032 |
| Smart Manufacturing Market Base Year | 2022 |
| Smart Manufacturing Market Forecast Data | 2023 - 2032 |
| Segments Covered | By Component, By Technology, By End-Use Industry, And By Geography |
| Regional Scope | North America, Europe, Asia Pacific, Latin America, and Middle East & Africa |
| Key Companies Profiled | ABB Ltd., Schneider Electric, Siemens AG, General Electric Company, Emerson Electric Company, Mitsubishi Electric, Yokogawa Electric Corporation, Honeywell International Inc., FANUC Corporation, and Rockwell Automation Inc. |
| Report Coverage |
Market Trends, Drivers, Restraints, Competitive Analysis, Player Profiling, Covid-19 Analysis, Regulation Analysis |
Smart Manufacturing Market Insights
The major driving factors supporting the growth of the global smart manufacturing market are an improved focus on increasing efficiency and visibility in the supply chain. Furthermore, market development is further driven by the introduction of emerging technologies such as 3D printing, production execution systems (MES), and service devices for small and medium businesses. Some of the most important factors contributing to smart manufacturing development are the positive influence of policy programs and investments in supporting smart manufacturing. It is anticipated that this trend will continue to boost growth in both developed and developing economies. For instance, the China 2025 Made in China Plan aims to spend more than US$3 trillion in advanced manufacturing.
Increasing adoption of Industry 4.0 is a major factor that will drive the global smart manufacturing market. Industry 4.0 has led to the rising use of technologies such as automation, data analytics, and IoT. Digital technologies offer several benefits, such as transforming nations, production systems, and how goods and services are delivered to markets. This type of transformation is essential for industrial development.
Smart Manufacturing Market Segmentation
The worldwide market for smart manufacturing is split based on component, technology, end-use industry, and geography.
Smart Manufacturing Components
- Hardware
- Software
- Services
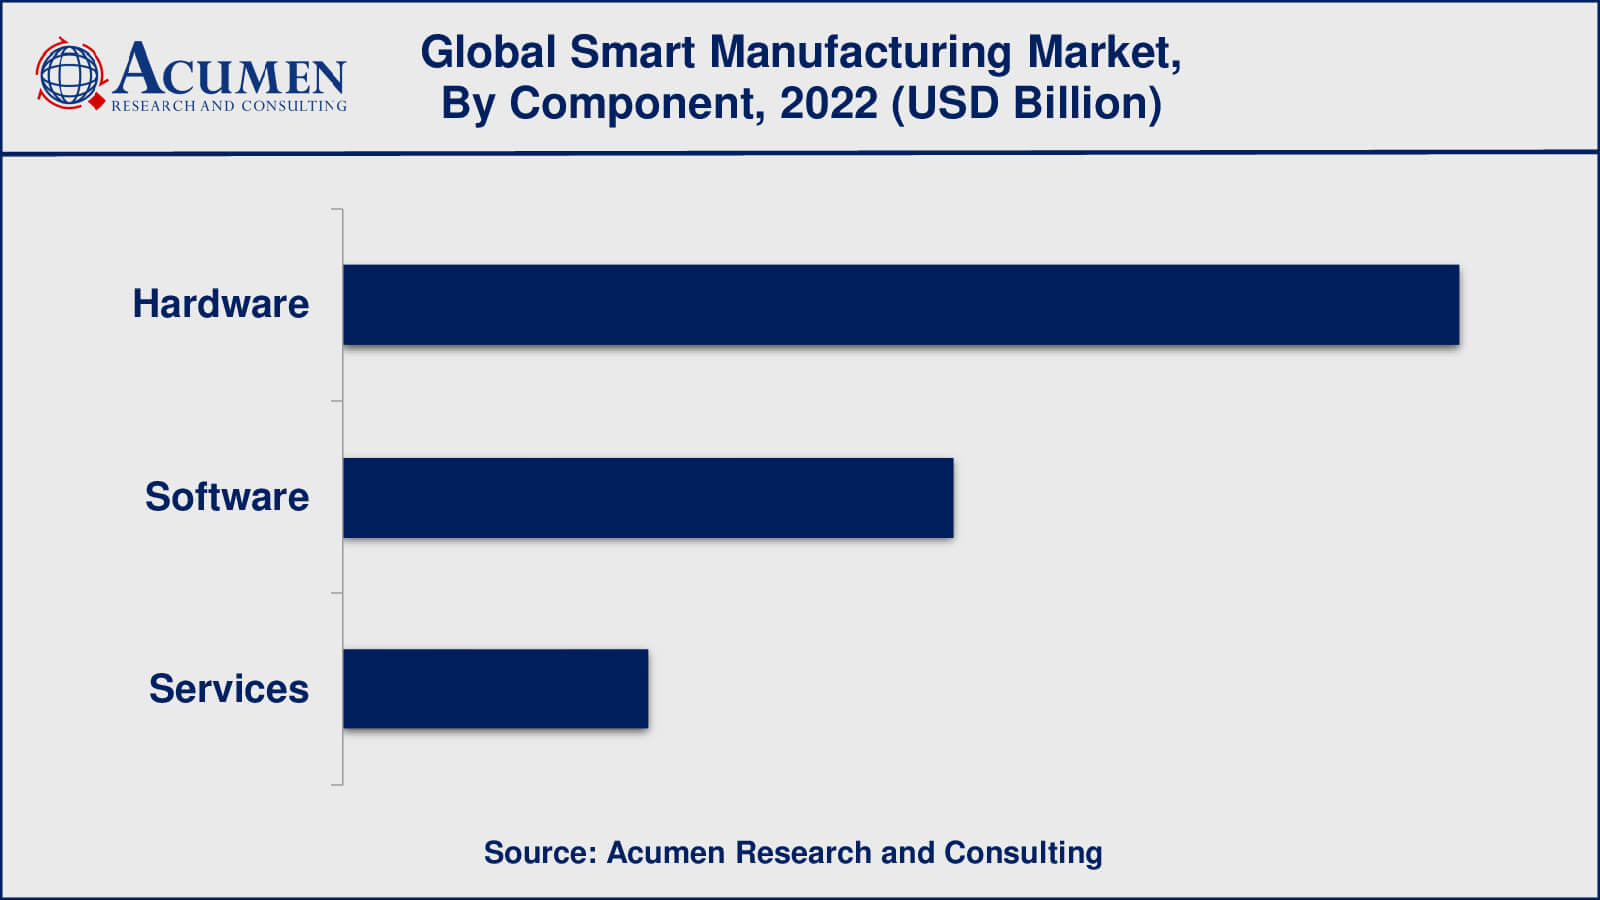
In terms of component segment, the market is categorized into hardware, software, and services. As per the smart manufacturing industry analysis, the hardware category emerged as the leader in terms of revenue share in previous years. Some of the primary hardware used in smart manufacturing include sensors, controllers, robots, and 3D printers. This is a wide range of devices used for manufacturing operations. This component is an important factor and backbone of smart manufacturing. Smart manufacturing has data collection, automation, and controlling capabilities. Looking ahead, the software segment is projected to exhibit the highest revenue growth rate over the forecast period, indicating promising prospects in the market. One commonly used smart manufacturing system in this domain is the Internet of Things (IoT). IoT is widely employed in smartphones for functions like navigation, surveillance, and integration with sensors.
Smart Manufacturing Technologies
- Machine Execution Systems
- Programmable Logic Controller
- Enterprise Resource Planning
- SCADA
- Discrete Control Systems
- Human Machine Interface
- Machine Vision
- 3D Printing
- Product Lifecycle Management
- Plant Asset Management
Within the technology segment, the discrete control system category emerged as the leader in terms of revenue share in previous years. The discrete control system provides controls and monitors operations for administration, running continuously in the background. The market can be accessed remotely with the help of technology and industrial automation. However, 3D printing has shown significant growth at the highest CAGR during the forecast period. Manufacturers can use 3D software to design both small and large parts, which can save time and cost for manufacturers due to the easy design and printing facilities.
Smart Manufacturing End-Use Industries
- Automotive
- Aerospace & Defense
- Chemicals & Materials
- Healthcare
- Industrial Equipment
- Electronics
- Food & Agriculture
- Oil & Gas
- Others
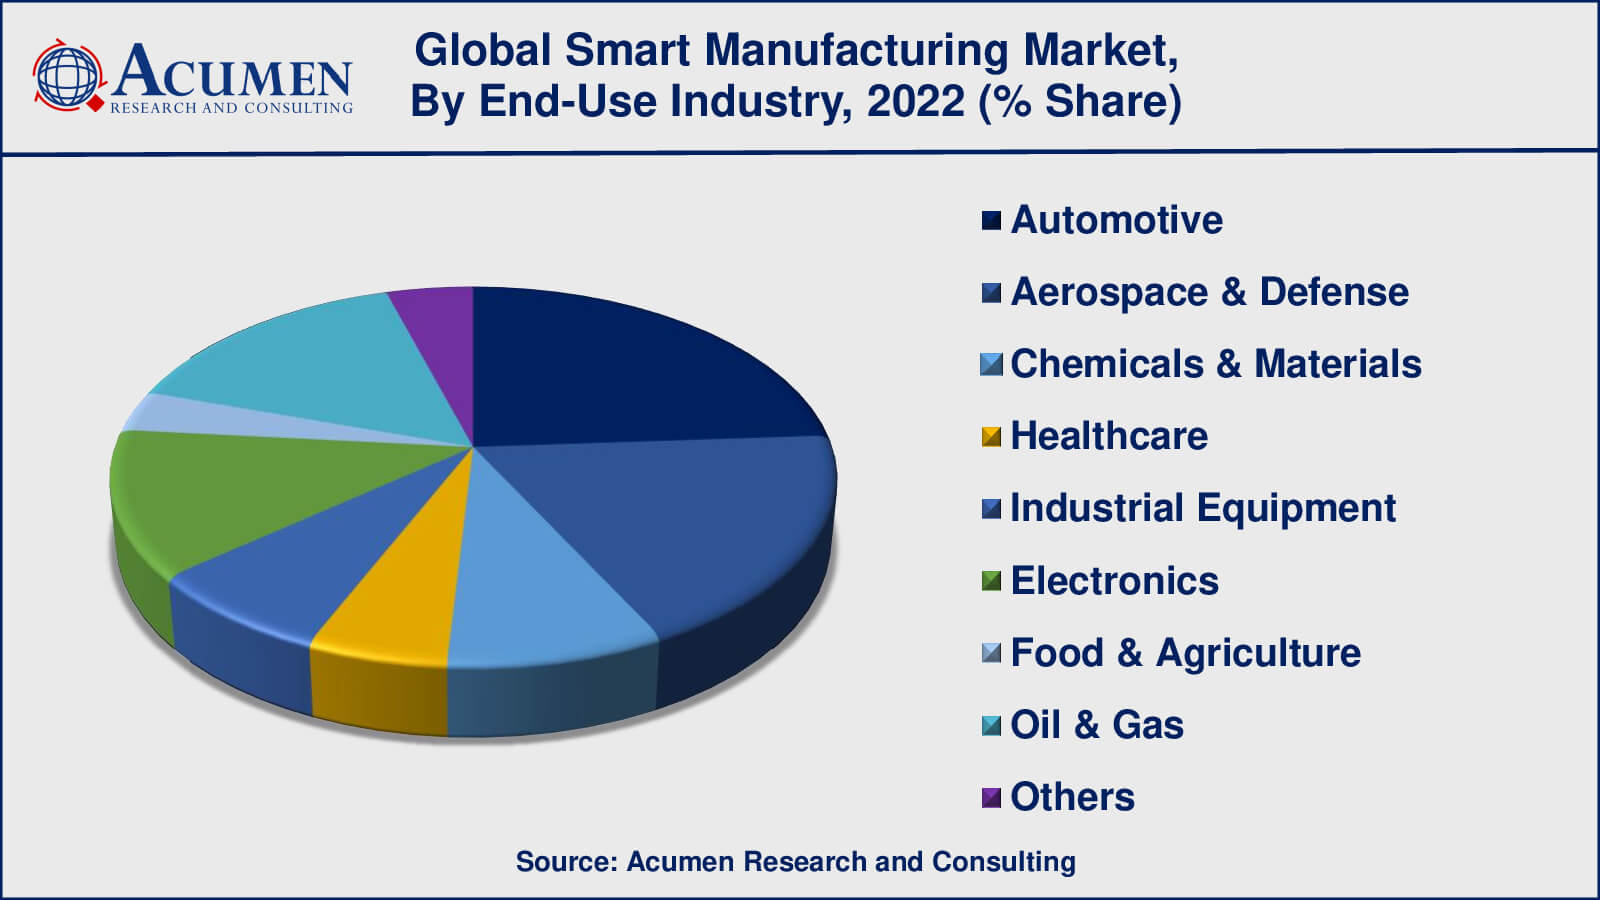
According to the smart manufacturing market forecast, the automobile sector has adopted smart manufacturing to boost production efficiency, automation, and quality control. In automobile production, robotics, artificial intelligence, and data analytics have been widely employed to optimise processes and boost efficiency. Similarly, the aerospace and defence industries were among the first to adopt innovative production technologies such as smart manufacturing. Smart manufacturing has been used in this industry to simplify complicated production processes, increase product quality, and satisfy severe regulatory standards.
In recent years, the food & beverages sub-segment has emerged as a rapidly growing end-use industry in the smart manufacturing market. The main aim of the food and beverages industries is to provide good quality products while maintaining efficient production and low-cost distribution. Smart manufacturing technologies are used for design flexibility and integrated safety solutions. Advanced software present in smart manufacturing controls the operations of machines during manufacturing and distribution of products. The increasing demand for food and beverages industries due to the rising global population is a major key factor for the market's growth. This creates a significant need for smart manufacturing solutions in the Food & Beverages sector, which is anticipated to contribute significantly to the market's growth in the coming years.
Smart Manufacturing Market Regional Outlook
North America
- U.S.
- Canada
Europe
- U.K.
- Germany
- France
- Spain
- Rest of Europe
Asia-Pacific
- India
- Japan
- China
- Australia
- South Korea
- Rest of Asia-Pacific
Latin America
- Brazil
- Mexico
- Rest of Latin America
The Middle East & Africa
- South Africa
- GCC Countries
- Rest of the Middle East & Africa (ME&A)
Smart Manufacturing Market Regional Analysis
On a geographic level, the smart manufacturing industry in Asia-Pacific is expected to dominate the overall smart manufacturing market, due to significant technical advancements in the automotive and industrial industries in China, Japan, and India. Additionally, North America is also one of the leading regions in the smart manufacturing market. The supply of enhanced production capability is anticipated to improve the intelligent manufacturing industry in North America. Over the last couple of years, the market has seen extensive use of IoT and highly reliable low-latency communications technologies, which propel demand in the North American smart manufacturing market.
Europe is also expected to be target markets for smart industry participants. In Latin America, the smart manufacturing market is expected to grow at the rapid CAGR during the projected period from 2023 to 2032. The growing penetration of additive manufacturing components in the oil & gas industry is expected to drive smart manufacturing demand in the MEA region with a strong CAGR.
Smart Manufacturing Market Players
Some of the top smart manufacturing companies offered in our report include ABB Ltd., Schneider Electric, Siemens AG, General Electric Company, Emerson Electric Company, Mitsubishi Electric, Yokogawa Electric Corporation, Honeywell International Inc., FANUC Corporation, and Rockwell Automation Inc.
Frequently Asked Questions
How big is the smart manufacturing market?
The smart manufacturing market size was USD 227.8 billion in 2022.
What is the CAGR of the global smart manufacturing market from 2023 to 2032?
The CAGR of smart manufacturing is 15.8% during the analysis period of 2023 to 2032.
Which are the key players in the smart manufacturing market?
The key players operating in the global market are including ABB Ltd., Schneider Electric, Siemens AG, General Electric Company, Emerson Electric Company, Mitsubishi Electric, Yokogawa Electric Corporation, Honeywell International Inc., FANUC Corporation, and Rockwell Automation Inc.
Which region dominated the global smart manufacturing market share?
Asia-Pacific held the dominating position in smart manufacturing industry during the analysis period of 2023 to 2032.
Which region registered fastest CAGR from 2023 to 2032?
Asia-Pacific region exhibited fastest growing CAGR for market of smart manufacturing during the analysis period of 2023 to 2032.
What are the current trends and dynamics in the global smart manufacturing industry?
The current trends and dynamics in the smart manufacturing industry include increasing demand for automation, quality, and efficiency, rising government involvement in supporting smart manufacturing, and need for compliance and government support for digitization t.
Which component held the maximum share in 2022?
The hardware component held the maximum share of the smart manufacturing industry.


