The Global Smart Home Market Size accounted for USD 102.5 Billion in 2023 and is estimated to achieve a market size of USD 731.8 Billion by 2032 growing at a CAGR of 24.7% from 2024 to 2032
[By Products (Security & Access Controls, Lighting Control, Entertainment Devices, HVAC, Smart Kitchen Appliances, Home Appliances, Smart Furniture, Home Healthcare, and Other Devices), By Protocols (Wireless Protocols, Wired Protocols, and Hybrid), By Application (New Construction, and Retrofit )]
Smart Home Market Highlights
- Global smart home market revenue is poised to garner USD 731.8 billion by 2032 with a CAGR of 24.7% from 2024 to 2032
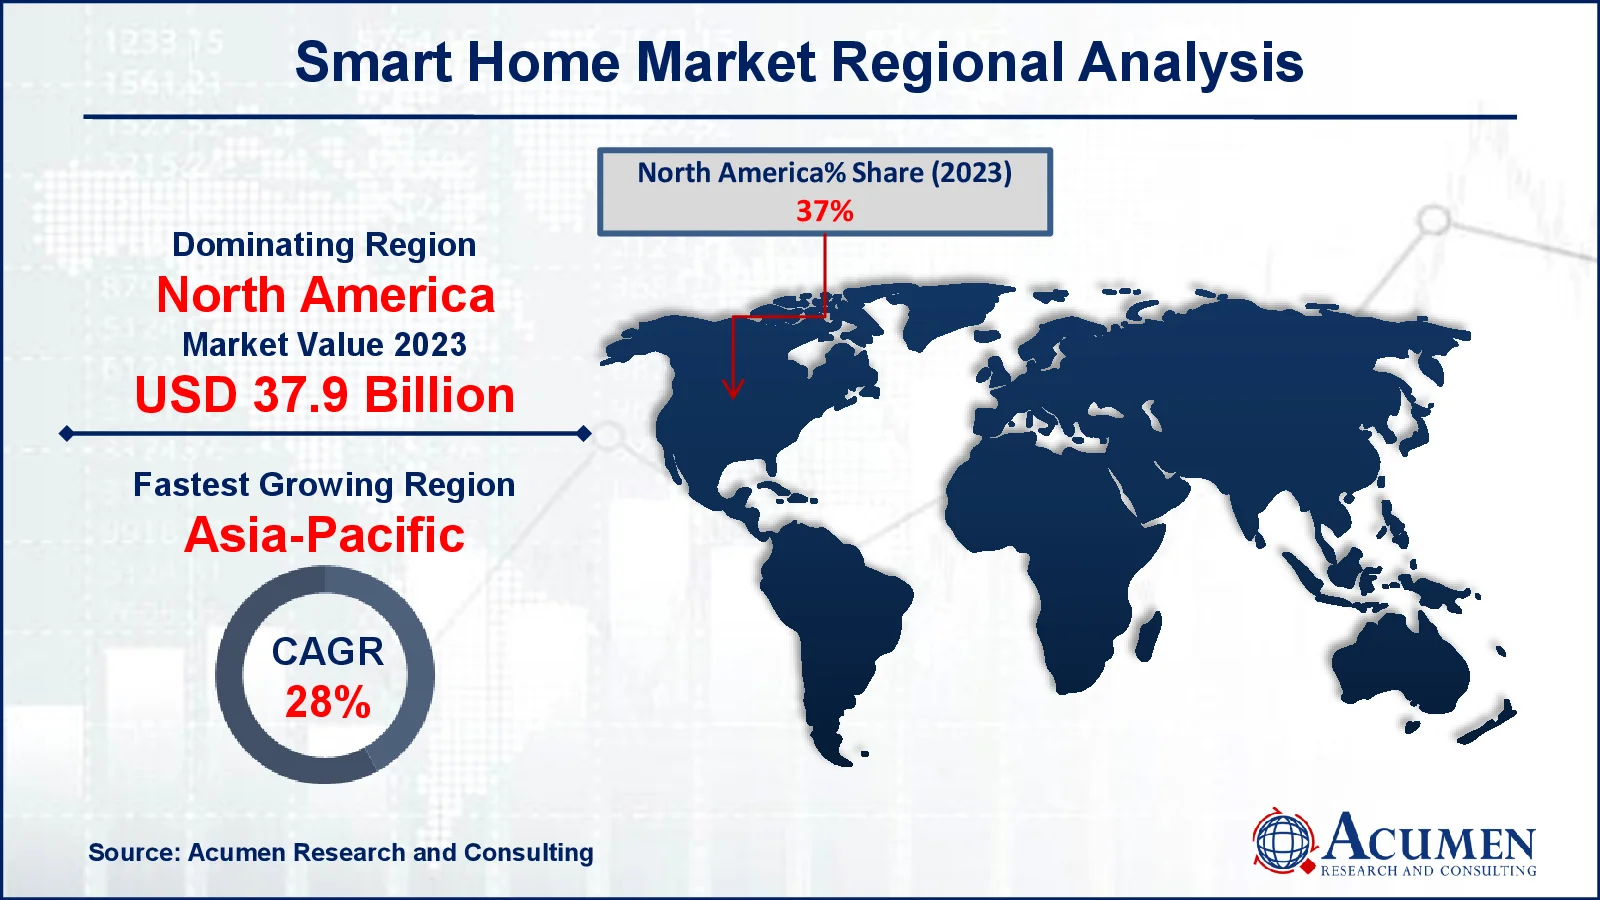
- North America smart home market value occupied around USD 37.9 billion in 2023
- Asia-Pacific smart home market growth will record a CAGR of more than 28% from 2024 to 2032
- Among product, the security & access controls sub-segment generated 30% of the market share in 2023
- Based on application, the retrofit sub-segment generated 62% of market share in 2023
- Expansion of voice-controlled devices and integration with popular virtual assistants is the smart home market trend that fuels the industry demand
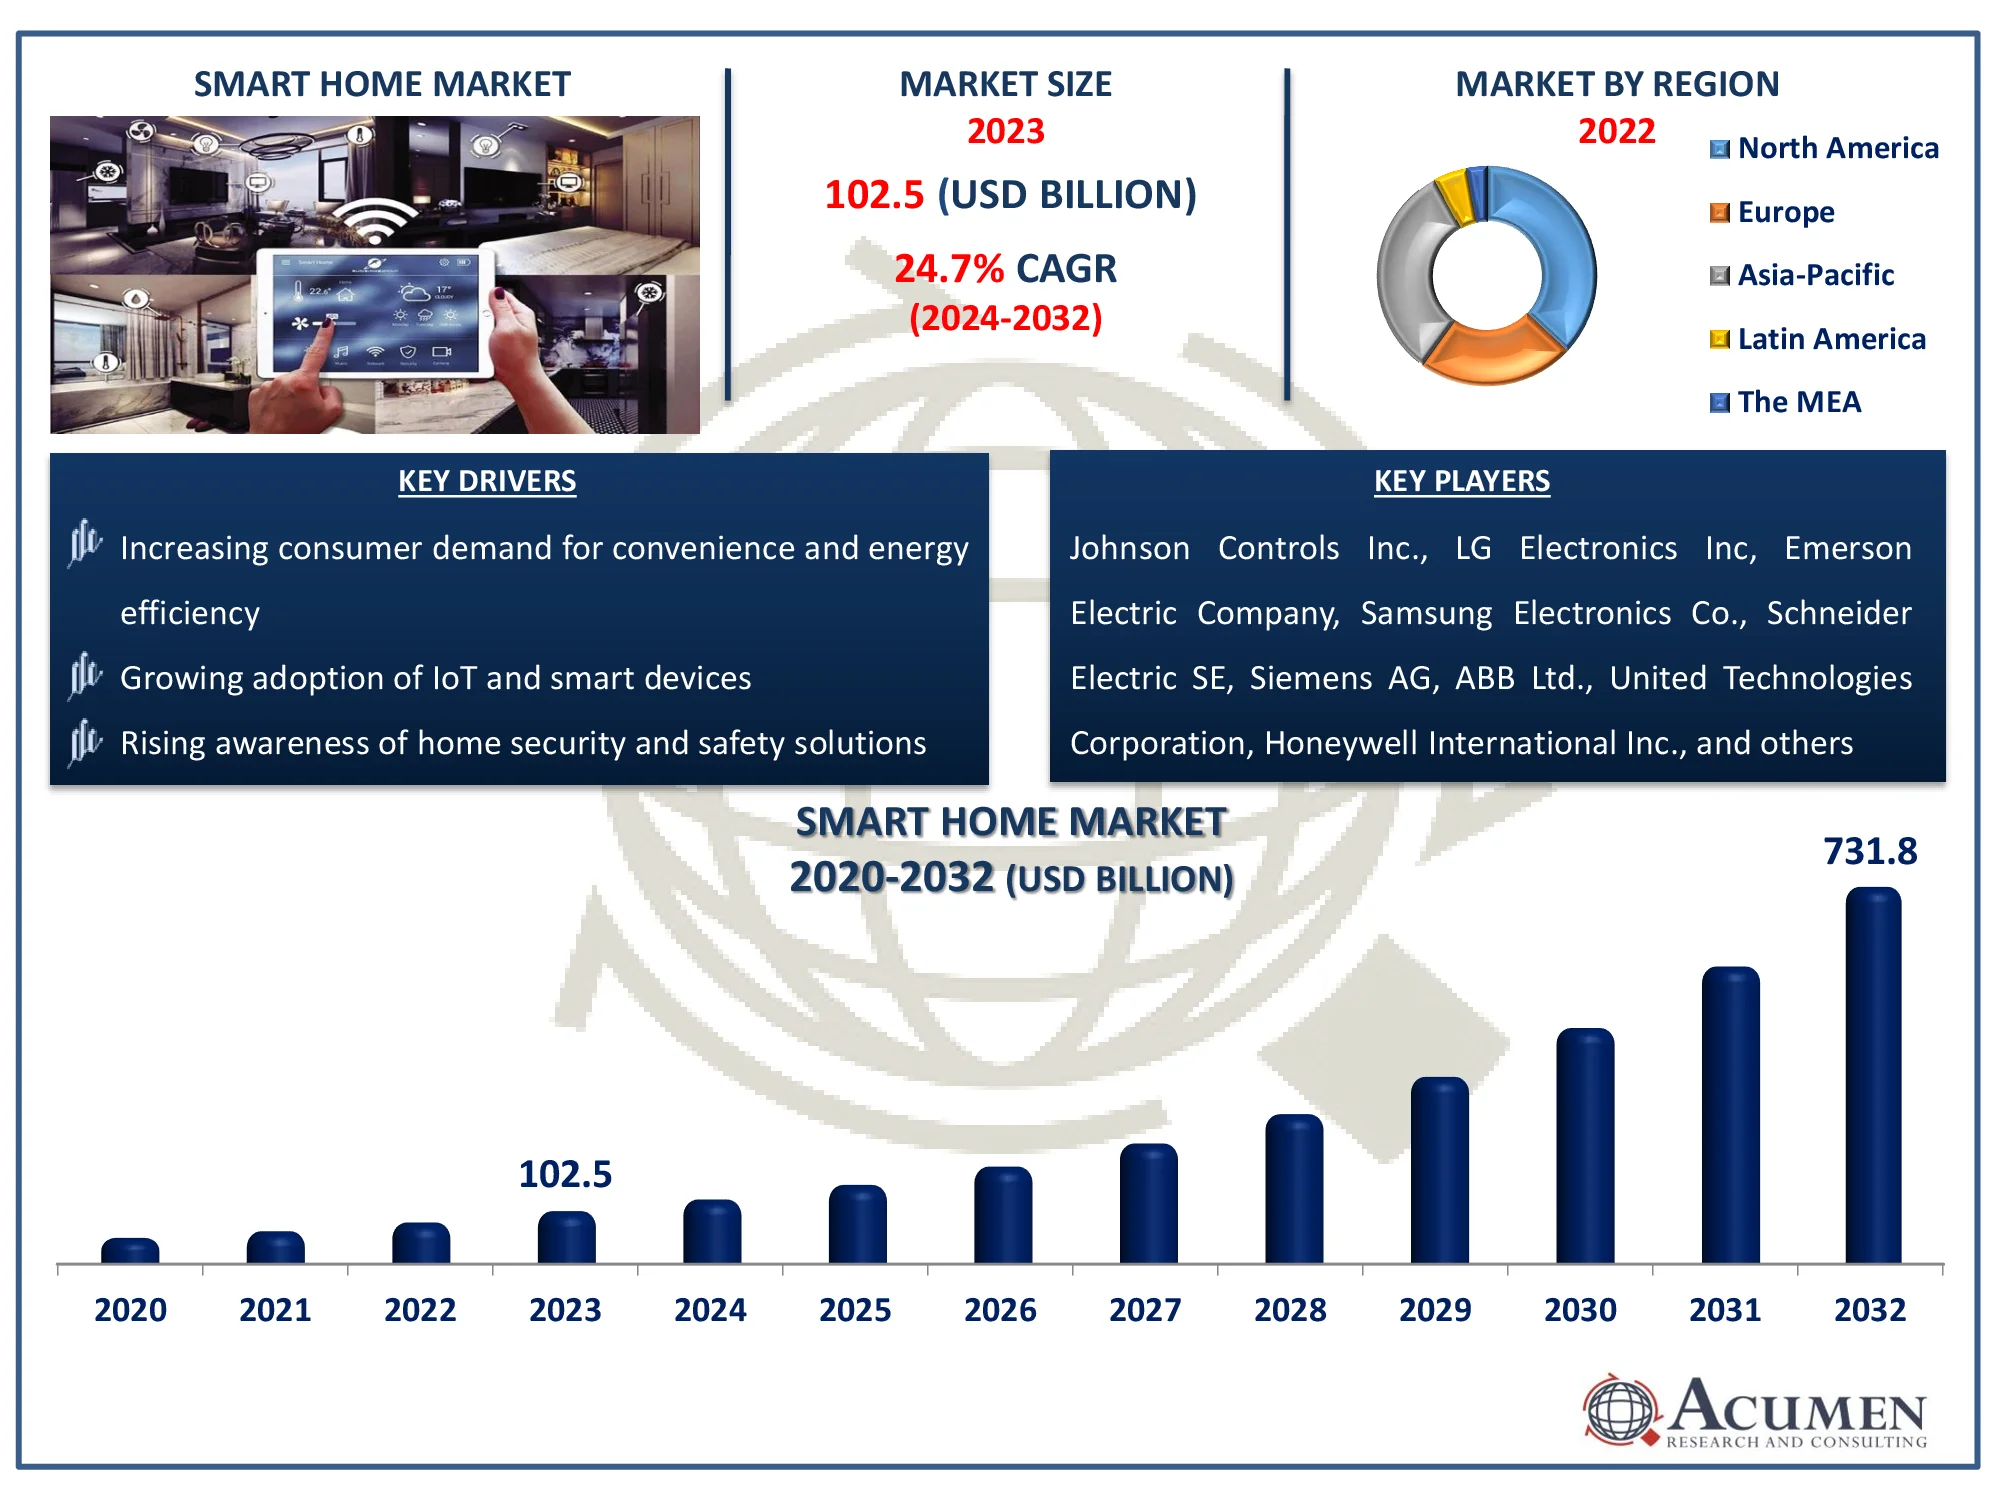
Smart houses are automated homes that can regulate lighting, entertainment systems, appliances, and the environment. It also includes home security features such as alarms and access control. When home gadgets are connected to the Internet, they form the foundation of the Internet of Things (IoT). A smart home often links controlled gadgets to a gateway or central hub. The study analyzes the global smart home market with 2032 as the forecast period and 2023 as the base year. The worldwide smart home market is expected to develop at a significant CAGR of approximately 24.7% over the forecast period. Furthermore, market players are primarily focusing on developing new innovative technologies to complement the expansion of the smart home market.
Global Smart Home Market Dynamics
Market Drivers
- Increasing consumer demand for convenience and energy efficiency
- Growing adoption of IoT and smart devices
- Rising awareness of home security and safety solutions
Market Restraints
- High initial cost of smart home devices and systems
- Privacy and security concerns related to data breaches
- Compatibility issues among various smart home devices and platforms
Market Opportunities
- Expansion of smart home technologies in developing regions
- Integration of AI and machine learning for personalized home automation
- Growth in remote monitoring and control solutions for elderly care
Smart Home Market Report Coverage
Market |
Smart Home Market
|
Smart Home Market Size 2022 |
USD 102.5 Billion
|
Smart Home Market Forecast 2032 |
USD 731.8 Billion |
Smart Home Market CAGR During 2023 - 2032 |
24.7% |
Smart Home Market Analysis Period |
2020 - 2032 |
Smart Home Market Base Year
|
2022 |
Smart Home Market Forecast Data |
2023 - 2032 |
Segments Covered |
By Product, By Protocols, By Application, And By Geography
|
Regional Scope |
North America, Europe, Asia Pacific, Latin America, and Middle East & Africa |
Key Companies Profiled |
Johnson Controls Inc., LG Electronics Inc, Emerson Electric Company, Samsung Electronics Co., Schneider Electric SE, Siemens AG, ABB Ltd., United Technologies Corporation, Honeywell International Inc., and Crestron Electronics, Inc.
|
Report Coverage
|
Market Trends, Drivers, Restraints, Competitive Analysis, Player Profiling, Covid-19 Analysis, Regulation Analysis |
Smart Home Market Insights
Increasing advancements in the internet of things (IoT), the proliferation of smartphones and smart gadgets, consumer adoption, increased awareness of healthy lifestyles, mounting demand for energy-efficient solutions, and government initiatives are some of the fundamental factors driving global smart home market growth. Growing improvements in the Internet of Things and the emergence of high-speed Internet connections are some of the primary factors projected to fuel the growth of the global smart home market over the forecast period.
The rapid expansion of wireless Internet, the availability of mobile devices, the supremacy of low-energy technologies, the advent of cloud services, and other reasons have expand in a new era of smart home technology. Furthermore, developments in wireless communication technologies have played a significant role in increasing demand for home theatre system controls, accelerating the entire smart home market for entertainment controls. The use of smart energy management systems is also driving the growth of the smart home market.
The growing population of smartphones and cost-cutting measures provided by smart homes are expected to drive overall market growth during the forecast period. For instance, according to The World Economic Forum, As of January 2023, India has more over 700 Million smartphone users, 425 Million of whom lived in rural areas. More than half of Indians now use smartphones, and the number of active internet users has increased by 45% since 2019, putting rural India at the center of the world's smart revolution. Growing investments in smart devices, early acceptance of various intelligent technologies, and technical breakthroughs are among the reasons driving the growth of the worldwide smart home market. However, the expensive cost of smart houses and a lack of information about new technology are two concerns that may impede the worldwide smart home market.
Smart Home Market Segmentation
The worldwide market for smart home is split based on product, protocols, application, and geography.
Smart Home Products
- Security & Access Controls
- Security Cameras
- Video Door Phones
- Smart Locks
- Remote Monitoring Software & Services
- Others
- Lighting Control
- Smart Lights
- Relays & Switches
- Occupancy Sensors
- Dimmers
- Other Products
- Entertainment Devices
- Smart Displays/TV
- Streaming Devices
- Sound Bars & Speakers
- HVAC
- Smart Thermostats
- Sensors
- Smart Vents
- Others
- Smart Kitchen Appliances
- Refrigerators
- Dish Washers
- Cooktops
- Microwave/Ovens
- Home Appliances
- Smart Washing Machines
- Smart Water Heaters
- Smart Vacuum Cleaners
- Smart Furniture
- Home Healthcare
- Other Devices
According to the smart home industry analysis, security and access controls are a dominant segment in the market due to their crucial role in enhancing safety and convenience. These systems include smart locks, surveillance cameras, and alarm systems, which provide homeowners with real-time monitoring and control over their property. Additionally, the integration of these systems with other smart home devices offers a comprehensive security solution, making them a key focus for both consumers and manufacturers. The entertainment segment is expected to dominate the market during the forecast period, owing to advances in wireless technology and rising demand for various entertainment gadgets. On the other hand, the HVAC control systems segment is expected to increase significantly during the forecast period due to rising concerns about energy efficiency and a growing demand for energy-efficient devices.
Smart Home Protocols
- Wireless Protocols
- ZigBee
- Wi-Fi
- Bluetooth
- Z Wave
- Others
- Wired Protocols
- Hybrid
The wireless protocols segment is expected to largest protocols category in the smart home market, due to their ease of setup and operation. They allow smart devices to connect wirelessly, making them useful for a variety of home applications such as lighting and security. These protocols, like Wi-Fi and Zigbee, are dependable and compatible with a wide range of devices. As technology advances, more individuals prefer wireless choices for their smart homes.
Smart Home Applications
- New Construction
- Retrofit
According to the smart home industry forecast, retrofit solutions are leading the market due to their ability to upgrade existing homes with advanced technologies without requiring extensive renovations. These solutions offer a cost-effective way for homeowners to integrate smart devices, such as lighting, security systems, and climate controls, into their current setups. The flexibility and affordability of retrofits are driving their popularity in the expanding smart home sector.
Smart Home Market Regional Outlook
North America
Europe
- U.K.
- Germany
- France
- Spain
- Rest of Europe
Asia-Pacific
- India
- Japan
- China
- Australia
- South Korea
- Rest of Asia-Pacific
Latin America
- Brazil
- Mexico
- Rest of Latin America
The Middle East & Africa
- South Africa
- GCC Countries
- Rest of the Middle East & Africa (ME&A)
Smart Home Market Regional Analysis
North America dominates global smart home industry. North America is expected to develop at a rapid rate throughout the projected period due to rising demand for home health care and continued technological improvements in the region. The presence of a high number of market players in the region is projected to drive regional market expansion. The rapid adoption of IoT is the major driver driving the growth of the regional smart home market.
Asia-Pacific expected to be the fastest revenue-generating region in the global smart home industry. Countries like China, Japan, and South Korea are early adopters of smart home devices due to strong technology infrastructure and supportive policies. For instance, in August 2022, Samsung Electronics broke ground on a new semiconductor research and development facility in Giheung, Korea, with the goal of reinforcing its position as the industry leader in cutting-edge semiconductor technology. People in the region are interested in smart gadgets for convenience and security. Many local companies also produce these devices, making them more affordable. The growth of technologies like IoT and AI is helping the market expand.
Smart Home Market Players
Some of the top smart home companies offered in our report include Johnson Controls Inc., LG Electronics Inc, Emerson Electric Company, Samsung Electronics Co., Schneider Electric SE, Siemens AG, ABB Ltd., United Technologies Corporation, Honeywell International Inc., and Crestron Electronics, Inc.
CHAPTER 1. Industry Overview of Smart Home Market
1.1. Definition and Scope
1.1.1. Definition of Smart Home
1.1.2. Market Segmentation
1.1.3. Years Considered for the Study
1.1.4. Assumptions and Acronyms Used
1.1.4.1. Market Assumptions and Market Forecast
1.1.4.2. Acronyms Used in Global Smart Home Market
1.2. Summary
1.2.1. Executive Summary
1.2.2. Smart Home Market By Product
1.2.3. Smart Home Market By Protocols
1.2.4. Smart Home Market By Application
1.2.5. Smart Home Market By Region
CHAPTER 2. Research Approach
2.1. Methodology
2.1.1. Research Programs
2.1.2. Market Size Estimation
2.1.3. Market Breakdown and Data Triangulation
2.2. Data Source
2.2.1. Secondary Sources
2.2.2. Primary Sources
CHAPTER 3. Market Dynamics And Competition Analysis
3.1. Market Drivers
3.1.1. Driver 1
3.1.2. Driver 2
3.1.3. Driver 3
3.2. Restraints and Challenges
3.2.1. Restraint 1
3.2.2. Restraint 2
3.2.3. Restraint 3
3.3. Growth Opportunities
3.3.1. Opportunity 1
3.3.2. Opportunity 2
3.3.3. Opportunity 3
3.4. Porter’s Five Forces Analysis
3.4.1. Bargaining Power of Suppliers
3.4.2. Bargaining Power of Buyers
3.4.3. Threat of Substitute
3.4.4. Threat of New Entrants
3.4.5. Degree of Competition
3.5. Market Concentration Ratio and Market Maturity Analysis of Smart Home Market
3.5.1. Go To Market Strategy
3.5.1.1. Introduction
3.5.1.2. Growth
3.5.1.3. Maturity
3.5.1.4. Saturation
3.5.1.5. Possible Development
3.6. Technological Roadmap for Smart Home Market
3.7. Value Chain Analysis
3.7.1. List of Key Manufacturers
3.7.2. List of Customers
3.7.3. Level of Integration
3.8. Cost Structure Analysis
3.8.1. Price Trend of Key Raw Materials
3.8.2. Raw Material Suppliers
3.8.3. Proportion of Manufacturing Cost Structure
3.8.3.1. Raw Material
3.8.3.2. Labor Cost
3.8.3.3. Manufacturing Expense
3.9. Regulatory Compliance
3.10. Competitive Landscape, 2023
3.10.1. Player Positioning Analysis
3.10.2. Key Strategies Adopted By Leading Players
CHAPTER 4. Manufacturing Plant Analysis
4.1. Manufacturing Plant Location and Establish Date of Major Manufacturers in 2023
4.2. R&D Status of Major Manufacturers in 2023
CHAPTER 5. Smart Home Market By Product
5.1. Introduction
5.2. Smart Home Revenue By Product
5.2.1. Smart Home Revenue (USD Billion) and Forecast, By Product, 2020-2032
5.2.2. Security & Access Controls
5.2.2.1. Security & Access Controls Market Revenue (USD Billion) and Growth Rate (%), 2020-2032
5.2.2.2. Security Cameras
5.2.2.2.1. Security Cameras Market Revenue (USD Billion) and Growth Rate (%), 2020-2032
5.2.2.3. Video Door Phones
5.2.2.3.1. Video Door Phones Market Revenue (USD Billion) and Growth Rate (%), 2020-2032
5.2.2.4. Smart Locks
5.2.2.4.1. Smart Locks Market Revenue (USD Billion) and Growth Rate (%), 2020-2032
5.2.2.5. Remote Monitoring Software & Services
5.2.2.5.1. Remote Monitoring Software & Services Market Revenue (USD Billion) and Growth Rate (%), 2020-2032
5.2.2.6. Others
5.2.2.6.1. Others Market Revenue (USD Billion) and Growth Rate (%), 2020-2032
5.2.3. Lighting Control
5.2.3.1. Lighting Control Market Revenue (USD Billion) and Growth Rate (%), 2020-2032
5.2.3.2. Smart Lights
5.2.3.2.1. Smart Lights Market Revenue (USD Billion) and Growth Rate (%), 2020-2032
5.2.3.3. Relays & Switches
5.2.3.3.1. Relays & Switches Market Revenue (USD Billion) and Growth Rate (%), 2020-2032
5.2.3.4. Occupancy Sensors
5.2.3.4.1. Occupancy Sensors Market Revenue (USD Billion) and Growth Rate (%), 2020-2032
5.2.3.5. Dimmers
5.2.3.5.1. Dimmers Market Revenue (USD Billion) and Growth Rate (%), 2020-2032
5.2.3.6. Other Products
5.2.3.6.1. Other Products Market Revenue (USD Billion) and Growth Rate (%), 2020-2032
5.2.4. Entertainment Devices
5.2.4.1. Entertainment Devices Market Revenue (USD Billion) and Growth Rate (%), 2020-2032
5.2.4.2. Smart Displays/TV
5.2.4.2.1. Smart Displays/TV Market Revenue (USD Billion) and Growth Rate (%), 2020-2032
5.2.4.3. Streaming Devices
5.2.4.3.1. Streaming Devices Market Revenue (USD Billion) and Growth Rate (%), 2020-2032
5.2.4.4. Sound Bars & Speakers
5.2.4.4.1. Sound Bars & Speakers Market Revenue (USD Billion) and Growth Rate (%), 2020-2032
5.2.5. HVAC
5.2.5.1. HVAC Market Revenue (USD Billion) and Growth Rate (%), 2020-2032
5.2.5.2. Smart Thermostats
5.2.5.2.1. Smart Thermostats Market Revenue (USD Billion) and Growth Rate (%), 2020-2032
5.2.5.3. Sensors
5.2.5.3.1. Sensors Market Revenue (USD Billion) and Growth Rate (%), 2020-2032
5.2.5.4. Smart Vents
5.2.5.4.1. Smart Vents Market Revenue (USD Billion) and Growth Rate (%), 2020-2032
5.2.5.5. Others
5.2.5.5.1. Others Market Revenue (USD Billion) and Growth Rate (%), 2020-2032
5.2.6. Smart Kitchen Appliances
5.2.6.1. Smart Kitchen Appliances Market Revenue (USD Billion) and Growth Rate (%), 2020-2032
5.2.6.2. Refrigerators
5.2.6.2.1. Refrigerators Market Revenue (USD Billion) and Growth Rate (%), 2020-2032
5.2.6.3. Dish Washers
5.2.6.3.1. Dish Washers Market Revenue (USD Billion) and Growth Rate (%), 2020-2032
5.2.6.4. Cooktops
5.2.6.4.1. Cooktops Market Revenue (USD Billion) and Growth Rate (%), 2020-2032
5.2.6.5. Microwave/Ovens
5.2.6.5.1. Microwave/Ovens Market Revenue (USD Billion) and Growth Rate (%), 2020-2032
5.2.7. Home Appliances
5.2.7.1. Home Appliances Market Revenue (USD Billion) and Growth Rate (%), 2020-2032
5.2.7.2. Smart Washing Machines
5.2.7.2.1. Smart Washing Machines Market Revenue (USD Billion) and Growth Rate (%), 2020-2032
5.2.7.3. Smart Water Heaters
5.2.7.3.1. Smart Water Heaters Market Revenue (USD Billion) and Growth Rate (%), 2020-2032
5.2.7.4. Smart Vacuum Cleaners
5.2.7.4.1. Smart Vacuum Cleaners Market Revenue (USD Billion) and Growth Rate (%), 2020-2032
5.2.8. Smart Furniture
5.2.8.1. Smart Furniture Market Revenue (USD Billion) and Growth Rate (%), 2020-2032
5.2.9. Home Healthcare
5.2.9.1. Home Healthcare Market Revenue (USD Billion) and Growth Rate (%), 2020-2032
5.2.10. Other Devices
5.2.10.1. Other Devices Market Revenue (USD Billion) and Growth Rate (%), 2020-2032
CHAPTER 6. Smart Home Market By Protocols
6.1. Introduction
6.2. Smart Home Revenue By Protocols
6.2.1. Smart Home Revenue (USD Billion) and Forecast, By Protocols, 2020-2032
6.2.2. Wireless Protocols
6.2.2.1. Wireless Protocols Market Revenue (USD Billion) and Growth Rate (%), 2020-2032
6.2.2.2. ZigBee
6.2.2.2.1. ZigBee Market Revenue (USD Billion) and Growth Rate (%), 2020-2032
6.2.2.3. Wi-Fi
6.2.2.3.1. Wi-Fi Market Revenue (USD Billion) and Growth Rate (%), 2020-2032
6.2.2.4. Bluetooth
6.2.2.4.1. Bluetooth Market Revenue (USD Billion) and Growth Rate (%), 2020-2032
6.2.2.5. Z Wave
6.2.2.5.1. Z Wave Market Revenue (USD Billion) and Growth Rate (%), 2020-2032
6.2.2.6. Others
6.2.2.6.1. Others Market Revenue (USD Billion) and Growth Rate (%), 2020-2032
6.2.3. Wired Protocols
6.2.3.1. Wired Protocols Market Revenue (USD Billion) and Growth Rate (%), 2020-2032
6.2.4. Hybrid
6.2.4.1. Hybrid Market Revenue (USD Billion) and Growth Rate (%), 2020-2032
CHAPTER 7. Smart Home Market By Application
7.1. Introduction
7.2. Smart Home Revenue By Application
7.2.1. Smart Home Revenue (USD Billion) and Forecast, By Application, 2020-2032
7.2.2. New Construction
7.2.2.1. New Construction Market Revenue (USD Billion) and Growth Rate (%), 2020-2032
7.2.3. Retrofit
7.2.3.1. Retrofit Market Revenue (USD Billion) and Growth Rate (%), 2020-2032
CHAPTER 8. North America Smart Home Market By Country
8.1. North America Smart Home Market Overview
8.2. U.S.
8.2.1. U.S. Smart Home Revenue (USD Billion) and Forecast By Product, 2020-2032
8.2.2. U.S. Smart Home Revenue (USD Billion) and Forecast By Protocols, 2020-2032
8.2.3. U.S. Smart Home Revenue (USD Billion) and Forecast By Application, 2020-2032
8.3. Canada
8.3.1. Canada Smart Home Revenue (USD Billion) and Forecast By Product, 2020-2032
8.3.2. Canada Smart Home Revenue (USD Billion) and Forecast By Protocols, 2020-2032
8.3.3. Canada Smart Home Revenue (USD Billion) and Forecast By Application, 2020-2032
8.4. North America PEST Analysis
CHAPTER 9. Europe Smart Home Market By Country
9.1. Europe Smart Home Market Overview
9.2. U.K.
9.2.1. U.K. Smart Home Revenue (USD Billion) and Forecast By Product, 2020-2032
9.2.2. U.K. Smart Home Revenue (USD Billion) and Forecast By Protocols, 2020-2032
9.2.3. U.K. Smart Home Revenue (USD Billion) and Forecast By Application, 2020-2032
9.3. Germany
9.3.1. Germany Smart Home Revenue (USD Billion) and Forecast By Product, 2020-2032
9.3.2. Germany Smart Home Revenue (USD Billion) and Forecast By Protocols, 2020-2032
9.3.3. Germany Smart Home Revenue (USD Billion) and Forecast By Application, 2020-2032
9.4. France
9.4.1. France Smart Home Revenue (USD Billion) and Forecast By Product, 2020-2032
9.4.2. France Smart Home Revenue (USD Billion) and Forecast By Protocols, 2020-2032
9.4.3. France Smart Home Revenue (USD Billion) and Forecast By Application, 2020-2032
9.5. Spain
9.5.1. Spain Smart Home Revenue (USD Billion) and Forecast By Product, 2020-2032
9.5.2. Spain Smart Home Revenue (USD Billion) and Forecast By Protocols, 2020-2032
9.5.3. Spain Smart Home Revenue (USD Billion) and Forecast By Application, 2020-2032
9.6. Rest of Europe
9.6.1. Rest of Europe Smart Home Revenue (USD Billion) and Forecast By Product, 2020-2032
9.6.2. Rest of Europe Smart Home Revenue (USD Billion) and Forecast By Protocols, 2020-2032
9.6.3. Rest of Europe Smart Home Revenue (USD Billion) and Forecast By Application, 2020-2032
9.7. Europe PEST Analysis
CHAPTER 10. Asia Pacific Smart Home Market By Country
10.1. Asia Pacific Smart Home Market Overview
10.2. China
10.2.1. China Smart Home Revenue (USD Billion) and Forecast By Product, 2020-2032
10.2.2. China Smart Home Revenue (USD Billion) and Forecast By Protocols, 2020-2032
10.2.3. China Smart Home Revenue (USD Billion) and Forecast By Application, 2020-2032
10.3. Japan
10.3.1. Japan Smart Home Revenue (USD Billion) and Forecast By Product, 2020-2032
10.3.2. Japan Smart Home Revenue (USD Billion) and Forecast By Protocols, 2020-2032
10.3.3. Japan Smart Home Revenue (USD Billion) and Forecast By Application, 2020-2032
10.4. India
10.4.1. India Smart Home Revenue (USD Billion) and Forecast By Product, 2020-2032
10.4.2. India Smart Home Revenue (USD Billion) and Forecast By Protocols, 2020-2032
10.4.3. India Smart Home Revenue (USD Billion) and Forecast By Application, 2020-2032
10.5. Australia
10.5.1. Australia Smart Home Revenue (USD Billion) and Forecast By Product, 2020-2032
10.5.2. Australia Smart Home Revenue (USD Billion) and Forecast By Protocols, 2020-2032
10.5.3. Australia Smart Home Revenue (USD Billion) and Forecast By Application, 2020-2032
10.6. South Korea
10.6.1. South Korea Smart Home Revenue (USD Billion) and Forecast By Product, 2020-2032
10.6.2. South Korea Smart Home Revenue (USD Billion) and Forecast By Protocols, 2020-2032
10.6.3. South Korea Smart Home Revenue (USD Billion) and Forecast By Application, 2020-2032
10.7. Rest of Asia-Pacific
10.7.1. Rest of Asia-Pacific Smart Home Revenue (USD Billion) and Forecast By Product, 2020-2032
10.7.2. Rest of Asia-Pacific Smart Home Revenue (USD Billion) and Forecast By Protocols, 2020-2032
10.7.3. Rest of Asia-Pacific Smart Home Revenue (USD Billion) and Forecast By Application, 2020-2032
10.8. Asia Pacific PEST Analysis
CHAPTER 11. Latin America Smart Home Market By Country
11.1. Latin America Smart Home Market Overview
11.2. Brazil
11.2.1. Brazil Smart Home Revenue (USD Billion) and Forecast By Product, 2020-2032
11.2.2. Brazil Smart Home Revenue (USD Billion) and Forecast By Protocols, 2020-2032
11.2.3. Brazil Smart Home Revenue (USD Billion) and Forecast By Application, 2020-2032
11.3. Mexico
11.3.1. Mexico Smart Home Revenue (USD Billion) and Forecast By Product, 2020-2032
11.3.2. Mexico Smart Home Revenue (USD Billion) and Forecast By Protocols, 2020-2032
11.3.3. Mexico Smart Home Revenue (USD Billion) and Forecast By Application, 2020-2032
11.4. Rest of Latin America
11.4.1. Rest of Latin America Smart Home Revenue (USD Billion) and Forecast By Product, 2020-2032
11.4.2. Rest of Latin America Smart Home Revenue (USD Billion) and Forecast By Protocols, 2020-2032
11.4.3. Rest of Latin America Smart Home Revenue (USD Billion) and Forecast By Application, 2020-2032
11.5. Latin America PEST Analysis
CHAPTER 12. Middle East & Africa Smart Home Market By Country
12.1. Middle East & Africa Smart Home Market Overview
12.2. GCC
12.2.1. GCC Smart Home Revenue (USD Billion) and Forecast By Product, 2020-2032
12.2.2. GCC Smart Home Revenue (USD Billion) and Forecast By Protocols, 2020-2032
12.2.3. GCC Smart Home Revenue (USD Billion) and Forecast By Application, 2020-2032
12.3. South Africa
12.3.1. South Africa Smart Home Revenue (USD Billion) and Forecast By Product, 2020-2032
12.3.2. South Africa Smart Home Revenue (USD Billion) and Forecast By Protocols, 2020-2032
12.3.3. South Africa Smart Home Revenue (USD Billion) and Forecast By Application, 2020-2032
12.4. Rest of Middle East & Africa
12.4.1. Rest of Middle East & Africa Smart Home Revenue (USD Billion) and Forecast By Product, 2020-2032
12.4.2. Rest of Middle East & Africa Smart Home Revenue (USD Billion) and Forecast By Protocols, 2020-2032
12.4.3. Rest of Middle East & Africa Smart Home Revenue (USD Billion) and Forecast By Application, 2020-2032
12.5. Middle East & Africa PEST Analysis
CHAPTER 13. Player Analysis Of Smart Home Market
13.1. Smart Home Market Company Share Analysis
13.2. Competition Matrix
13.2.1. Competitive Benchmarking of key players by price, presence, market share, and R&D investment
13.2.2. New Product Launches and Product Enhancements
13.2.3. Mergers And Acquisition In Global Smart Home Market
13.2.4. Partnership, Joint Ventures and Strategic Alliances/ Sales Agreements
CHAPTER 14. Company Profile
14.1. Johnson Controls Inc.
14.1.1. Company Snapshot
14.1.2. Business Overview
14.1.3. Financial Overview
14.1.3.1. Revenue (USD Billion), 2023
14.1.3.2. Johnson Controls Inc., 2023 Smart Home Business Regional Distribution
14.1.4. Product /Service and Specification
14.1.5. Recent Developments & Business Strategy
14.2. LG Electronics Inc
14.3. Emerson Electric Company
14.4. Samsung Electronics Co.
14.5. Schneider Electric SE
14.6. Siemens AG
14.7. ABB Ltd.
14.8. United Technologies Corporation
14.9. Honeywell International Inc.
14.10. Crestron Electronics, Inc.