The Global Smart Coating Market Size was valued at USD 4,131 Million in 2021 and is estimated to achieve a market size of USD 26,727 Million by 2030; growing at a CAGR of 23.7%.
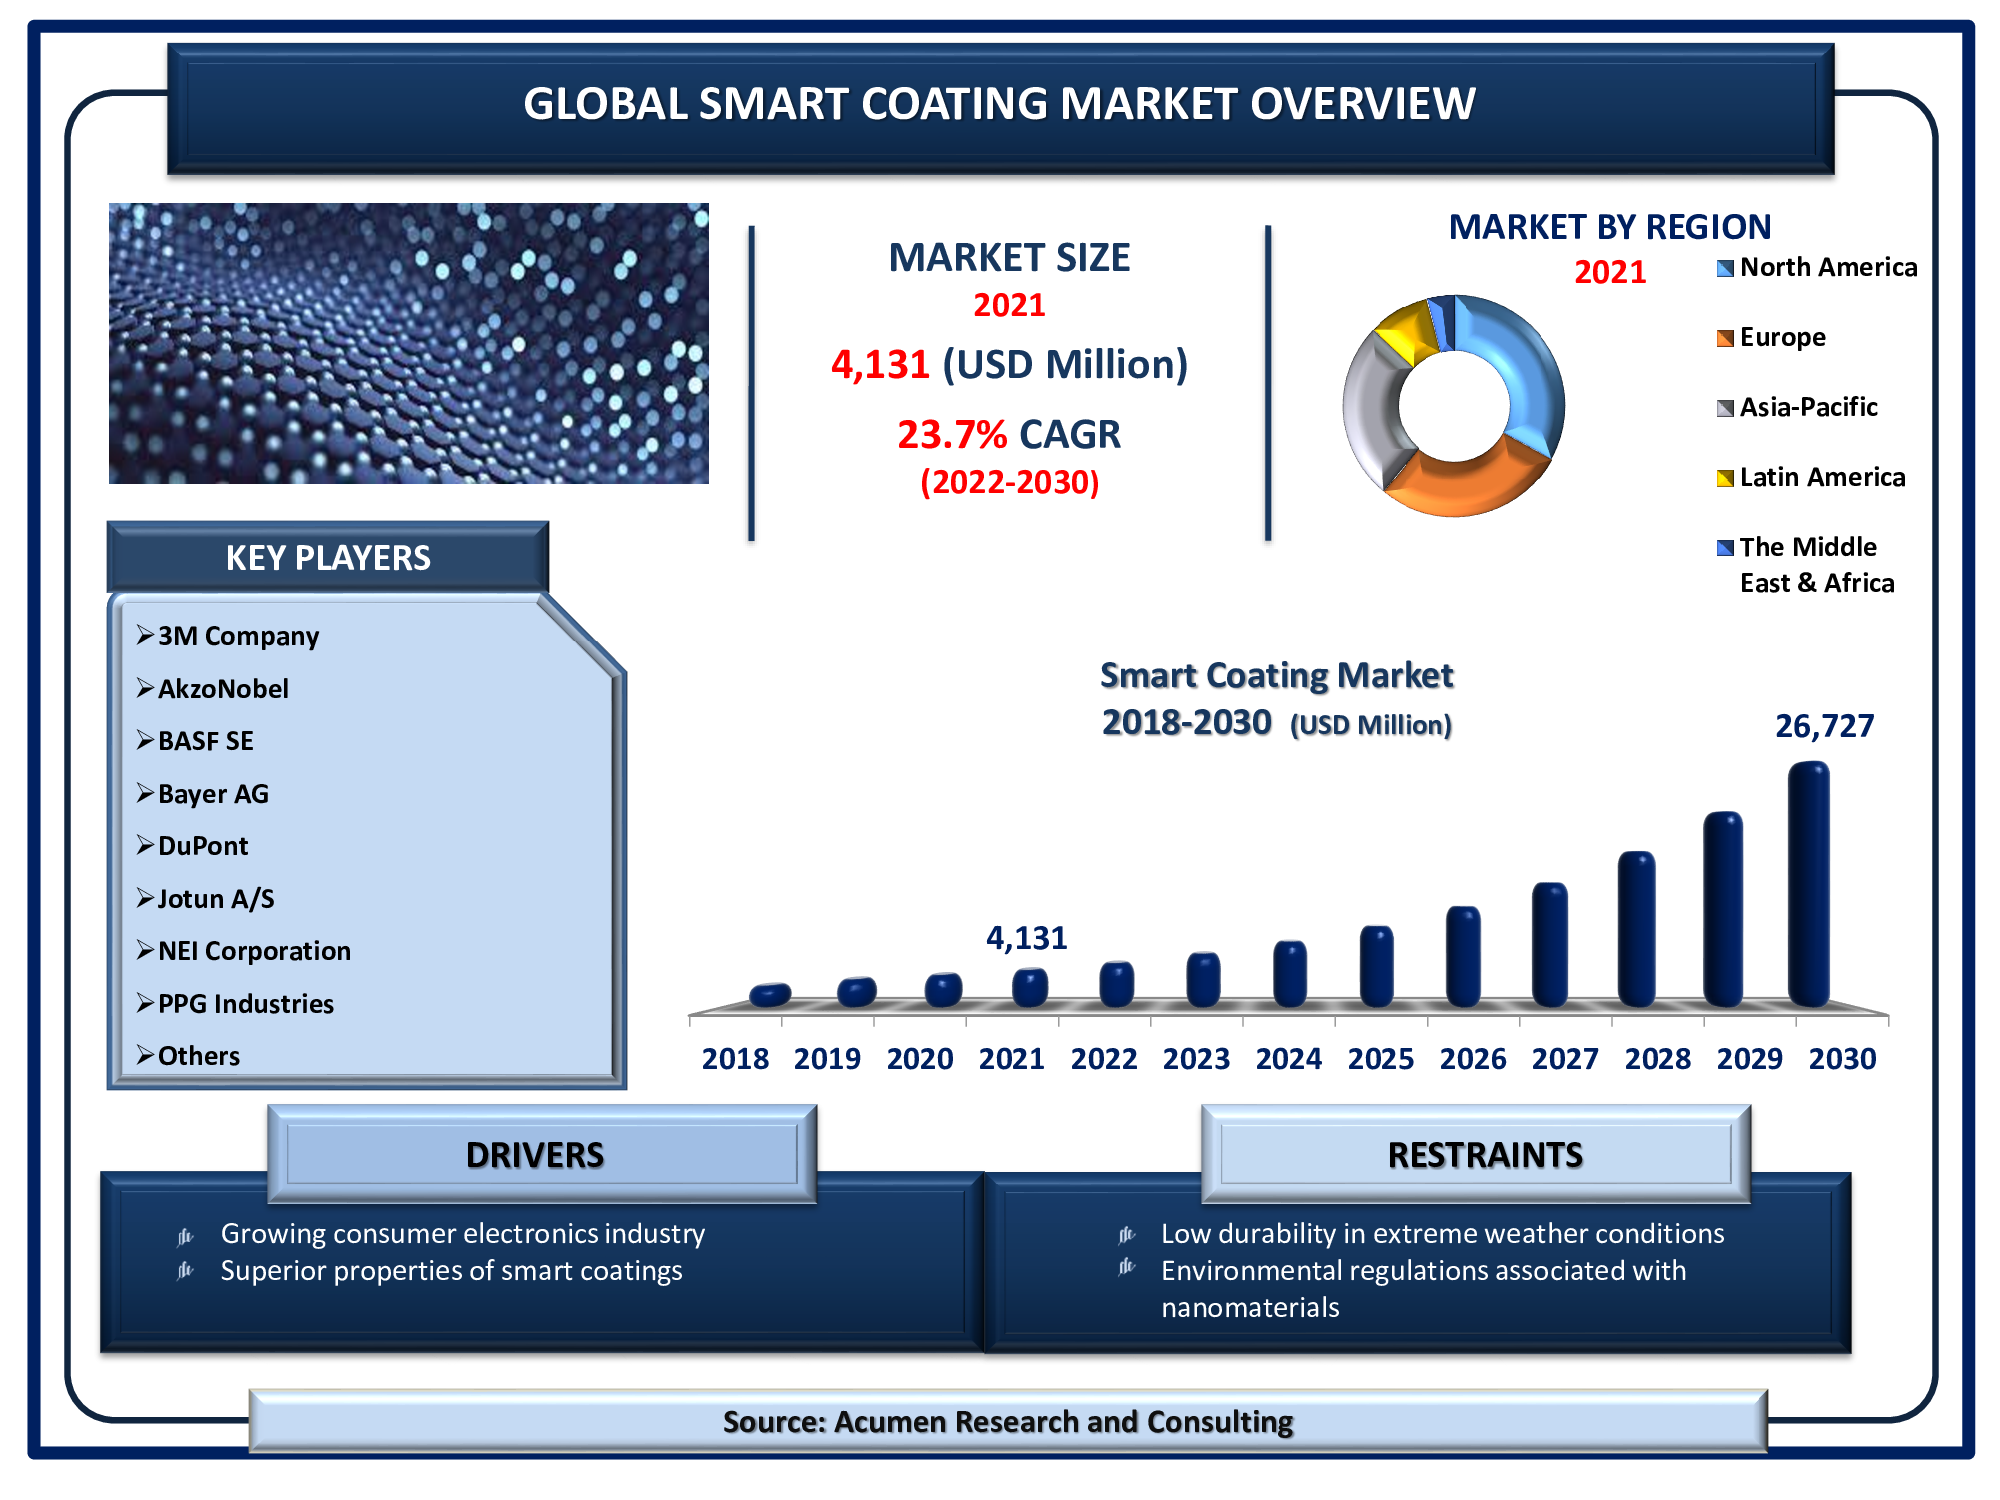
Smart coatings are made of materials that can be programmed to have a variety of chemical, physical, electrical, and mechanical properties. Smart coatings react to external conditions such as temperature, pressure, light, chemical, and other stimuli. Continuous demand for higher performance to stretch product lifetime and minimize maintenance is the primary factor boosting the smart coating market revenue. The increasing adoption of new and lightweight materials along with the growing need to enhance efficiency both for cost and environmental reasons are some of the recent smart coating market trends that are fueling the industry growth.
Global Smart Coating Market DRO’s:
Market Drivers:
- Growing consumer electronics industry
- Superior properties of smart coatings
- Increasing demand from end-use industries
Market Restraints:
- Environmental regulations associated with nanomaterials
- Low durability in extreme weather conditions
Market Opportunities:
- Growing military spending in emerging economies
- Growing R&D in the field of nanomaterials
Smart Coating Market Report Coverage
Market |
Smart Coating Market |
Smart Coating Market Size 2021 |
USD 4,131 Million |
Smart Coating Market Forecast 2030 |
USD 26,727 Million |
Smart Coating Market CAGR |
23.7% During 2022 - 2030 |
Analysis Period |
2018 - 2030 |
Base Year |
2021 |
Forecast Data |
2022 - 2030 |
Segments Covered |
By Type, By Function, By Application And By Region
|
Regional Scope |
North America, Europe, Asia Pacific, Latin America, and Middle East & Africa |
Key Companies Profiled |
3M Company, AkzoNobel, BASF SE, Bayer AG, DuPont, Jotun A/S, NEI Corporation, PPG Industries, The Dow Chemical Co., and The Sherwin-Williams Company. |
Report Coverage
|
Market Trends, Drivers, Restraints, Competitive Analysis, Player Profiling, Regulation Analysis |
Smart Coating Market Dynamics
The high demand for smart coatings in a variety of end-use industries is expected to increase market share. The growing use of smart coatings in the construction and residential sectors is driving up product demand. Smart coatings are used on a wide range of surfaces in homes, including electronic devices, glass panels, lighting fixtures, photo frames, and tabletops. Because smart coatings are more durable than traditional coatings, they are regarded as the coatings industry's future. For instance, smart nanotech coatings on surfaces can improve durability, handling, and oxidation resistance without compromising performance.
Smart coatings have smart properties such as self-healing, self-cleaning, and corrosion resistance, which has increased the demand for exterior applications in the automotive and aerospace industries. These coatings, when applied to aircraft, can detect damage to the engine or the aircraft's body. The main reason for the market's numerous industrial players is that they are deeply involved in extensive research and development processes, which ensures the factors essential for smart coating.
Extensive demand from military applications is expected to open up numerous growth opportunities for the market in the coming years. For example, they are used to improve the performance, reliability, and durability of a variety of components; to resist erosion, sliding and fretting wear, or to improve surface quality; and to enable corrosion-resistant coatings to resist exfoliation, oxidation, pitting, and hot corrosion. Over the last few years, a plethora of novel technologies has been introduced. Nanotechnologies, MEMS, polymers, composites, flexible electronics, and other advancements enable the Department of Defense to improve and develop faster, lighter, and more lethal systems.
Smart Coating Market Segmentation
The worldwide smart coating market is split based on type, function, application, and geography.
Market by Type
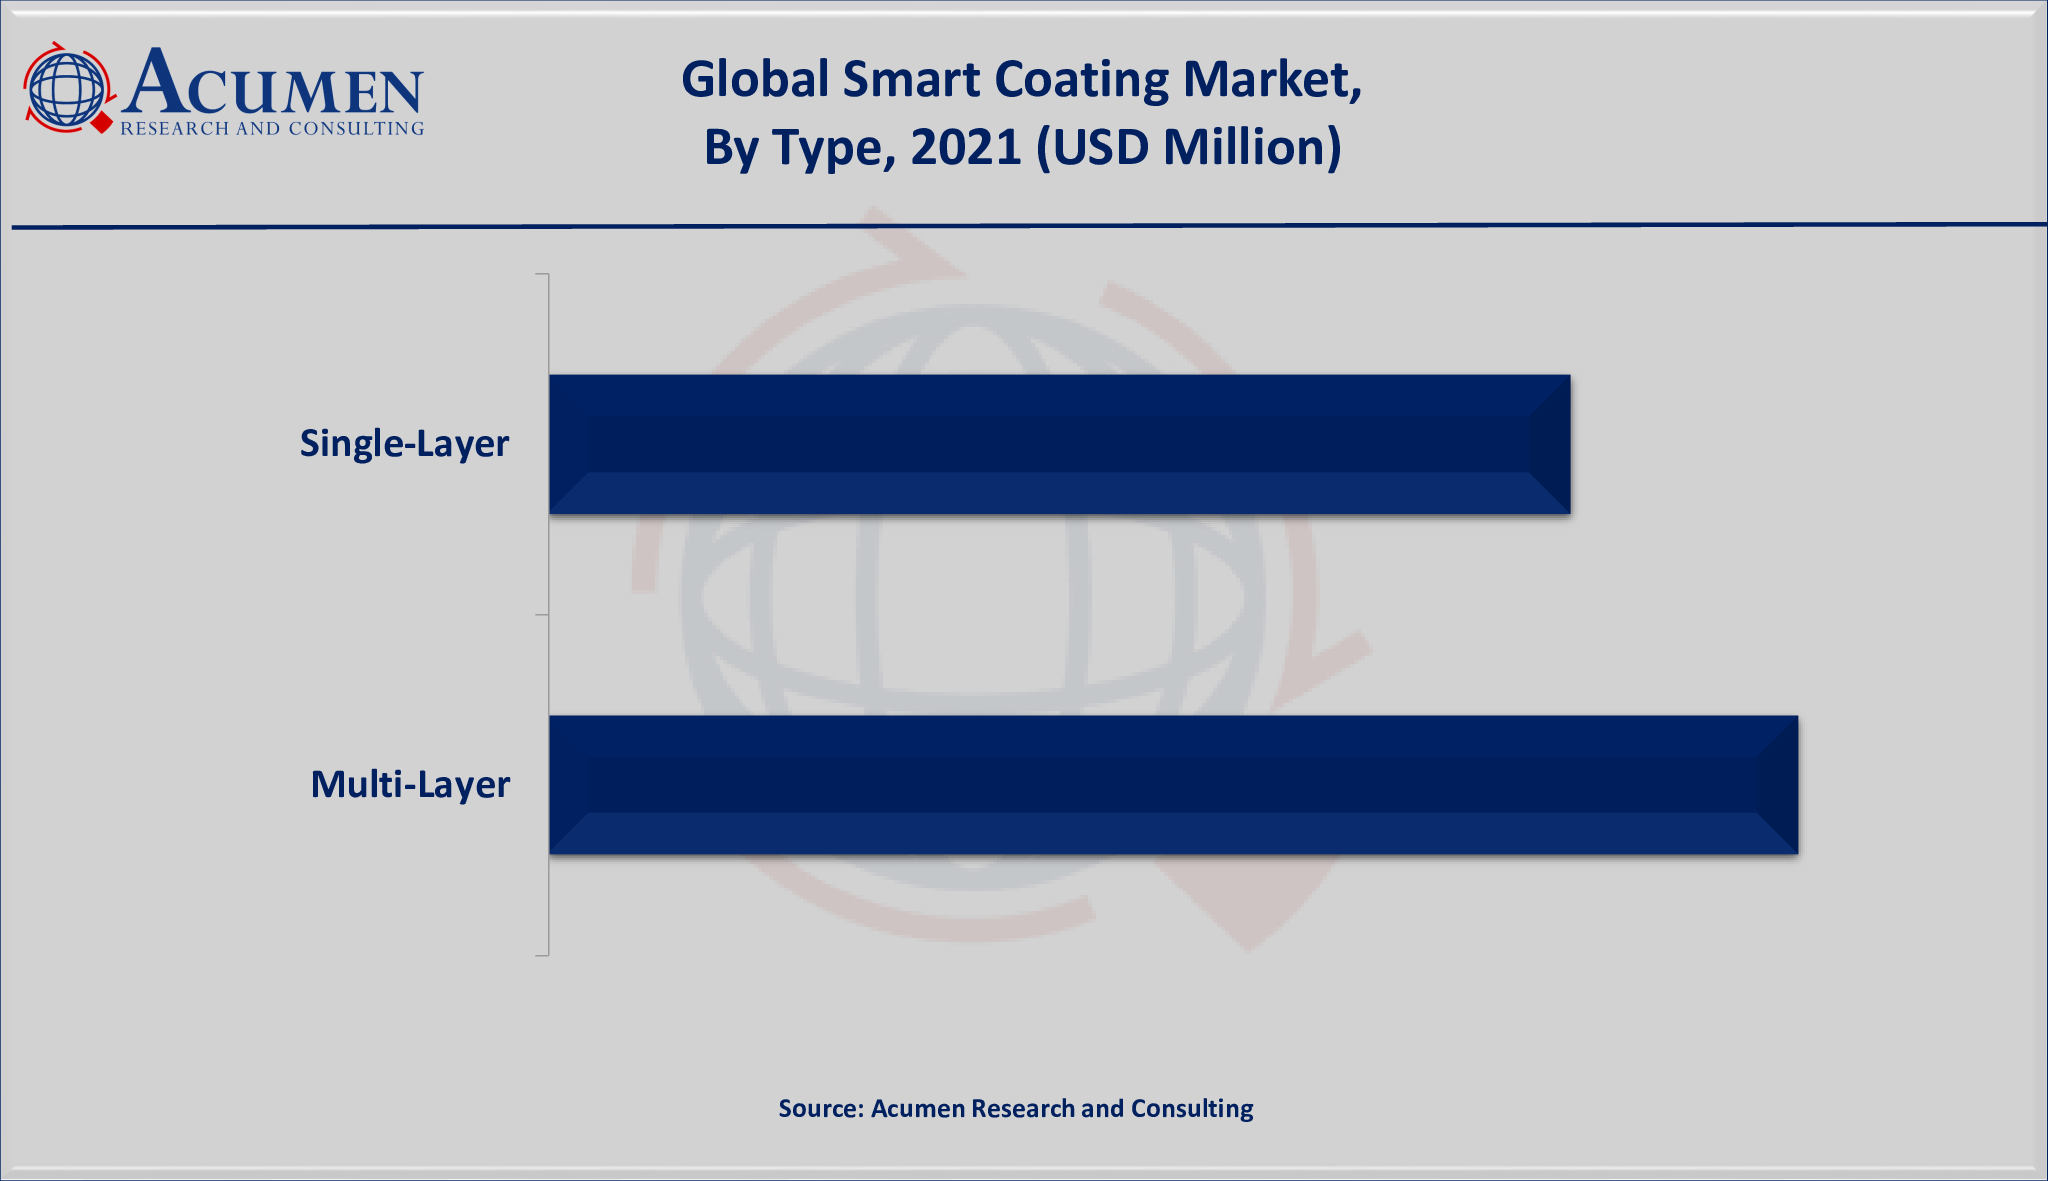
Based on our smart coatings industry analysis, the multi-layer type sub-segment is anticipated to lead the market with significant shares in 2021 and will continue to do so in the coming years. The increasing implementation of multi-layer coats for exterior applications in aerospace and automotive is expected to boost the growth of the segment. In addition to that, the growing automotive industry in emerging countries along with the technological advancements and intense research & development activities in multi-layer smart coatings are also supporting the industry growth in the coming years.
Market by Function
- Anti-Icing
- Anti-Corrosion
- Anti-Microbial
- Anti-Fouling
- Self-Healing
- Self-Cleaning
- Others
Anti-corrosion is a critical function in the global smart coatings industry. Self-cleaning and self-healing functions are also driving the smart coatings industry. Self-healing coatings are best suited to corrosion prevention, making them more applicable to surfaces that require corrosion or barrier protection. Furthermore, self-cleaning or easy-to-clean coatings based on nanotechnology have a high potential in commercial products and have the ability to reduce cleaning labor costs.
Market by Application
- Automotive
- Aerospace & Defense
- Construction
- Consumer Electronics
- Healthcare
- Others
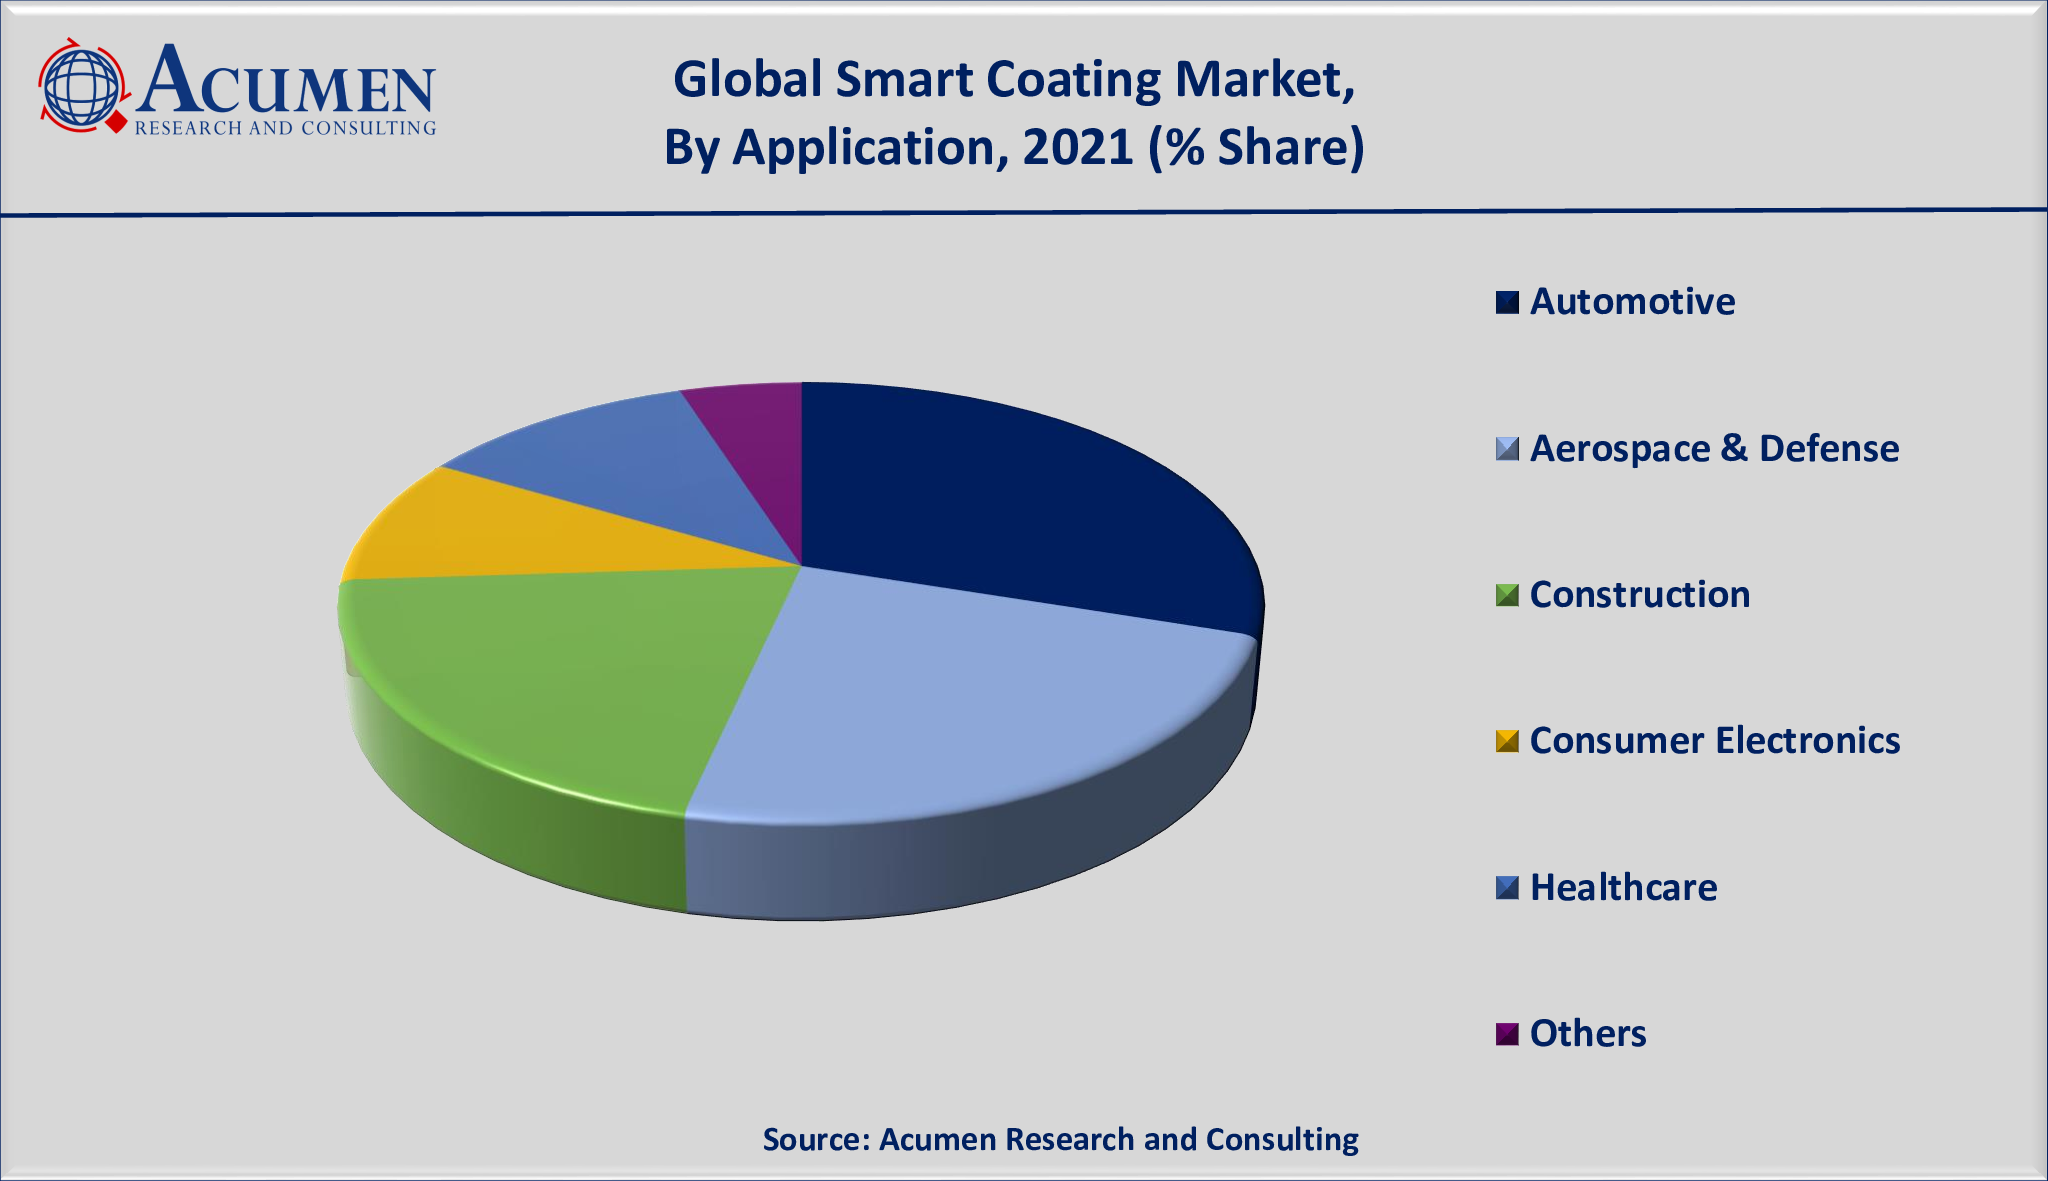
According to our smart coating market forecast, automotive and aerospace & defense will gain a significant impetus in the coming years. Smart coatings may enable scratched or rusted military vehicles to detect and repair themselves. Vehicles are also likely to change color on the battlefield, providing instant camouflage and making tanks and other military vehicles difficult to detect. On the other hand, the application in construction sectors are expected to register the fastest growth rate in the coming years.
Smart Coating Market Regional Outlook
North America
Europe
- U.K.
- Germany
- France
- Spain
- Rest of Europe
Latin America
- Mexico
- Brazil
- Rest of Latin America
Asia-Pacific
- India
- Japan
- China
- Australia
- South Korea
- Rest of Asia-Pacific
The Middle East & Africa (MEA)
- Gulf Cooperation Council (GCC)
- South Africa
- Rest of the Middle East & Africa
The presence of key players in North America fuels the regional smart coating market growth
North America is one of the leading regions in the regional industry and is likely to do so in the coming future. The increasing adoption of nanotechnology, rising application of nanomaterials, and presence of key players in the region are the supporting factors of the North American smart coating market. In addition, the use of advanced technology in infrastructure development, including industries such as military, consumer electronics, healthcare, and automotive is the main reason for the dominance of North America in the global smart coatings market.
Asia-Pacific is also one of the significant regions in the global market. The rapidly developing construction industry, increasing applications of smart coatings in the automotive industry, and surging investments in the military sector are driving the Asia-Pacific smart coating industry.
Smart Coating Market Players
Some of the top smart coating companies offered in the professional report includes 3M Company, AkzoNobel, BASF SE, Bayer AG, DuPont, Jotun A/S, NEI Corporation, PPG Industries, The Dow Chemical Co., and The Sherwin-Williams Company.
CHAPTER 1. Industry Overview of Smart Coating Market
1.1. Definition and Scope
1.1.1. Definition of Smart Coating
1.1.2. Market Segmentation
1.1.3. Years Considered for the Study
1.1.4. Assumptions and Acronyms Used
1.1.4.1. Market Assumptions and Market Forecast
1.1.4.2. Acronyms Used in Global Smart Coating Market
1.2. Summary
1.2.1. Executive Summary
1.2.2. Smart Coating Market By Type
1.2.3. Smart Coating Market By Function
1.2.4. Smart Coating Market By Application
1.2.5. Smart Coating Market By Region
CHAPTER 2. Research Approach
2.1. Methodology
2.1.1. Research Programs
2.1.2. Market Size Estimation
2.1.3. Market Breakdown and Data Triangulation
2.2. Data Source
2.2.1. Secondary Sources
2.2.2. Primary Sources
CHAPTER 3. Market Dynamics And Competition Analysis
3.1. Market Drivers
3.1.1. Driver 1
3.1.2. Driver 2
3.2. Restraints and Challenges
3.2.1. Restraint 1
3.2.2. Restraint 2
3.3. Growth Opportunities
3.3.1. Opportunity 1
3.3.2. Opportunity 2
3.4. Porter’s Five Forces Analysis
3.4.1. Bargaining Power of Suppliers
3.4.2. Bargaining Power of Buyers
3.4.3. Threat of Substitute
3.4.4. Threat of New Entrants
3.4.5. Degree of Competition
3.5. Market Concentration Ratio and Market Maturity Analysis of Smart Coating Market
3.5.1. Go To Market Strategy
3.5.1.1. Introduction
3.5.1.2. Growth
3.5.1.3. Maturity
3.5.1.4. Saturation
3.5.1.5. Possible Development
3.6. Technological Roadmap for Smart Coating Market
3.7. Value Chain Analysis
3.7.1. List of Key Manufacturers
3.7.2. List of Customers
3.7.3. Level of Integration
3.8. Cost Structure Analysis
3.8.1. Price Trend of Key Raw Materials
3.8.2. Raw Material Suppliers
3.8.3. Proportion of Manufacturing Cost Structure
3.8.3.1. Raw Material
3.8.3.2. Labor Cost
3.8.3.3. Manufacturing Expense
3.9. Regulatory Compliance
3.10. Competitive Landscape, 2021
3.10.1. Player Positioning Analysis
3.10.2. Key Strategies Adopted By Leading Players
CHAPTER 4. Manufacturing Plant Analysis
4.1. Manufacturing Plant Location and Establish Date of Major Manufacturers in 2021
4.2. R&D Status of Major Manufacturers in 2021
CHAPTER 5. Smart Coating Market By Type
5.1. Introduction
5.2. Smart Coating Revenue By Type
5.2.1. Smart Coating Revenue (USD Million) and Forecast, By Type, 2018-2030
5.2.2. Single-Layer
5.2.2.1. Single-Layer Market Revenue (USD Million) and Growth Rate (%), 2018-2030
5.2.3. Multi-Layer
5.2.3.1. Multi-Layer Market Revenue (USD Million) and Growth Rate (%), 2018-2030
CHAPTER 6. Smart Coating Market By Function
6.1. Introduction
6.2. Smart Coating Revenue By Function
6.2.1. Smart Coating Revenue (USD Million) and Forecast, By Function, 2018-2030
6.2.2. Anti-Corrosion
6.2.2.1. Anti-Corrosion Market Revenue (USD Million) and Growth Rate (%), 2018-2030
6.2.3. Anti-Icing
6.2.3.1. Anti-Icing Market Revenue (USD Million) and Growth Rate (%), 2018-2030
6.2.4. Anti-Fouling
6.2.4.1. Anti-Fouling Market Revenue (USD Million) and Growth Rate (%), 2018-2030
6.2.5. Anti-Microbial
6.2.5.1. Anti-Microbial Market Revenue (USD Million) and Growth Rate (%), 2018-2030
6.2.6. Self-Cleaning
6.2.6.1. Self-Cleaning Market Revenue (USD Million) and Growth Rate (%), 2018-2030
6.2.7. Self-Healing
6.2.7.1. Self-Healing Market Revenue (USD Million) and Growth Rate (%), 2018-2030
6.2.8. Others
6.2.8.1. Others Market Revenue (USD Million) and Growth Rate (%), 2018-2030
CHAPTER 7. Smart Coating Market By Application
7.1. Introduction
7.2. Smart Coating Revenue By Application
7.2.1. Smart Coating Revenue (USD Million) and Forecast, By Application, 2018-2030
7.2.2. Automotive
7.2.2.1. Automotive Market Revenue (USD Million) and Growth Rate (%), 2018-2030
7.2.3. Aerospace & Defense
7.2.3.1. Aerospace & Defense Market Revenue (USD Million) and Growth Rate (%), 2018-2030
7.2.4. Construction
7.2.4.1. Construction Market Revenue (USD Million) and Growth Rate (%), 2018-2030
7.2.5. Consumer Electronics
7.2.5.1. Consumer Electronics Market Revenue (USD Million) and Growth Rate (%), 2018-2030
7.2.6. Healthcare
7.2.6.1. Healthcare Market Revenue (USD Million) and Growth Rate (%), 2018-2030
7.2.7. Others
7.2.7.1. Others Market Revenue (USD Million) and Growth Rate (%), 2018-2030
CHAPTER 8. North America Smart Coating Market By Country
8.1. North America Smart Coating Market Overview
8.2. U.S.
8.2.1. U.S. Smart Coating Revenue (USD Million) and Forecast By Type, 2018-2030
8.2.2. U.S. Smart Coating Revenue (USD Million) and Forecast By Function, 2018-2030
8.2.3. U.S. Smart Coating Revenue (USD Million) and Forecast By Application, 2018-2030
8.3. Canada
8.3.1. Canada Smart Coating Revenue (USD Million) and Forecast By Type, 2018-2030
8.3.2. Canada Smart Coating Revenue (USD Million) and Forecast By Function, 2018-2030
8.3.3. Canada Smart Coating Revenue (USD Million) and Forecast By Application, 2018-2030
8.4. North America PEST Analysis
CHAPTER 9. Europe Smart Coating Market By Country
9.1. Europe Smart Coating Market Overview
9.2. U.K.
9.2.1. U.K. Smart Coating Revenue (USD Million) and Forecast By Type, 2018-2030
9.2.2. U.K. Smart Coating Revenue (USD Million) and Forecast By Function, 2018-2030
9.2.3. U.K. Smart Coating Revenue (USD Million) and Forecast By Application, 2018-2030
9.3. Germany
9.3.1. Germany Smart Coating Revenue (USD Million) and Forecast By Type, 2018-2030
9.3.2. Germany Smart Coating Revenue (USD Million) and Forecast By Function, 2018-2030
9.3.3. Germany Smart Coating Revenue (USD Million) and Forecast By Application, 2018-2030
9.4. France
9.4.1. France Smart Coating Revenue (USD Million) and Forecast By Type, 2018-2030
9.4.2. France Smart Coating Revenue (USD Million) and Forecast By Function, 2018-2030
9.4.3. France Smart Coating Revenue (USD Million) and Forecast By Application, 2018-2030
9.5. Spain
9.5.1. Spain Smart Coating Revenue (USD Million) and Forecast By Type, 2018-2030
9.5.2. Spain Smart Coating Revenue (USD Million) and Forecast By Function, 2018-2030
9.5.3. Spain Smart Coating Revenue (USD Million) and Forecast By Application, 2018-2030
9.6. Rest of Europe
9.6.1. Rest of Europe Smart Coating Revenue (USD Million) and Forecast By Type, 2018-2030
9.6.2. Rest of Europe Smart Coating Revenue (USD Million) and Forecast By Function, 2018-2030
9.6.3. Rest of Europe Smart Coating Revenue (USD Million) and Forecast By Application, 2018-2030
9.7. Europe PEST Analysis
CHAPTER 10. Asia Pacific Smart Coating Market By Country
10.1. Asia Pacific Smart Coating Market Overview
10.2. China
10.2.1. China Smart Coating Revenue (USD Million) and Forecast By Type, 2018-2030
10.2.2. China Smart Coating Revenue (USD Million) and Forecast By Function, 2018-2030
10.2.3. China Smart Coating Revenue (USD Million) and Forecast By Application, 2018-2030
10.3. Japan
10.3.1. Japan Smart Coating Revenue (USD Million) and Forecast By Type, 2018-2030
10.3.2. Japan Smart Coating Revenue (USD Million) and Forecast By Function, 2018-2030
10.3.3. Japan Smart Coating Revenue (USD Million) and Forecast By Application, 2018-2030
10.4. India
10.4.1. India Smart Coating Revenue (USD Million) and Forecast By Type, 2018-2030
10.4.2. India Smart Coating Revenue (USD Million) and Forecast By Function, 2018-2030
10.4.3. India Smart Coating Revenue (USD Million) and Forecast By Application, 2018-2030
10.5. Australia
10.5.1. Australia Smart Coating Revenue (USD Million) and Forecast By Type, 2018-2030
10.5.2. Australia Smart Coating Revenue (USD Million) and Forecast By Function, 2018-2030
10.5.3. Australia Smart Coating Revenue (USD Million) and Forecast By Application, 2018-2030
10.6. South Korea
10.6.1. South Korea Smart Coating Revenue (USD Million) and Forecast By Type, 2018-2030
10.6.2. South Korea Smart Coating Revenue (USD Million) and Forecast By Function, 2018-2030
10.6.3. South Korea Smart Coating Revenue (USD Million) and Forecast By Application, 2018-2030
10.7. Rest of Asia-Pacific
10.7.1. Rest of Asia-Pacific Smart Coating Revenue (USD Million) and Forecast By Type, 2018-2030
10.7.2. Rest of Asia-Pacific Smart Coating Revenue (USD Million) and Forecast By Function, 2018-2030
10.7.3. Rest of Asia-Pacific Smart Coating Revenue (USD Million) and Forecast By Application, 2018-2030
10.8. Asia Pacific PEST Analysis
CHAPTER 11. Latin America Smart Coating Market By Country
11.1. Latin America Smart Coating Market Overview
11.2. Brazil
11.2.1. Brazil Smart Coating Revenue (USD Million) and Forecast By Type, 2018-2030
11.2.2. Brazil Smart Coating Revenue (USD Million) and Forecast By Function, 2018-2030
11.2.3. Brazil Smart Coating Revenue (USD Million) and Forecast By Application, 2018-2030
11.3. Mexico
11.3.1. Mexico Smart Coating Revenue (USD Million) and Forecast By Type, 2018-2030
11.3.2. Mexico Smart Coating Revenue (USD Million) and Forecast By Function, 2018-2030
11.3.3. Mexico Smart Coating Revenue (USD Million) and Forecast By Application, 2018-2030
11.4. Rest of Latin America
11.4.1. Rest of Latin America Smart Coating Revenue (USD Million) and Forecast By Type, 2018-2030
11.4.2. Rest of Latin America Smart Coating Revenue (USD Million) and Forecast By Function, 2018-2030
11.4.3. Rest of Latin America Smart Coating Revenue (USD Million) and Forecast By Application, 2018-2030
11.5. Latin America PEST Analysis
CHAPTER 12. Middle East & Africa Smart Coating Market By Country
12.1. Middle East & Africa Smart Coating Market Overview
12.2. GCC
12.2.1. GCC Smart Coating Revenue (USD Million) and Forecast By Type, 2018-2030
12.2.2. GCC Smart Coating Revenue (USD Million) and Forecast By Function, 2018-2030
12.2.3. GCC Smart Coating Revenue (USD Million) and Forecast By Application, 2018-2030
12.3. South Africa
12.3.1. South Africa Smart Coating Revenue (USD Million) and Forecast By Type, 2018-2030
12.3.2. South Africa Smart Coating Revenue (USD Million) and Forecast By Function, 2018-2030
12.3.3. South Africa Smart Coating Revenue (USD Million) and Forecast By Application, 2018-2030
12.4. Rest of Middle East & Africa
12.4.1. Rest of Middle East & Africa Smart Coating Revenue (USD Million) and Forecast By Type, 2018-2030
12.4.2. Rest of Middle East & Africa Smart Coating Revenue (USD Million) and Forecast By Function, 2018-2030
12.4.3. Rest of Middle East & Africa Smart Coating Revenue (USD Million) and Forecast By Application, 2018-2030
12.5. Middle East & Africa PEST Analysis
CHAPTER 13. Player Analysis Of Smart Coating Market
13.1. Smart Coating Market Company Share Analysis
13.2. Competition Matrix
13.2.1. Competitive Benchmarking of key players by price, presence, market share, and R&D investment
13.2.2. New Product Launches and Product Enhancements
13.2.3. Mergers And Acquisition In Global Smart Coating Market
13.2.4. Partnership, Joint Ventures and Strategic Alliances/ Sales Agreements
CHAPTER 14. Company Profile
14.1. 3M Company
14.1.1. Company Snapshot
14.1.2. Business Overview
14.1.3. Financial Overview
14.1.3.1. Revenue (USD Million), 2021
14.1.3.2. 3M Company 2021 Smart Coating Business Regional Distribution
14.1.4. Product/Service and Specification
14.1.5. Recent Developments & Business Strategy
14.1.6. Manufacturing Plant Footprint Analysis
14.2. AkzoNobel
14.3. BASF SE
14.4. Bayer AG
14.5. DuPont
14.6. Jotun A/S
14.7. NEI Corporation
14.8. PPG Industries
14.9. The Dow Chemical Co.
14.10. The Sherwin-Williams Company