Smart Building Market Size - Global Industry, Share, Analysis, Trends and Forecast 2024 - 2032
Published :
Report ID:
Pages :
Format :
Smart Building Market Size - Global Industry, Share, Analysis, Trends and Forecast 2024 - 2032
Report Coverage
- Industry Dynamics
- Market Size and Forecast Data
- Segment Analysis
- Competitive Landscape
- Regional Analysis with a Niche Focus on Country-Level Data
- High Level Analysis - Porter's, PESTEL, Value Chain, etc.
- Company Profiles of Key Players
- Option to Customize the Report As Per Your Specific Need
Request Sample Report
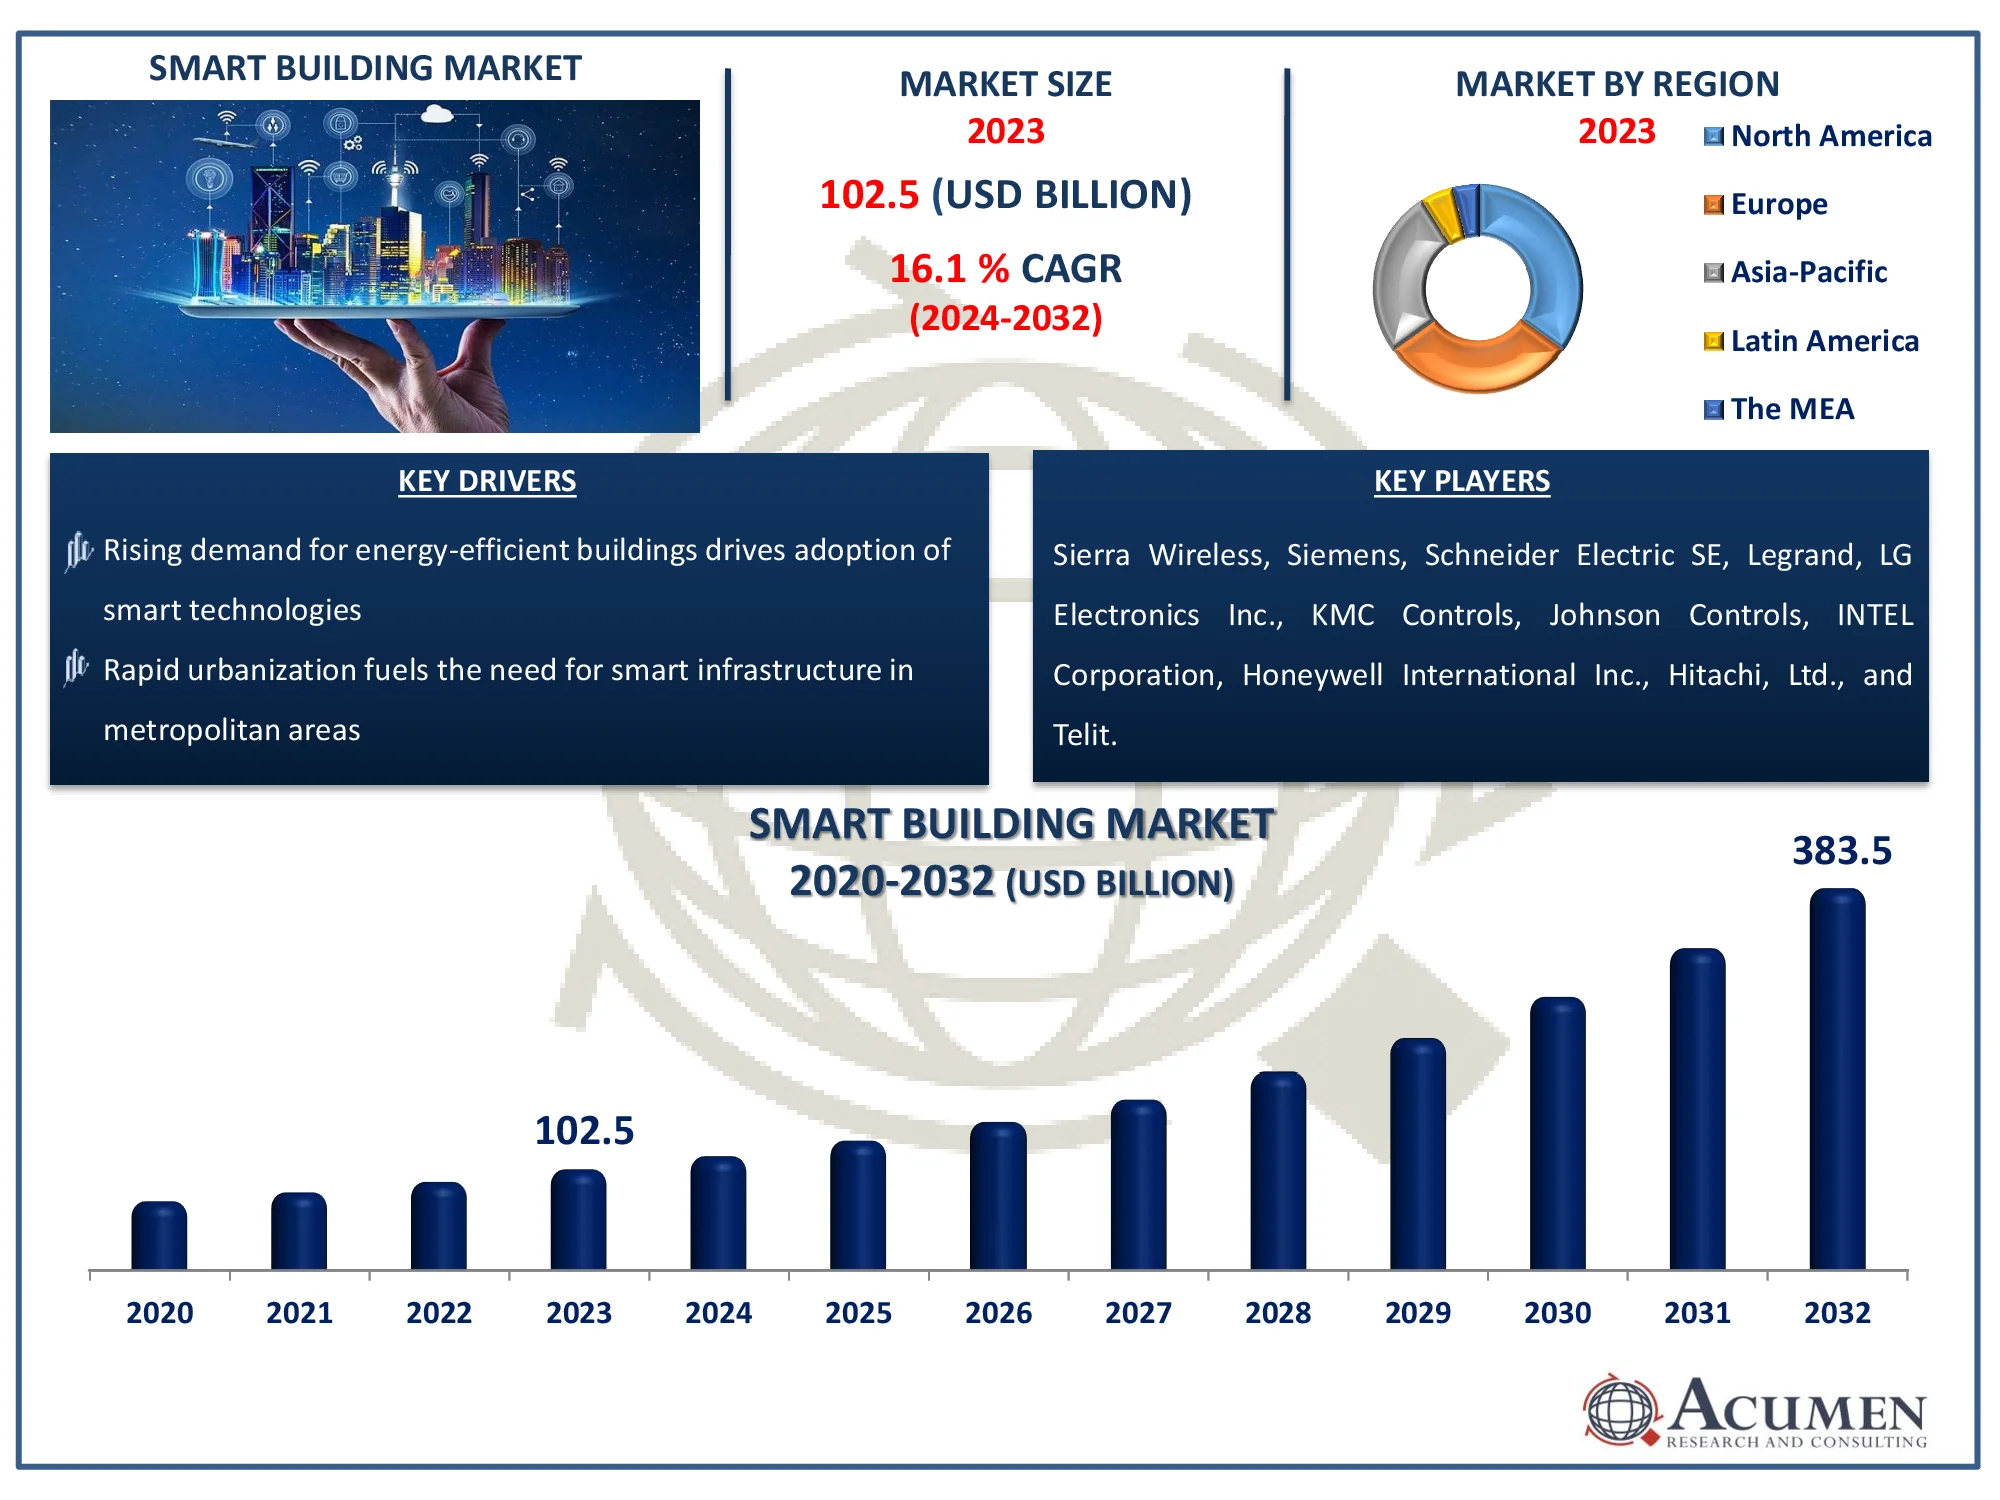
The Global Smart Building Market Size accounted for USD 102.5 Billion in 2023 and is estimated to achieve a market size of USD 383.5 Billion by 2032 growing at a CAGR of 16.1% from 2024 to 2032.
Smart Building Market Highlights
- Global smart building market revenue is poised to garner USD 383.5 billion by 2032 with a CAGR of 16.1% from 2024 to 2032
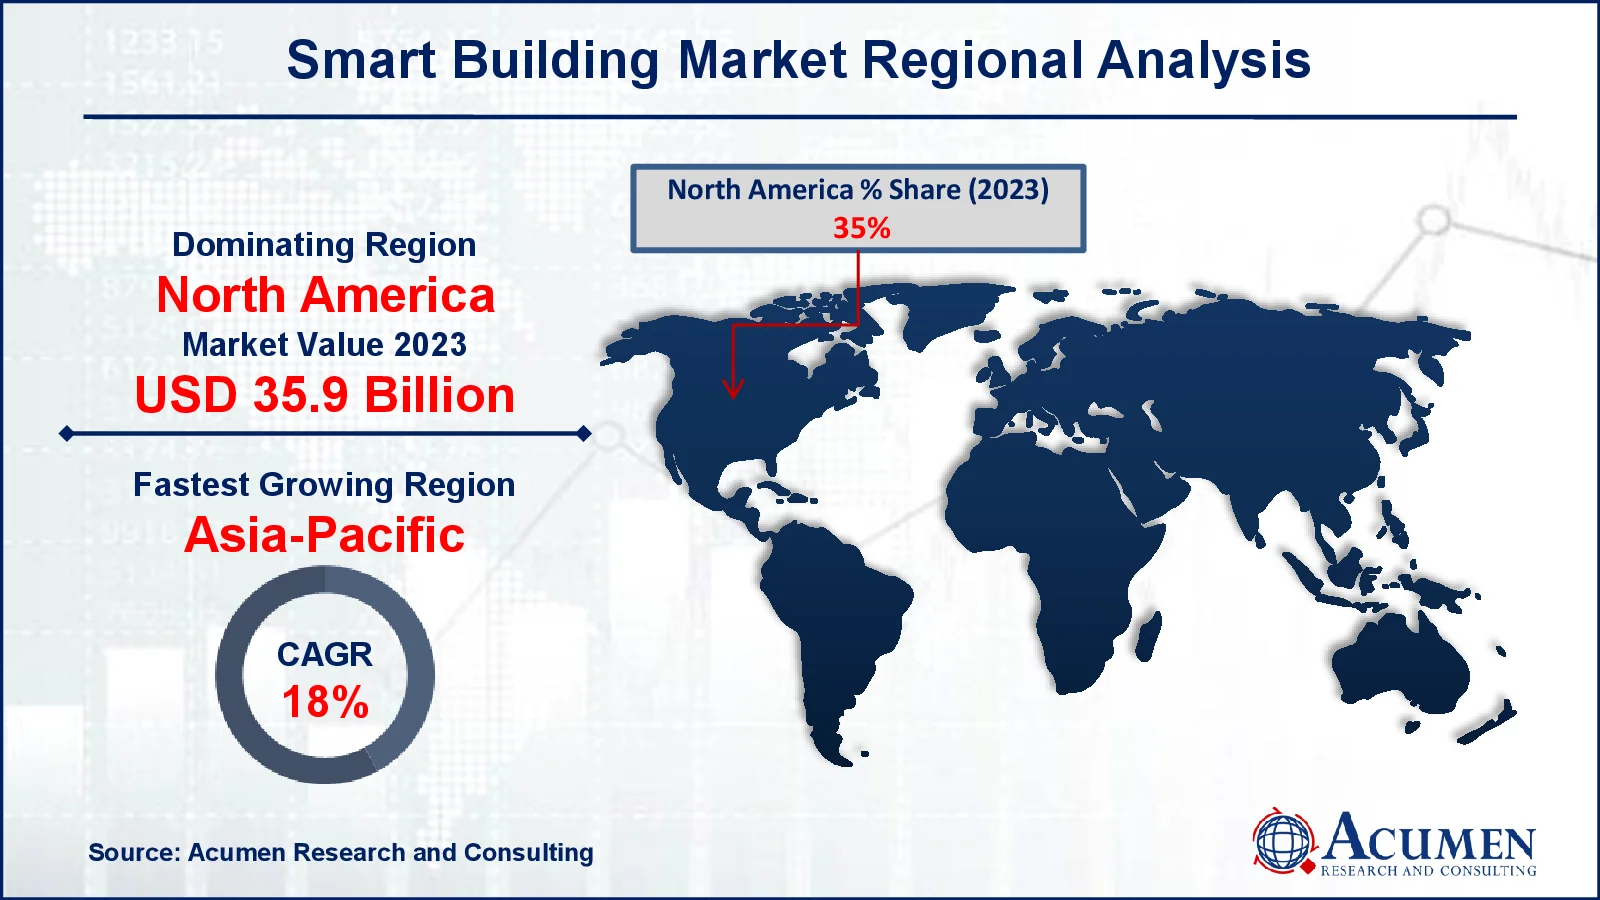
- North America smart building market value occupied around USD 35.9 billion in 2023
- Asia-Pacific smart building market growth will record a CAGR of more than 18% from 2024 to 2032
- Among service, the implementation sub-segment generated more than USD 41 billion revenue in 2023
- Based on end use, the commercial sub-segment generated around 54% smart building market share in 2023
- Rising adoption of 5G networks enhances the connectivity of smart building systems is a popular smart building market trend that fuels the industry demand

The smart building refers to the structure where all the control operations including heating, ventilation, air conditioning (HVAC), lighting, and security among others are controlled by the automated processes. A smart building uses microchips, actuators, and sensors for collecting and managing data as per the requirement. Smart building infrastructure helps owners, operators and facility managers to improve the performance and reliability of the assets, which efficiently uses the spaces, reduces energy uses and subsequently minimizes the environmental impact of buildings.
The smart buildings make the residents more comfortable with lighting, thermal comfort; air quality, physical security, and sanitation. Various types of facilities are incorporated into a smart building, which includes video surveillance system, access control system, emergency management system, energy management platform, HVAC control system, lighting control system, parking management system, smart water management system, and elevators and escalators management system.
In addition, various types of services are provided by the global players for the accomplishment of a smart building project such as consulting, system integration, deployment, support, and maintenance services. Apart from these, smart buildings have applications across commercial buildings, residential buildings, government & public infrastructure facilities, educational institutions and others.
Global Smart Building Market Dynamics
Market Drivers
- Rising demand for energy-efficient buildings drives adoption of smart technologies
- Rapid urbanization fuels the need for smart infrastructure in metropolitan areas
- Government incentives and regulations promote green and intelligent building solutions
- Growing integration of IoT and AI in building automation enhances market growth
Market Restraints
- High initial investment deters widespread adoption of smart building solutions
- Lack of technical expertise creates challenges in implementing advanced systems
- Concerns over cybersecurity and data privacy limit market penetration
Market Opportunities
- Expansion of smart cities initiatives creates lucrative opportunities for growth
- Advances in AI and machine learning foster innovation in predictive building maintenance
- Increasing focus on retrofitting older structures boosts demand for smart upgrades
Smart Building Market Report Coverage
|
Market |
Smart Building Market |
|
Smart Building Market Size 2023 |
USD 102.5 Billion |
|
Smart Building Market Forecast 2032 |
USD 383.5 Billion |
|
Smart Building Market CAGR During 2024 - 2032 |
16.1% |
|
Smart Building Market Analysis Period |
2020 - 2032 |
|
Smart Building Market Base Year |
2023 |
|
Smart Building Market Forecast Data |
2024 - 2032 |
|
Segments Covered |
By Solution, By Service, By End Use, and By Geography |
|
Regional Scope |
North America, Europe, Asia Pacific, Latin America, and Middle East & Africa |
|
Key Companies Profiled |
Sierra Wireless, Siemens, Schneider Electric SE, Legrand, LG Electronics Inc., KMC Controls, Johnson Controls, INTEL Corporation, Honeywell International Inc., Hitachi, Ltd., and Telit. |
|
Report Coverage |
Market Trends, Drivers, Restraints, Competitive Analysis, Player Profiling, Covid-19 Analysis, Regulation Analysis |
Smart Building Market Insights
The rising adoption of IoT enabled building management systems across the globe is driving smart building market growth. Rising awareness among the residents about space utilization owing to the increasing population is propelling the market growth. Increasing industry standards and regulations for building construction is further accelerating the market value. The continuously growing need for energy-efficient building solutions across the globe is stimulating the demand in the market. Increasing smart city trends in emerging economies across the globe are favoring the demand in the market. In addition, increasing government initiatives toward smart infrastructure especially in developed and developing economies are also supporting the smart building market growth.
However, the lack of cooperation among standard bodies is likely to hamper the growth over the forecast period. Lack of skilled professionals and rising privacy and security concern with the use of connected solutions is projected to be the major challenges to market growth. Furthermore, the emergence of 5G technology across the world is expected to create potential opportunities over the smart building market forecast period.
Smart Building Market Segmentation
The worldwide market for smart building is split based on solution, service, end use, and geography.
Smart Building Market By Solution
- Energy Management
- Lighting Management System
- HVAC Control System
- Others (Data Management, Asset Performance Optimization, and Application Platform)
- Safety & Security Management
- Video Surveillance System
- Access Control System
- Fire And Life Safety System
- Building Infrastructure Management
- Water Management System
- Parking Management System
- Others (Elevators and Escalators Management and Waste Management)
- Network Management
- Wireless Technology
- Wired Technology
- Integrated Workplace Management System (IWMS)
- Capital Project Management
- Real Estate Management
- Facility Management
- Environment and Energy Management
- Operations and Services Management
According to smart building industry analysis, the safety & security management category dominates the market, owing to an increased emphasis on asset and occupant safety. This section includes modern surveillance systems, access control, fire detection, and emergency response technologies, which ensure complete protection in smart buildings. The surge in cyber-physical dangers, stringent regulatory compliance requirements, and heightened awareness of safety standards have all fueled the development of these technologies. Smart technologies, such as AI-powered video analytics and IoT-enabled sensors, offer real-time monitoring and incident response, reducing risk and enhancing operational efficiency. As the number of connected devices and smart city initiatives increases, so will the demand for comprehensive safety and security solutions in intelligent buildings.
Smart Building Market By Service
- Implementation
- Consulting
- Support & Maintenance
The implementation segment leads the smart building market, accounting for the most revenue due to its crucial role in integrating sophisticated technology and solutions into building infrastructures. This sector includes the installation of hardware components including sensors, controllers, and communication systems, as well as the deployment of software platforms for real-time monitoring, automation, and analytics. The growing demand for energy-efficient systems, as well as the use of IoT, AI, and cloud-based technologies, are driving implementation services dramatically. Furthermore, specialized solutions that cover a wide range of needs, such as energy management, security, and occupant comfort, contribute to its significance. As smart building projects expand globally, particularly in the commercial and residential sectors, implementation services remain critical for constructing sustainable and intelligent building ecosystems, hence cementing their revenue leadership.
Smart Building Market By End Use
- Residential
- Industrial
- Commercial
- Academic
- Retail
- Healthcare
- Others (Hotels, Public Infrastructure, and Transport)
On the basis of building type, commercial buildings are expected to largest segment over the forecast period. The segment is also experiencing positive growth owing to the increasing need for energy-efficient solutions for reducing energy consumption without compromising comfort and security. The advantages associated with the smart building, such as less energy consumption, improve building efficiency, predictive maintenance, increased productivity, and better use of resources are further bolstering the demand of smart building in the regional market. In addition, increasing regulations on commercial infrastructure for reducing the generation of carbon and other solid wastes are further supporting the segment growth.
Smart Building Market Regional Outlook
North America
- U.S.
- Canada
Europe
- U.K.
- Germany
- France
- Spain
- Rest of Europe
Asia-Pacific
- India
- Japan
- China
- Australia
- South Korea
- Rest of Asia-Pacific
Latin America
- Brazil
- Mexico
- Rest of LATAM
The Middle East & Africa
- South Africa
- GCC Countries
- Rest of the Middle East & Africa (ME&A)

Smart Building Market Regional Analysis
North America is expected to lead the global smart building market during the forecast period. The region is considered as a developed and technologically advanced country, which is a major reason of regional growth. The region is experience growth owing to the use of latest technology solutions including data analytics, IoT, cloud computing, big data, deep learning, and artificial intelligence, for increasing occupancy comfort, saving energy, reducing operational expenditures, and meeting increasingly stringent global standards for sustainability. The governments of prominent countries including the US and Canada are investing in smarter, safer, and more sustainable buildings solutions is further propelling the regional market value. In addition, the Canadian government is taking initiatives for protecting the environment and its resources is further supporting the regional smart building market growth.
Smart Building Market Players
Some of the top smart building companies offered in our report include Sierra Wireless, Siemens, Schneider Electric SE, Legrand, LG Electronics Inc., KMC Controls, Johnson Controls, INTEL Corporation, Honeywell International Inc., Hitachi, Ltd., and Telit.
Frequently Asked Questions
How big is the smart building market?
The smart building market size was valued at USD 102.5 Billion in 2023.
What is the CAGR of the global smart building market from 2024 to 2032?
The CAGR of smart building is 16.1% during the analysis period of 2024 to 2032.
Which are the key players in the smart building market?
The key players operating in the global market are including Sierra Wireless, Siemens, Schneider Electric SE, Legrand, LG Electronics Inc., KMC Controls, Johnson Controls, INTEL Corporation, Honeywell International Inc., Hitachi, Ltd., and Telit.
Which region dominated the global smart building market share?
North America held the dominating position in smart building industry during the analysis period of 2024 to 2032.
Which region registered fastest CAGR from 2024 to 2032?
Asia-Pacific region exhibited fastest growing CAGR for market of smart building during the analysis period of 2024 to 2032.
What are the current trends and dynamics in the global smart building industry?
The current trends and dynamics in the smart building industry include rising demand for energy-efficient buildings drives adoption of smart technologies, and rapid urbanization fuels the need for smart infrastructure in metropolitan areas.
Which end use held the maximum share in 2023?
The commercial end use held the maximum share of the smart building industry.


