Sales Compensation Software Market Size - Global Industry, Share, Analysis, Trends and Forecast 2024 - 2032
Published :
Report ID:
Pages :
Format :
Sales Compensation Software Market Size - Global Industry, Share, Analysis, Trends and Forecast 2024 - 2032
Report Coverage
- Industry Dynamics
- Market Size and Forecast Data
- Segment Analysis
- Competitive Landscape
- Regional Analysis with a Niche Focus on Country-Level Data
- High Level Analysis - Porter's, PESTEL, Value Chain, etc.
- Company Profiles of Key Players
- Option to Customize the Report As Per Your Specific Need
Request Sample Report
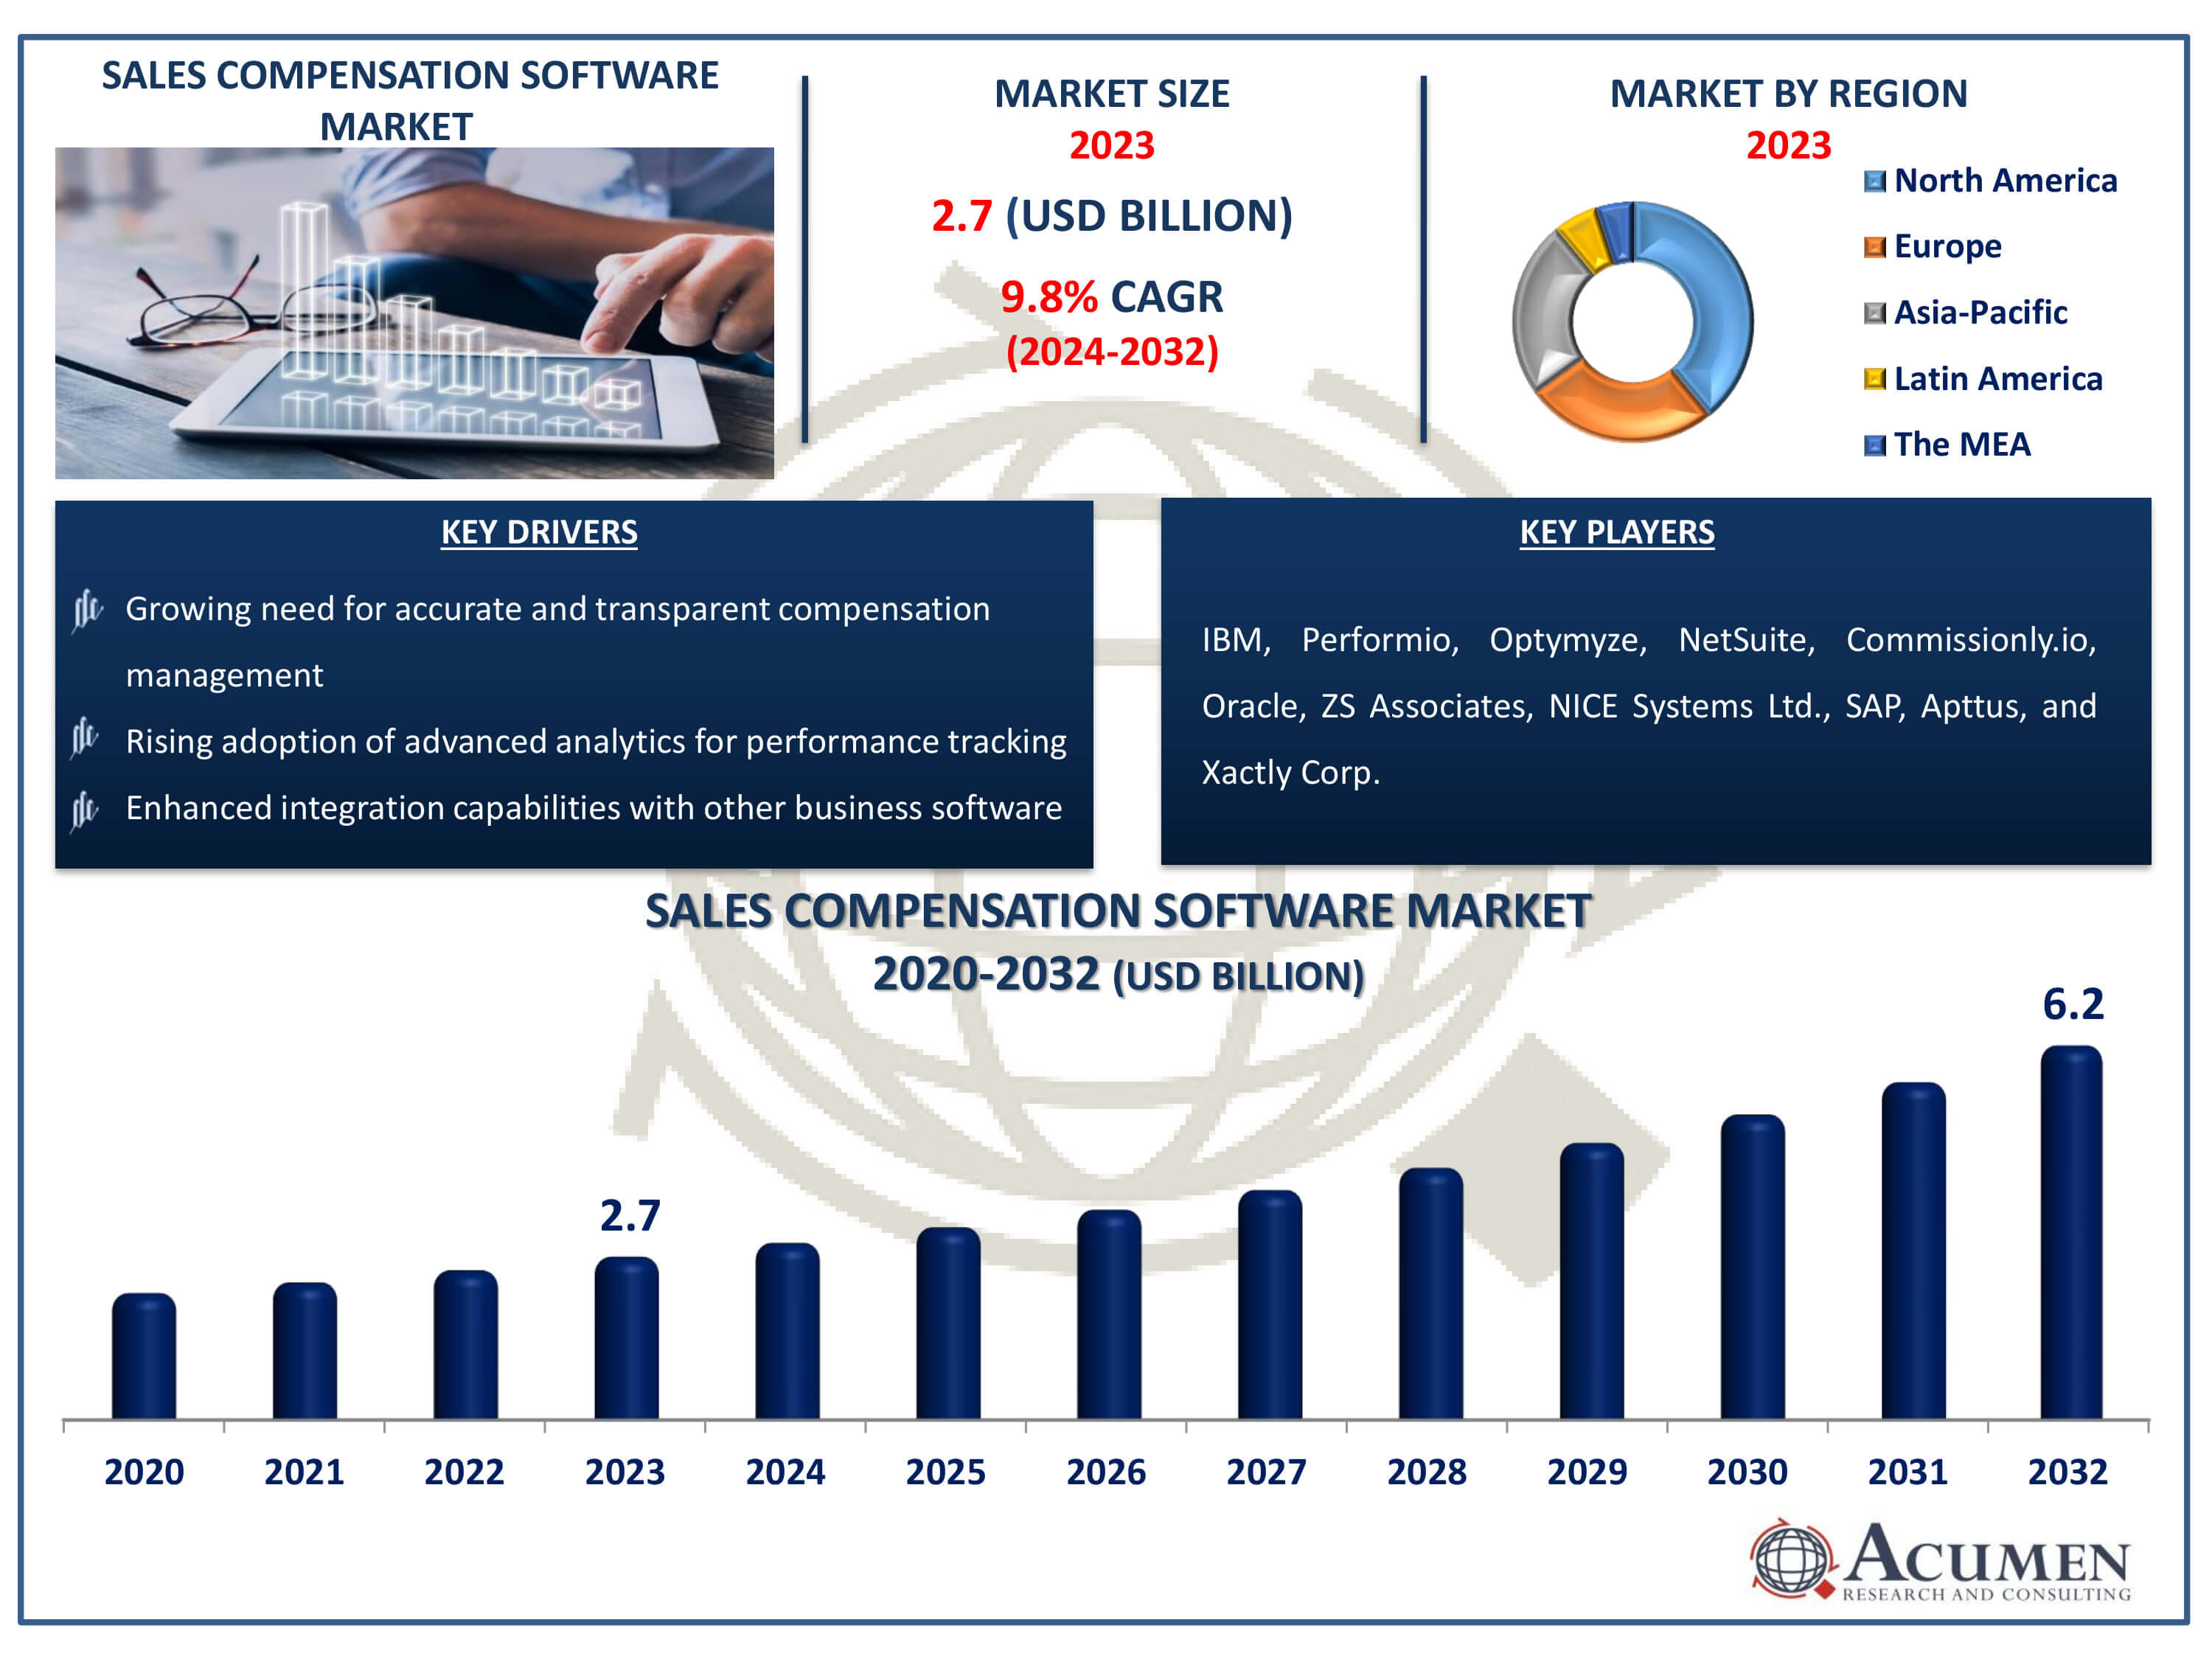
The Sales Compensation Software Market Size accounted for USD 2.7 Billion in 2023 and is estimated to achieve a market size of USD 6.2 Billion by 2032 growing at a CAGR of 9.8% from 2024 to 2032.
Sales Compensation Software Market Highlights
- Global sales compensation software market revenue is poised to garner USD 6.2 billion by 2032 with a CAGR of 9.8% from 2024 to 2032
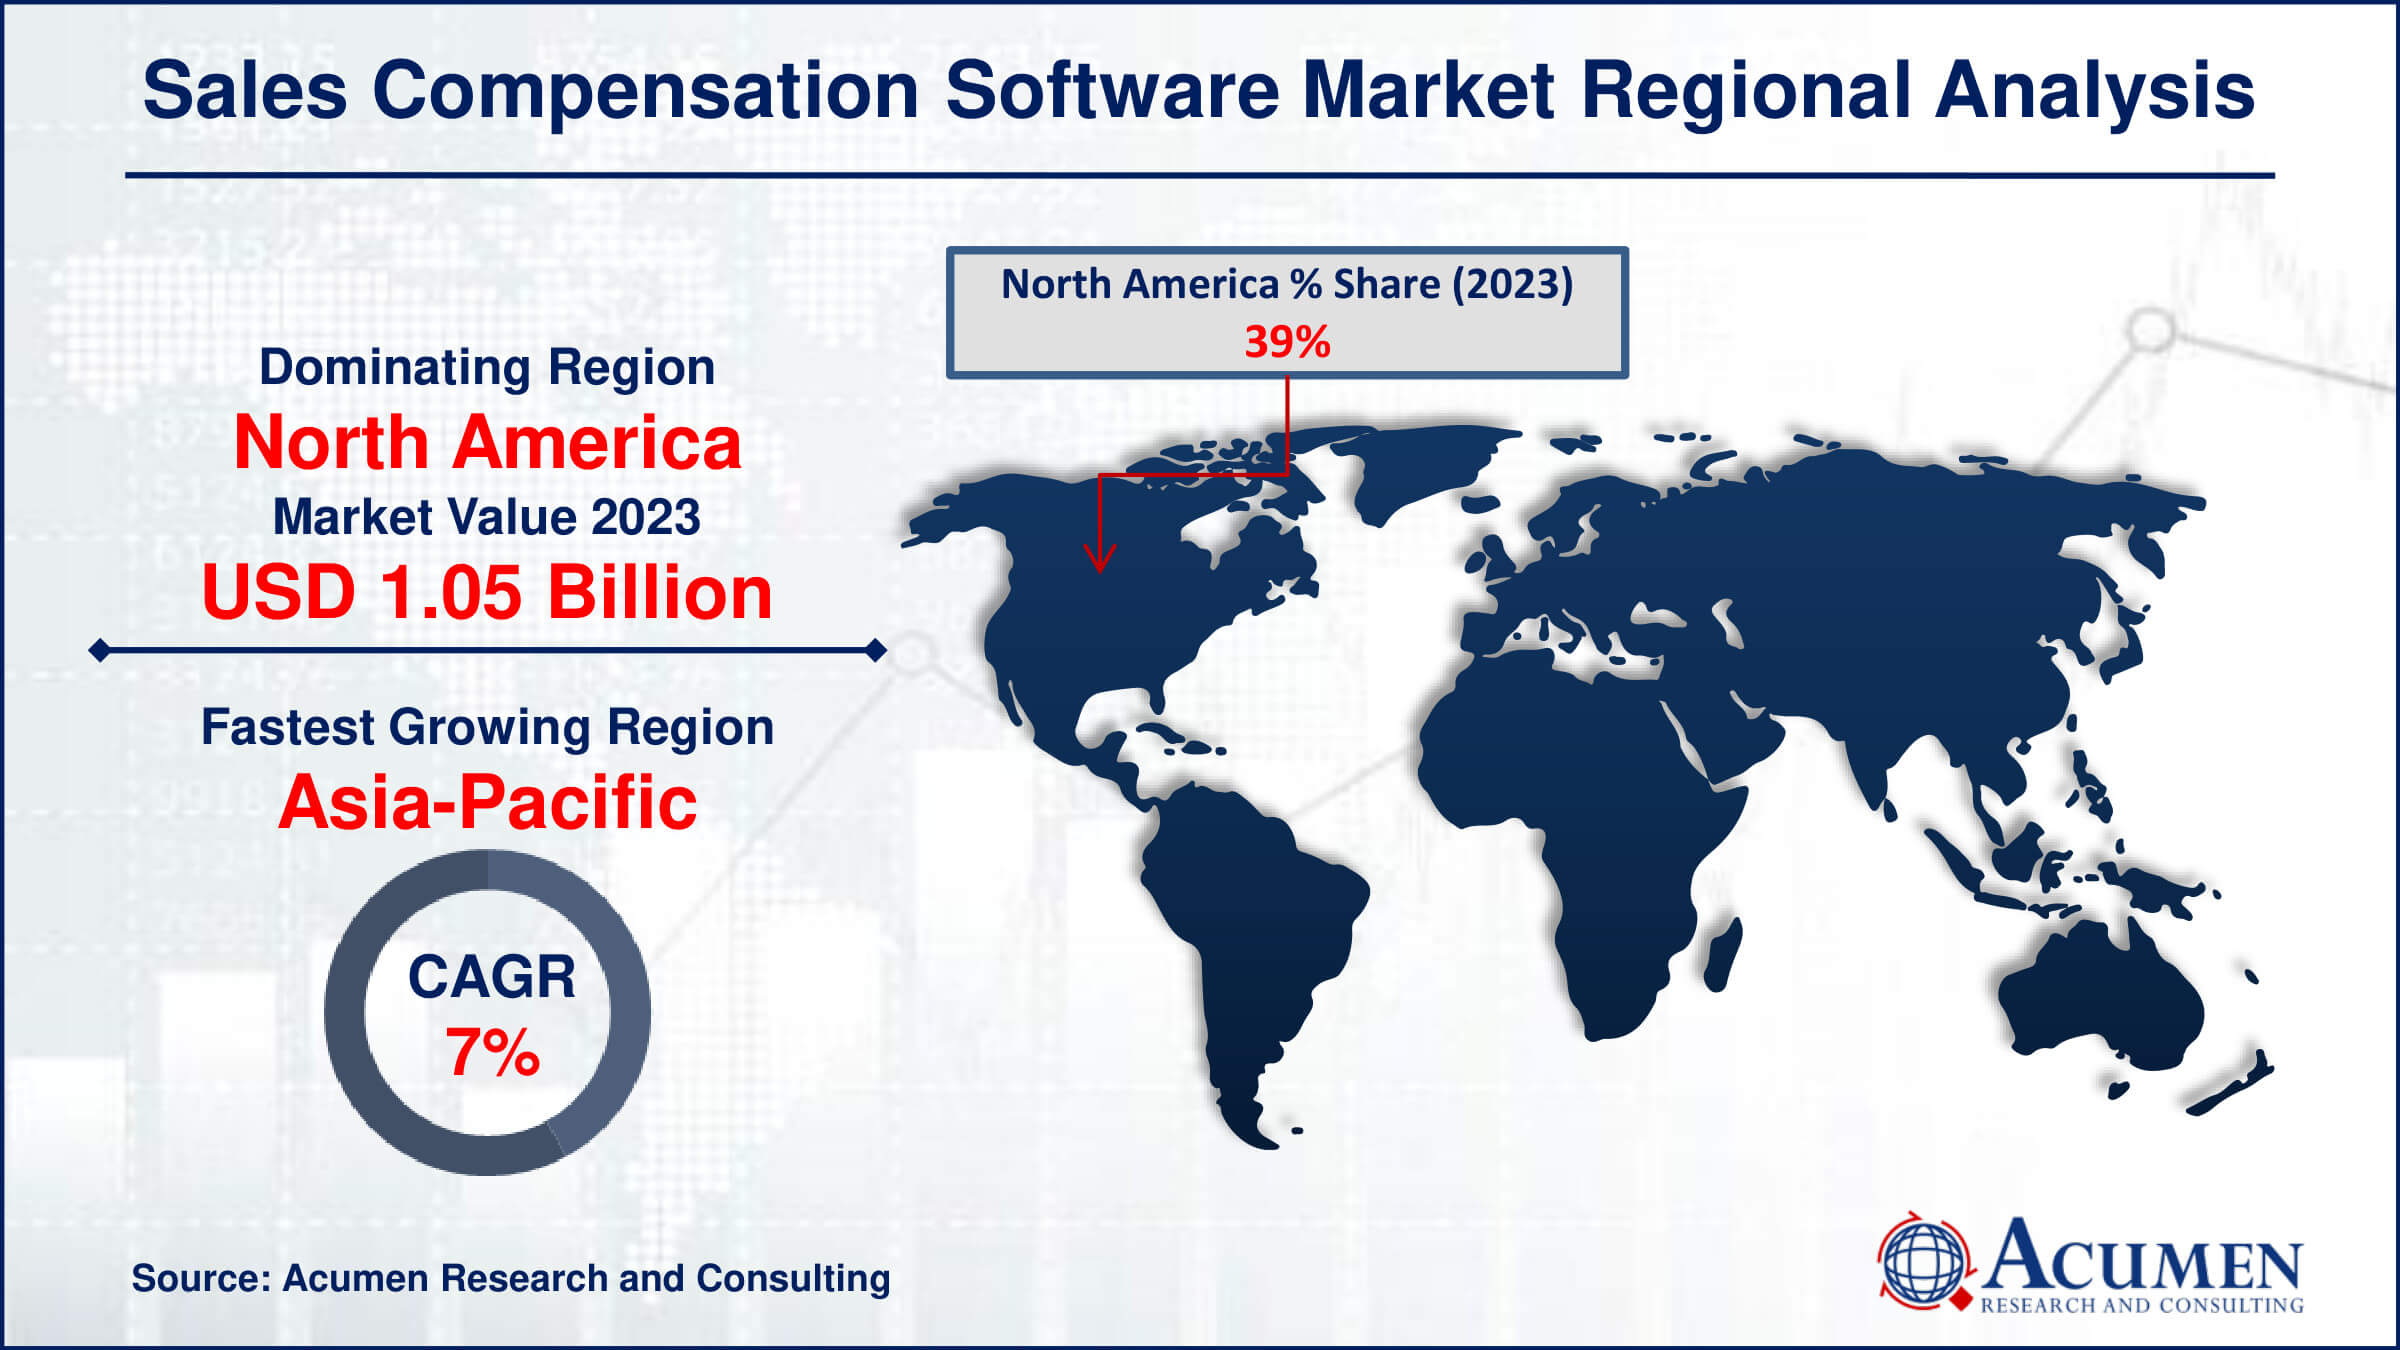
- North America sales compensation software market value occupied around USD 1.05 billion in 2023
- Asia-Pacific sales compensation software market growth will record a CAGR of more than 10.5% from 2024 to 2032
- Among enterprise size, the large enterprises sub-segment generated more than USD 1.8 billion revenue in 2023
- Based on product type, the cloud based sub-segment generated noteworthy market share in 2023
- Potential for integration with broader HR and ERP systems is a popular sales compensation software market trend that fuels the industry demand

Sales compensation encompasses the combination of salary, commission, and additional incentives designed to enhance the performance of a sales team. By utilizing target incentives within a sales force compensation plan, it generates significant value for the sales organization. Leading sales organizations particularly depend on sales compensation to boost their performance. Sales compensation software automates the accounting and administration of commissions and incentive plans based on various customizable rules, including employee role, tenure, and sale type. Typically integrated into a broader compensation software system, this software enables salespeople to track their quotas and progress, while allowing management to produce reports for high-level insights into sales performance. It is commonly used by sales, accounting, and administrative teams, and is often linked with payroll, accounting, or billing software. Additionally, sales compensation tools can be integrated with other sales-related tools, such as sales performance management, sales analytics, or sales enablement platforms.
Global Sales Compensation Software Market Dynamics
Market Drivers
- Increasing demand for automation in sales processes
- Growing need for accurate and transparent compensation management
- Rising adoption of advanced analytics for performance tracking
- Enhanced integration capabilities with other business software
Market Restraints
- High implementation and maintenance costs
- Complexity in customizing software for specific business needs
- Resistance to change from traditional compensation methods
Market Opportunities
- Expansion into emerging markets with growing sales forces
- Development of AI-driven predictive analytics features
- Increasing demand for mobile-accessible compensation tools
Sales Compensation Software Market Report Coverage
| Market | Sales Compensation Software Market |
| Sales Compensation Software Market Size 2022 | USD 2.7 Billion |
| Sales Compensation Software Market Forecast 2032 | USD 6.2 Billion |
| Sales Compensation Software Market CAGR During 2023 - 2032 | 9.8% |
| Sales Compensation Software Market Analysis Period | 2020 - 2032 |
| Sales Compensation Software Market Base Year |
2022 |
| Sales Compensation Software Market Forecast Data | 2023 - 2032 |
| Segments Covered | By Product Type, By Enterprise Size, By End-user, And By Geography |
| Regional Scope | North America, Europe, Asia Pacific, Latin America, and Middle East & Africa |
| Key Companies Profiled | IBM, Performio, Optymyze, NetSuite, Commissionly.io, Oracle, ZS Associates, NICE Systems Ltd., SAP, Apttus, and Xactly Corp. |
| Report Coverage |
Market Trends, Drivers, Restraints, Competitive Analysis, Player Profiling, Covid-19 Analysis, Regulation Analysis |
Sales Compensation Software Market Insights
The increased deployment of automation in numerous industry areas contributes considerably to market expansion. As businesses attempt to improve efficiency and accuracy in their sales operations, automation becomes increasingly important. Sales compensation software automates complex operations like calculating commissions and maintaining incentive plans, minimizing manual labor and error. This shift towards automation not only streamlines operations but also provides transparency and reliability in compensation management, making it an attractive choice for organizations wanting to maximize their sales force's performance. Market companies are always developing new and user-friendly operational tools, which drives market expansion even more. Innovations in software capabilities, such as intuitive interfaces, real-time data analytics, and customized dashboards, make these technologies more accessible and beneficial to a broader audience. These innovations address the special demands of sales teams, allowing them to properly handle quotas and incentives while giving management with detailed insights into sales success. The ongoing development of these tools guarantees that they remain relevant and successful in meeting the changing demands of the sales profession.
Technological advancements in emerging economies are driving small and medium-sized businesses (SMEs) to implement automated solutions. As these economies expand and enhance their technology infrastructure, SMEs increasingly appreciate the value of automation in maintaining competitiveness. Sales compensation software enables SMEs to manage their sales incentive programs with the same sophistication as larger firms, thereby leveling the playing field and encouraging a more competitive market. Increasing investment and favorable government policies for technology firms are driving up market value. Startups in the technology sector frequently obtain funding and support from both private investors and government programs, which promotes innovation and growth in the sales compensation software market. These startups bring innovative ideas and cutting-edge solutions that propel the market forward and extend its possibilities.
Sales Compensation Software Market Segmentation
The worldwide market for sales compensation software is split based on product type, enterprise size, end-user, and geography.
Sales Compensation Software Product Types
- Cloud Based
- Web Based
According to sales compensation software industry analysis, the cloud-based category is the largest and continues to expand significantly. Cloud-based solutions have various benefits that make them very enticing. They enable quick access to real-time data from any location, allowing sales teams to manage and track their performance more effectively. Furthermore, cloud-based software often has lower upfront costs and more flexible subscription arrangements, making it an affordable option for organizations of all sizes. Cloud solutions scalability enables businesses to modify their usage in response to changing needs without incurring major infrastructure costs. Furthermore, the service provider handles frequent updates and maintenance, ensuring that users always have access to the most recent features and security advancements, which contributes to the segment's dominant market share.
Sales Compensation Software Enterprise Size
- Large Enterprises
- Small and medium-sized enterprises (SMEs)
The sales compensation software market is dominated by large enterprise. Large corporations frequently manage large sales teams and complex pay structures, demanding sophisticated technologies to streamline these procedures. Sales compensation software's robust features meet customer needs by providing advanced analytics, connection with other corporate systems, and customizable reporting. These elements assist major firms in maintaining transparency, accuracy, and efficiency in their compensation management. Furthermore, major corporations have the financial means to invest in extensive software solutions and the IT infrastructure necessary to support them. This investment ensures that they may fully benefit from automated sales compensation systems, resulting in increased productivity and improved alignment of sales incentives with business goals.
Sales Compensation Software End-Users
- BFSI
- Healthcare
- Automotive
- Manufacturing
- IT and Telecom
- Retail
- Others
The end user category expects that the IT and telecom industry expected to grow over the sales compensation software market forecast period. This estimate is consistent with the industry's growing dependence on data-driven insights and efficient processes to improve sales performance. In the fast-paced IT and telecom sectors, where sales teams compete in changing markets and competition, effective compensation management is critical. Sales compensation software provides unique solutions to these difficulties by allowing real-time visibility into sales KPIs, incentive schemes, and performance statistics. Plus, the scalability and flexibility of these solutions meet the different needs of IT and telecom organizations, allowing them to respond rapidly to changing market conditions and successfully promote sales development. As a result, the IT and telecommunications sectors are likely to dominate the market need for sales compensation software.
Sales Compensation Software Market Regional Outlook
North America
- U.S.
- Canada
Europe
- U.K.
- Germany
- France
- Spain
- Rest of Europe
Asia-Pacific
- India
- Japan
- China
- Australia
- South Korea
- Rest of Asia-Pacific
Latin America
- Brazil
- Mexico
- Rest of Latin America
The Middle East & Africa
- South Africa
- GCC Countries
- Rest of the Middle East & Africa (ME&A)

Sales Compensation Software Market Regional Analysis
In terms of sales compensation software market analysis, in 2023, North America emerged as the dominant force in the global industry, boasting the highest revenue share (%). The region's prominence is attributed to its concentration of major developed economies heavily reliant on technology solutions. Moreover, the presence of key industry players like Anaplan, Apttus, IBM, and Iconixx further bolstered North America's market position.
Looking ahead, Asia-Pacific is set to witness exponential growth throughout the sales compensation software industry forecast period from 2024 to 2032. This surge is propelled by the rapid expansion of major developing economies such as China, India, and South Korea. Additionally, the flourishing industrial sectors including BFSI, healthcare, automotive, manufacturing, IT & telecom, and retail are significant drivers of regional market growth. The customizable features and performance analysis capabilities of sales compensation software contribute further to its adoption and expansion within the Asia Pacific market.
Sales Compensation Software Market Players
Some of the top sales compensation software companies offered in our report includes IBM, Performio, Optymyze, NetSuite, Commissionly.io, Oracle, ZS Associates, NICE Systems Ltd., SAP, Apttus, and Xactly Corp.
Frequently Asked Questions
How big is the sales compensation software market?
The sales compensation software market size was valued at USD 2.7 billion in 2023.
What is the CAGR of the global sales compensation software market from 2024 to 2032?
The CAGR of sales compensation software is 9.8% during the analysis period of 2024 to 2032.
Which are the key players in the sales compensation software market?
The key players operating in the global market are including IBM, Performio, Optymyze, NetSuite, Commissionly.io, Oracle, ZS Associates, NICE Systems Ltd., SAP, Apttus, and Xactly Corp.
Which region dominated the global sales compensation software market share?
North America held the dominating position in sales compensation software industry during the analysis period of 2024 to 2032.
Which region registered fastest CAGR from 2024 to 2032?
Asia-Pacific region exhibited fastest growing CAGR for market of sales compensation software during the analysis period of 2024 to 2032.
What are the current trends and dynamics in the global sales compensation software industry?
The current trends and dynamics in the sales compensation software industry include increasing demand for automation in sales processes, growing need for accurate and transparent compensation management, rising adoption of advanced analytics for performance tracking, and enhanced integration capabilities with other business software.
Which enterprise size held the maximum share in 2023?
The large enterprises size held the maximum share of the sales compensation software industry.


