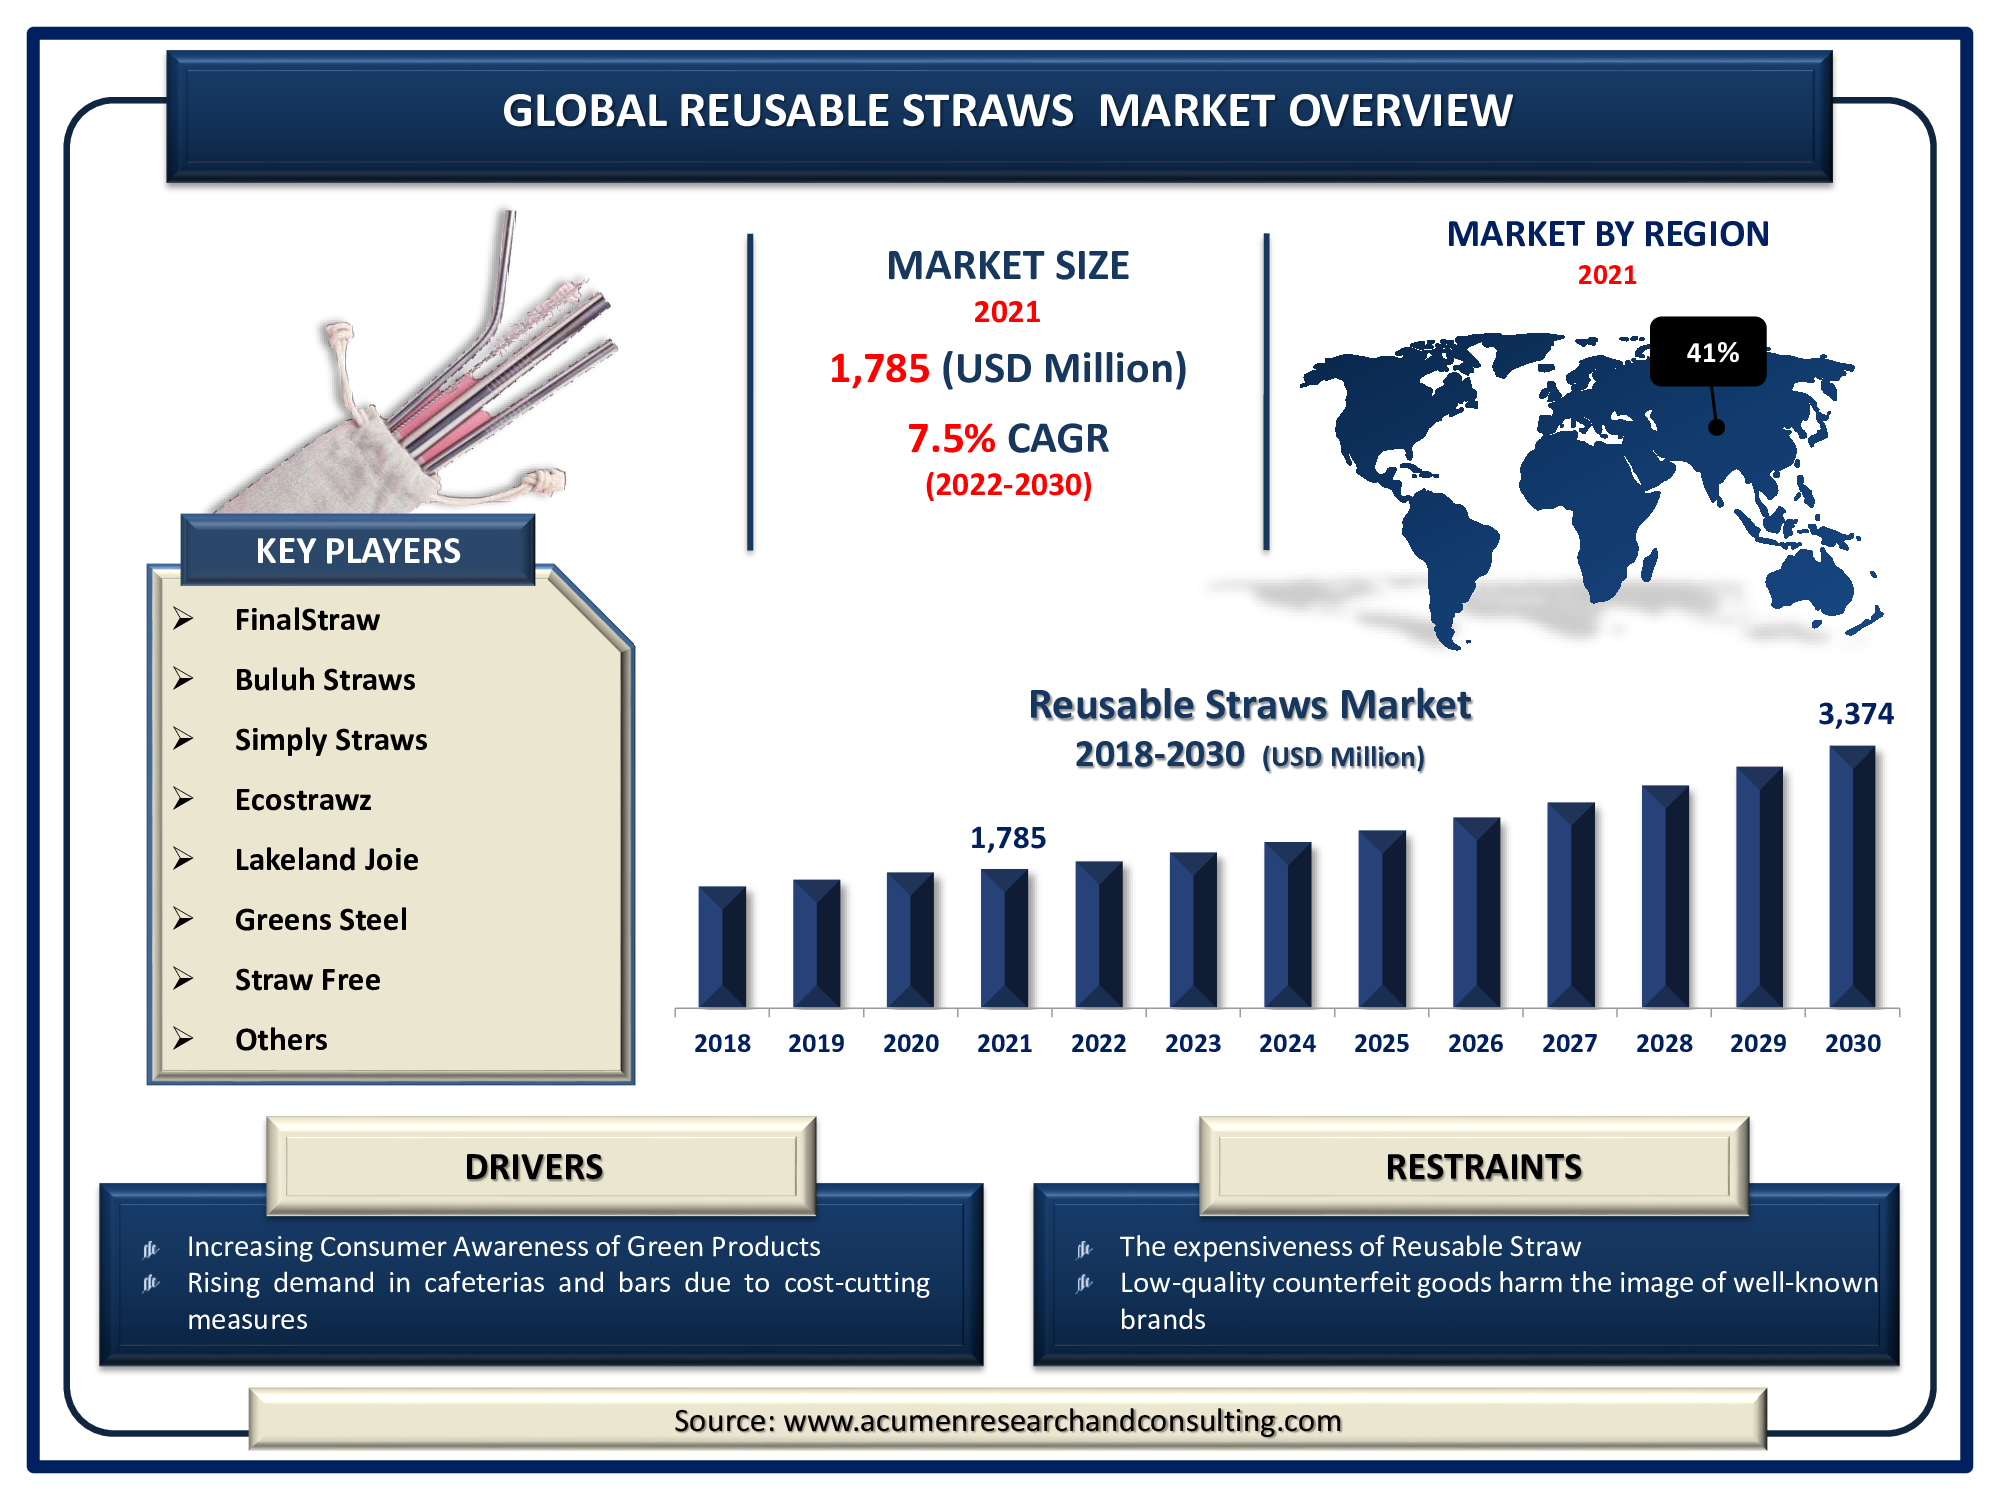
The Global Reusable Straws Market Size was valued at USD 1,785 Million in 2021 and is predicted to be worth USD 3,374 Million by 2030, with a CAGR of 7.5% from 2022 to 2030.
Reusable straw tend to be more hygienic and safe for the environment. These straws produce less waste and provide players with more effective and eficient solution to serve the customers.
Report Coverage
Market |
Reusable Straws Market |
Market Size 2021 |
USD 1,785 Million |
Market Forecast 2030 |
USD 3,374 Million |
CAGR During 2022 - 2030 |
7.5% |
Analysis Period |
2018 - 2030 |
Base Year |
2021 |
Forecast Data |
2022 - 2030 |
Segments Covered |
By Type, By End-User, By Distribution Channel, And By Geography
|
Regional Scope |
North America, Europe, Asia Pacific, Latin America, and Middle East & Africa |
Key Companies Profiled |
FinalStraw, Buluh Straws, Simply Straws, Ecostrawz, Lakeland Joie, Greens Steel, Straw Free, Waitrose, Koffie Straw, and Klean Kanteen. |
Report Coverage
|
Market Trends, Drivers, Restraints, Competitive Analysis, Player Profiling, Regulation Analysis |
Customization Scope |
10 hrs of free customization and expert consultation
|
Reusable Straws Market Dynamics
Rapid advancements in raw material used for manufacturing of straw, stringent government regulation related to use of plastic and rising awareness among consumers related to environment are major factors expected to drive the growth of global reusable straws market. Straw are widely used in beverage industry with the rise in plastic waste accumulation negatively impacting the environment demand for eco-friendly straw is increasing. The United States uses millions of single-use plastic straws a day. The use of single-use plastic per day in the US is millions. Across the globe single use plastic is a major contributor to plastic marine debris. In the five years cleanup research project the result showed nearly 7.5 million plastic straws are found on US shoreline. Globally 437 million to 8.3 billion plastic straws are found on the coastline. Plastic straw presently makes up to 99% of the global drinking straw market that is US$ 3 billion. In 2019, Bon Appétit Management, a food service company with 1,000 U.S. locations, announced it will phase out plastic straws. Starbucks plans to phase out plastic straws by 2020. McDonald’s recently announced it will ban plastic straws at its U.K outlets. This is expected to impact the growth of reusable straws market.
Factors such as fluctuating raw material prices and lack of awareness among consumers are factors expected to hamper the growth of global reusable straws market. In addition, disturbed supply chain is impacting product availability further challenging the growth of global market. However, changing government regulations, favorable business policies, and the introduction of new products from regional players are factors expected to create new opportunities for players operating in the reusable straws market over the forecast period. In addition, increasing partnership in order to strengthen the distribution channel is expected to support the revenue growth of target market.
Reusable Straws Market Segmentation
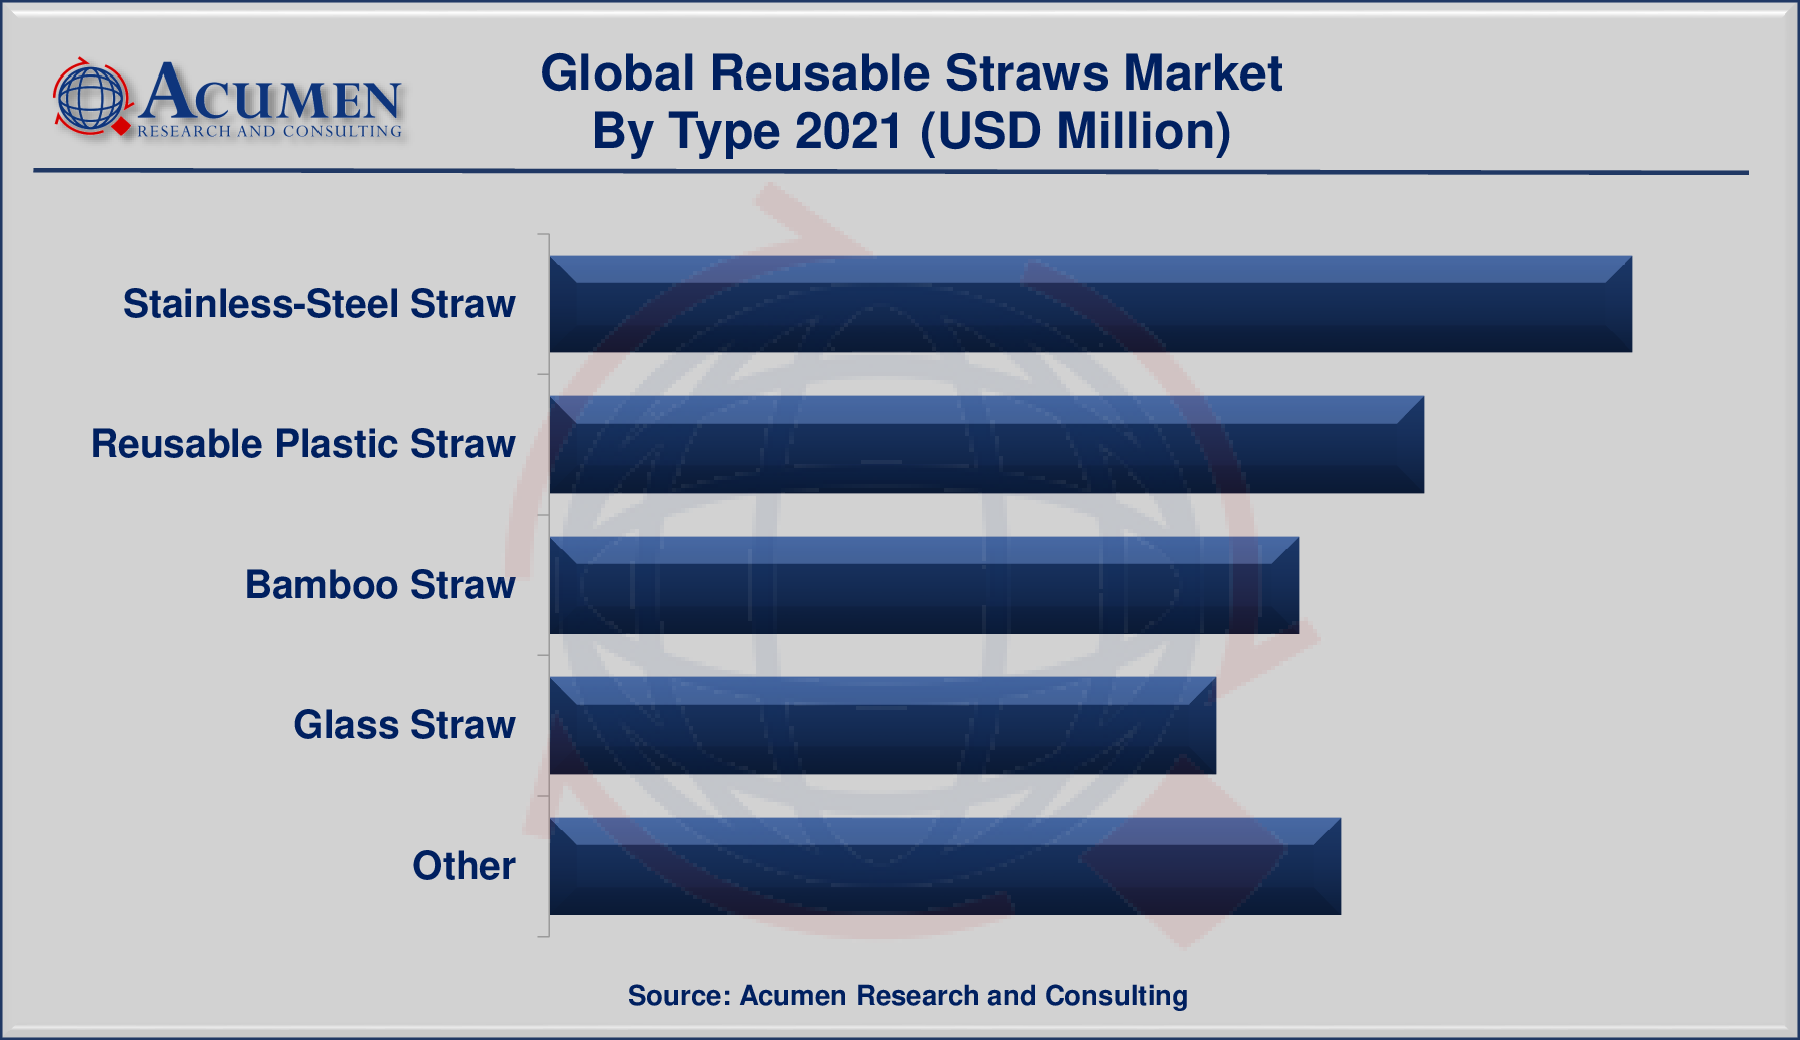
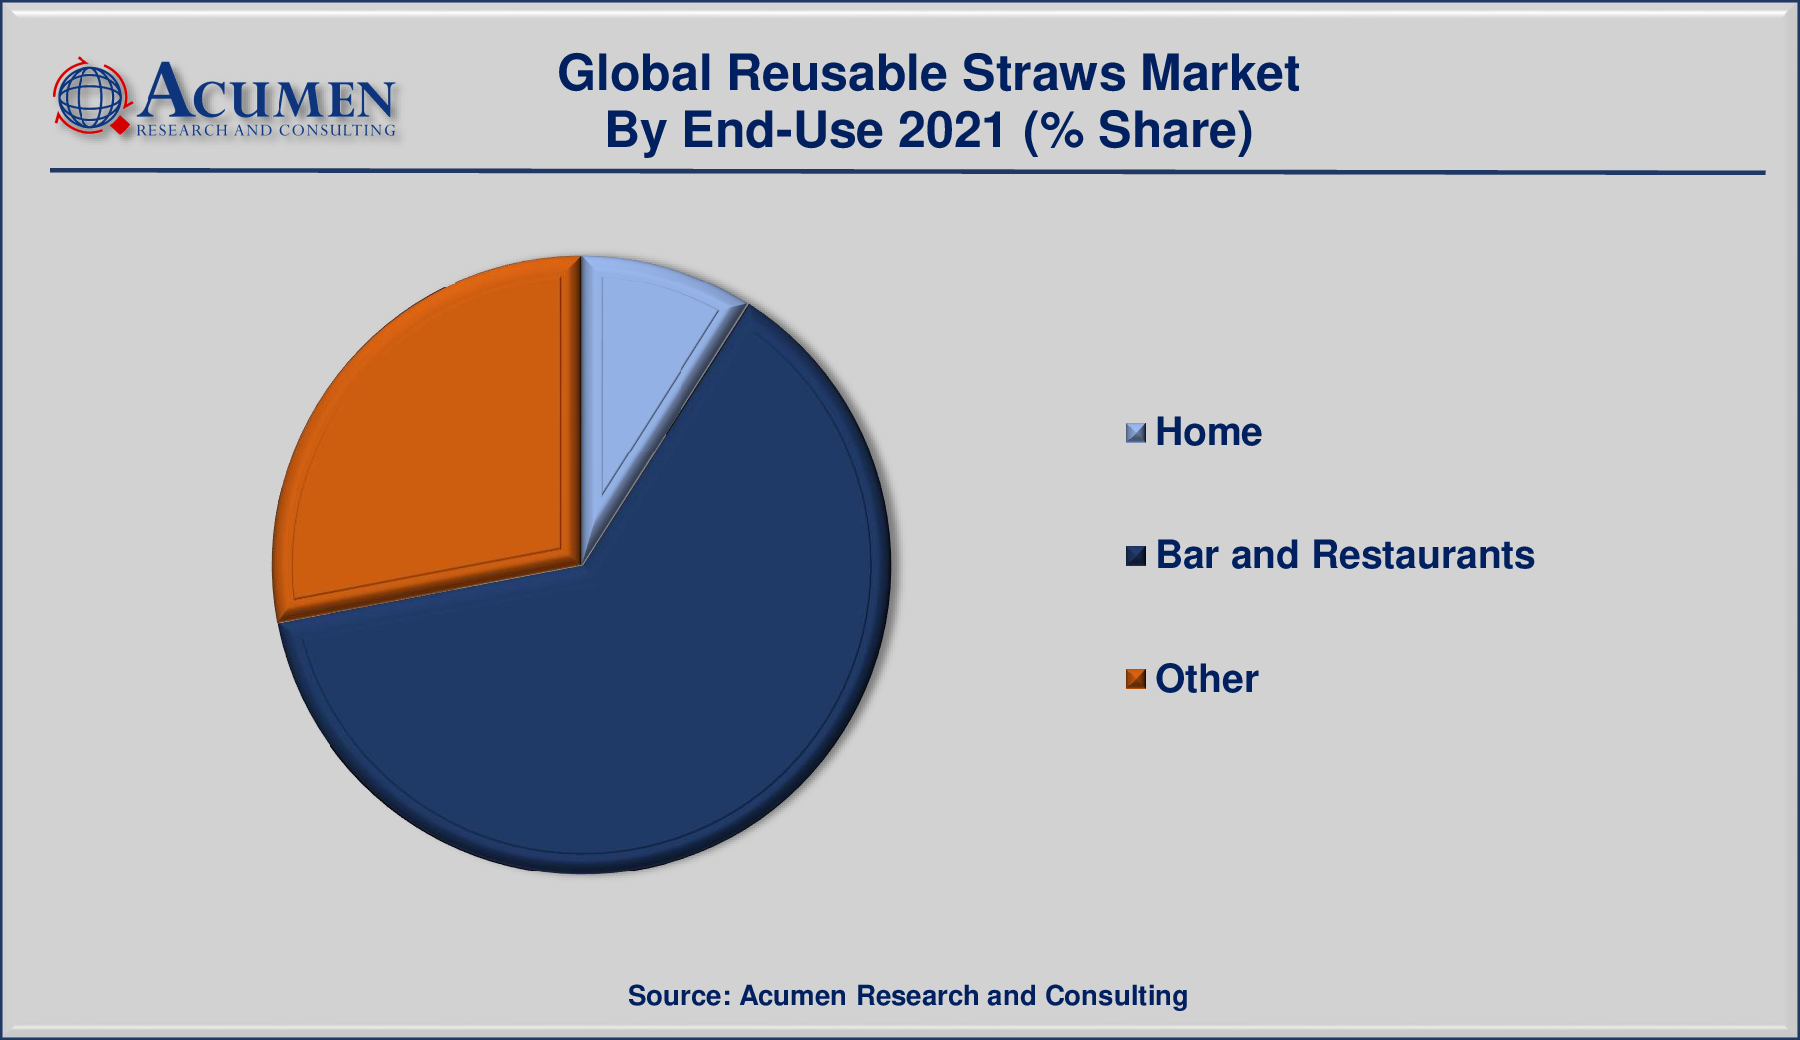
The global reusable straws market is segmented into type, end-use, and distribution channel. The type segment is divided into stainless-steel straw, reusable plastic straw, bamboo straw, glass straw, and other. Among type, the stainless-steel straw segment is expected to account for major revenue share in the global reusable straws market. The end-use segment is bifurcated into home, bar and restaurants, and other.
Market by Type
- Stainless-Steel Straw
- Reusable Plastic Straw
- Bamboo Straw
- Glass Straw
- Other
Market by End-Use
- Home
- Bar and Restaurants
- Other
Market by Distribution Channel
Reusable Straws Market Regional Outlook
North America
Europe
- U.K.
- Germany
- France
- Spain
- Rest of Europe
Latin America
- Mexico
- Brazil
- Rest of Latin America
Asia-Pacific
- India
- Japan
- China
- Australia
- South Korea
- Rest of Asia-Pacific
The Middle East & Africa (MEA)
- Gulf Cooperation Council (GCC)
- South Africa
- Rest of the Middle East & Africa
The market in North America is expected to account for major revenue share in the global reusable straws market due to ban on use of plastic from the government. Presence of large number of players operating in the country and introduction of low cost new products are factors expected to support the regional reusable straws market growth. In addition, increasing acquisition activities by players in order to increase the business presence is expected to support the market growth.
Reusable Straws Market Players
The global reusable straws market is highly competitive due to presence of large number of players and innovative product offerings. In addition, business expansion activities through partnerships and agreements are factors expected to further increase the competition. Some of the prominent global Reusable Straws market companies are FinalStraw, Buluh Straws, Simply Straws, Ecostrawz, Lakeland Joie, Greens Steel, Straw Free, Waitrose, Koffie Straw, and Klean Kanteen.
Major players are investing high for R&D activities, their approach towards enhancing the business through introduction of new products are factors expected to support the growth of reusable straws market.
In 2020, Plasticless, a straw manufacturer launched its sustainable straws that are made from grass and bamboo. Each product is handmade with high-quality organic raw materials in a clean and conducive environment. The product launch is expected to help company to enhance the business and increase the revenue share.
In 2020, DIAGEO, launched Tanqueray Straw Capsule the packaging and product innovations and designs aim to appeal to both eco- and fashion-minded consumers. This is expected to help the company attract new customers and increase the profit ratio.
In 2021, EQUO, launched drinking straws made from grass, rice, coconut, sugarcane and coffee. The rice straws are made from rice and tapioca starch and are available in plant-based colors including white, green, pink, blue and yellow. This is expected to help company enhance the business.
CHAPTER 1. Industry Overview of Reusable Straws Market
1.1. Definition and Scope
1.1.1. Definition of Reusable Straws
1.1.2. Market Segmentation
1.1.3. Years Considered for the Study
1.1.4. Assumptions and Acronyms Used
1.1.4.1. Market Assumptions and Market Forecast
1.1.4.2. Acronyms Used in Global Reusable Straws Market
1.2. Summary
1.2.1. Executive Summary
1.2.2. Reusable Straws Market By Type
1.2.3. Reusable Straws Market By End-Use
1.2.4. Reusable Straws Market By Distribution Channel
1.2.5. Reusable Straws Market By Regions
CHAPTER 2. Research Approach
2.1. Methodology
2.1.1. Research Programs
2.1.2. Market Size Estimation
2.1.3. Market Breakdown and Data Triangulation
2.2. Data Source
2.2.1. Secondary Source
2.2.2. Primary Source
CHAPTER 3. Market Dynamics And Competition Analysis
3.1. Market Drivers
3.1.1. Driver 1
3.1.2. Driver 2
3.2. Restraints and Challenges
3.2.1. Restraint 1
3.2.2. Restraint 2
3.3. Growth Opportunities
3.3.1. Opportunity 1
3.3.2. Opportunity 2
3.4. Porter’s Five Forces Analysis
3.4.1. Bargaining Power of Suppliers
3.4.2. Bargaining Power of Buyers
3.4.3. Threat of Substitute
3.4.4. Threat of New Entrants
3.4.5. Degree of Competition
3.5. Market Concentration Ratio and Market Maturity Analysis of Reusable Straws Market
3.5.1. Go To Market Strategy
3.5.1.1. Introduction
3.5.1.2. Growth
3.5.1.3. Maturity
3.5.1.4. Saturation
3.5.1.5. Possible Development
3.6. Technological Roadmap for Reusable Straws Market
3.7. Value Chain Analysis
3.7.1. List of Key Manufacturers
3.7.2. List of Customers
3.7.3. Level of Integration
3.8. Regulatory Compliance
3.9. Cost Structure Analysis
3.9.1. Price Trend of Key Raw Materials
3.9.2. Raw Material Suppliers
3.9.3. Proportion of Manufacturing Cost Structure
3.9.3.1. Raw Material Cost
3.9.3.2. Labor Cost
3.9.3.3. Manufacturing Expense
3.10. Competitive Landscape, 2021
3.10.1. Player Positioning Analysis
3.10.2. Key Strategies Adopted By Leading Players
CHAPTER 4. Manufacturing Plant Analysis
4.1. Manufacturing Plant Location and Establish Date of Major Manufacturers in 2021
4.1.1. R&D Status of Major Manufacturers in 2021
CHAPTER 5. Reusable Straws Market Revenue By Type
5.1. Introduction
5.2. Reusable Straws Market Revenue (USD Million) By Type
5.2.1. Reusable Straws Market Revenue (USD Million) and Forecast By Type, 2018-2030
5.2.2. Stainless-Steel Straw
5.2.2.1. Stainless-Steel Straw Market Revenue (USD Million) and Growth Rate (%), 2018-2030
5.2.3. Reusable Plastic Straw
5.2.3.1. Reusable Plastic Straw Market Revenue (USD Million) and Growth Rate (%), 2018-2030
5.2.4. Bamboo Straw
5.2.4.1. Bamboo Straw Market Revenue (USD Million) and Growth Rate (%), 2018-2030
5.2.5. Glass Straw
5.2.5.1. Glass Straw Market Revenue (USD Million) and Growth Rate (%), 2018-2030
5.2.6. Others
5.2.6.1. Others Market Revenue (USD Million) and Growth Rate (%), 2018-2030
CHAPTER 6. Reusable Straws Market Revenue By End-Use
6.1. Introduction
6.2. Reusable Straws Market Revenue (USD Million) By End-Use
6.2.1. Reusable Straws Market Revenue (USD Million) and Forecast By End-Use, 2018-2030
6.2.2. Home
6.2.2.1. Home Market Revenue (USD Million) and Growth Rate (%), 2018-2030
6.2.3. Bar and Restaurants
6.2.3.1. Bar and Restaurants Market Revenue (USD Million) and Growth Rate (%), 2018-2030
6.2.4. Other
6.2.4.1. Other Market Revenue (USD Million) and Growth Rate (%), 2018-2030
CHAPTER 7. Reusable Straws Market Revenue By Distribution Channel
7.1. Introduction
7.2. Reusable Straws Market Revenue (USD Million) By Distribution Channel
7.2.1. Reusable Straws Market Revenue (USD Million) and Forecast By Distribution Channel, 2018-2030
7.2.2. Offline
7.2.2.1. Offline Market Revenue (USD Million) and Growth Rate (%), 2018-2030
7.2.3. Others
7.2.3.1. Others Market Revenue (USD Million) and Growth Rate (%), 2018-2030
CHAPTER 8. North America Reusable Straws Market By Country
8.1. North America Reusable Straws Market Overview
8.2. U.S.
8.2.1. U.S. Reusable Straws Market Revenue (USD Million) and Forecast By Type, 2018-2030
8.2.2. U.S. Reusable Straws Market Revenue (USD Million) and Forecast By End-Use, 2018-2030
8.2.3. U.S. Reusable Straws Market Revenue (USD Million) and Forecast By Distribution Channel, 2018-2030
8.3. Canada
8.3.1. Canada Reusable Straws Market Revenue (USD Million) and Forecast By Type, 2018-2030
8.3.2. Canada Reusable Straws Market Revenue (USD Million) and Forecast By End-Use, 2018-2030
8.3.3. Canada Reusable Straws Market Revenue (USD Million) and Forecast By Distribution Channel, 2018-2030
8.4. North America PEST Analysis
CHAPTER 9. Europe Reusable Straws Market By Country
9.1. Europe Reusable Straws Market Overview
9.2. U.K.
9.2.1. U.K. Reusable Straws Market Revenue (USD Million) and Forecast By Type, 2018-2030
9.2.2. U.K. Reusable Straws Market Revenue (USD Million) and Forecast By End-Use, 2018-2030
9.2.3. U.K. Reusable Straws Market Revenue (USD Million) and Forecast By Distribution Channel, 2018-2030
9.3. Germany
9.3.1. Germany Reusable Straws Market Revenue (USD Million) and Forecast By Type, 2018-2030
9.3.2. Germany Reusable Straws Market Revenue (USD Million) and Forecast By End-Use, 2018-2030
9.3.3. Germany Reusable Straws Market Revenue (USD Million) and Forecast By Distribution Channel, 2018-2030
9.4. France
9.4.1. France Reusable Straws Market Revenue (USD Million) and Forecast By Type, 2018-2030
9.4.2. France Reusable Straws Market Revenue (USD Million) and Forecast By End-Use, 2018-2030
9.4.3. France Reusable Straws Market Revenue (USD Million) and Forecast By Distribution Channel, 2018-2030
9.5. Spain
9.5.1. Spain Reusable Straws Market Revenue (USD Million) and Forecast By Type, 2018-2030
9.5.2. Spain Reusable Straws Market Revenue (USD Million) and Forecast By End-Use, 2018-2030
9.5.3. Spain Reusable Straws Market Revenue (USD Million) and Forecast By Distribution Channel, 2018-2030
9.6. Rest of Europe
9.6.1. Rest of Europe Reusable Straws Market Revenue (USD Million) and Forecast By Type, 2018-2030
9.6.2. Rest of Europe Reusable Straws Market Revenue (USD Million) and Forecast By End-Use, 2018-2030
9.6.3. Rest of Europe Reusable Straws Market Revenue (USD Million) and Forecast By Distribution Channel, 2018-2030
9.7. Europe PEST Analysis
CHAPTER 10. Asia-Pacific Reusable Straws Market By Country
10.1. Asia-Pacific Reusable Straws Market Overview
10.2. China
10.2.1. China Reusable Straws Market Revenue (USD Million) and Forecast By Type, 2018-2030
10.2.2. China Reusable Straws Market Revenue (USD Million) and Forecast By End-Use, 2018-2030
10.2.3. China Reusable Straws Market Revenue (USD Million) and Forecast By Distribution Channel, 2018-2030
10.3. Japan
10.3.1. Japan Reusable Straws Market Revenue (USD Million) and Forecast By Type, 2018-2030
10.3.2. Japan Reusable Straws Market Revenue (USD Million) and Forecast By End-Use, 2018-2030
10.3.3. Japan Reusable Straws Market Revenue (USD Million) and Forecast By Distribution Channel, 2018-2030
10.4. India
10.4.1. India Reusable Straws Market Revenue (USD Million) and Forecast By Type, 2018-2030
10.4.2. India Reusable Straws Market Revenue (USD Million) and Forecast By End-Use, 2018-2030
10.4.3. India Reusable Straws Market Revenue (USD Million) and Forecast By Distribution Channel, 2018-2030
10.5. Australia
10.5.1. Australia Reusable Straws Market Revenue (USD Million) and Forecast By Type, 2018-2030
10.5.2. Australia Reusable Straws Market Revenue (USD Million) and Forecast By End-Use, 2018-2030
10.5.3. Australia Reusable Straws Market Revenue (USD Million) and Forecast By Distribution Channel, 2018-2030
10.6. South Korea
10.6.1. South Korea Reusable Straws Market Revenue (USD Million) and Forecast By Type, 2018-2030
10.6.2. South Korea Reusable Straws Market Revenue (USD Million) and Forecast By End-Use, 2018-2030
10.6.3. South Korea Reusable Straws Market Revenue (USD Million) and Forecast By Distribution Channel, 2018-2030
10.7. Rest of Asia-Pacific
10.7.1. Rest of Asia-Pacific Reusable Straws Market Revenue (USD Million) and Forecast By Type, 2018-2030
10.7.2. Rest of Asia-Pacific Reusable Straws Market Revenue (USD Million) and Forecast By End-Use, 2018-2030
10.7.3. Rest of Asia-Pacific Reusable Straws Market Revenue (USD Million) and Forecast By Distribution Channel, 2018-2030
10.8. Asia Pacific PEST Analysis
CHAPTER 11. Latin America Reusable Straws Market By Country
11.1. Latin America Reusable Straws Market Overview
11.2. Brazil
11.2.1. Brazil Reusable Straws Market Revenue (USD Million) and Forecast By Type, 2018-2030
11.2.2. Brazil Reusable Straws Market Revenue (USD Million) and Forecast By End-Use, 2018-2030
11.2.3. Brazil Reusable Straws Market Revenue (USD Million) and Forecast By Distribution Channel, 2018-2030
11.3. Mexico
11.3.1. Mexico Reusable Straws Market Revenue (USD Million) and Forecast By Type, 2018-2030
11.3.2. Mexico Reusable Straws Market Revenue (USD Million) and Forecast By End-Use, 2018-2030
11.3.3. Mexico Reusable Straws Market Revenue (USD Million) and Forecast By Distribution Channel, 2018-2030
11.4. Rest of Latin America
11.4.1. Rest of Latin America Reusable Straws Market Revenue (USD Million) and Forecast By Type, 2018-2030
11.4.2. Rest of Latin America Reusable Straws Market Revenue (USD Million) and Forecast By End-Use, 2018-2030
11.4.3. Rest of Latin America Reusable Straws Market Revenue (USD Million) and Forecast By Distribution Channel, 2018-2030
11.5. Latin America PEST Analysis
CHAPTER 12. Middle East & Africa Reusable Straws Market By Country
12.1. Middle East & Africa Reusable Straws Market Overview
12.2. GCC
12.2.1. GCC Reusable Straws Market Revenue (USD Million) and Forecast By Type, 2018-2030
12.2.2. GCC Reusable Straws Market Revenue (USD Million) and Forecast By End-Use, 2018-2030
12.2.3. GCC Reusable Straws Market Revenue (USD Million) and Forecast By Distribution Channel, 2018-2030
12.3. South Africa
12.3.1. South Africa Reusable Straws Market Revenue (USD Million) and Forecast By Type, 2018-2030
12.3.2. South Africa Reusable Straws Market Revenue (USD Million) and Forecast By End-Use, 2018-2030
12.3.3. South Africa Reusable Straws Market Revenue (USD Million) and Forecast By Distribution Channel, 2018-2030
12.4. Rest of Middle East & Africa
12.4.1. Rest of Middle East & Africa Reusable Straws Market Revenue (USD Million) and Forecast By Type, 2018-2030
12.4.2. Rest of Middle East & Africa Reusable Straws Market Revenue (USD Million) and Forecast By End-Use, 2018-2030
12.4.3. Rest of Middle East & Africa Reusable Straws Market Revenue (USD Million) and Forecast By Distribution Channel, 2018-2030
12.5. Middle East & Africa PEST Analysis
CHAPTER 13. Player Analysis Of Reusable Straws Market
13.1. Reusable Straws Market Company Share Analysis
13.2. Competition Matrix
13.2.1. Competitive Benchmarking of Key Players by Price, Presence, Market Share, and R&D Investment
13.2.2. Product Launches and Product Enhancements
13.2.3. Mergers And Acquisition In Global Reusable Straws Market
13.2.4. Partnership, Joint Ventures and Strategic Alliances/ Sales Agreements
CHAPTER 14. Company Profile
14.1. FinalStraw
14.1.1. Company Snapshot
14.1.2. Business Overview
14.1.3. Financial Overview
14.1.3.1. Market Revenue (USD Million), 2021
14.1.3.2. FinalStraw 2021 Reusable Straws Business Regional Distribution
14.1.4. Product/service and Specification
14.1.5. Recent Developments & Business Strategy
14.2. Buluh Straws
14.3. Simply Straws
14.4. Ecostrawz
14.5. Lakeland Joie
14.6. Greens Steel
14.7. Straw Free
14.8. Waitrose
14.9. Koffie Straw
14.10. Klean Kanteen