Retinal Biologics Market | Acumen Research and Consulting
Retinal Biologics Market Size - Global Industry, Share, Analysis, Trends and Forecast 2023 - 2032
Published :
Report ID:
Pages :
Format : 
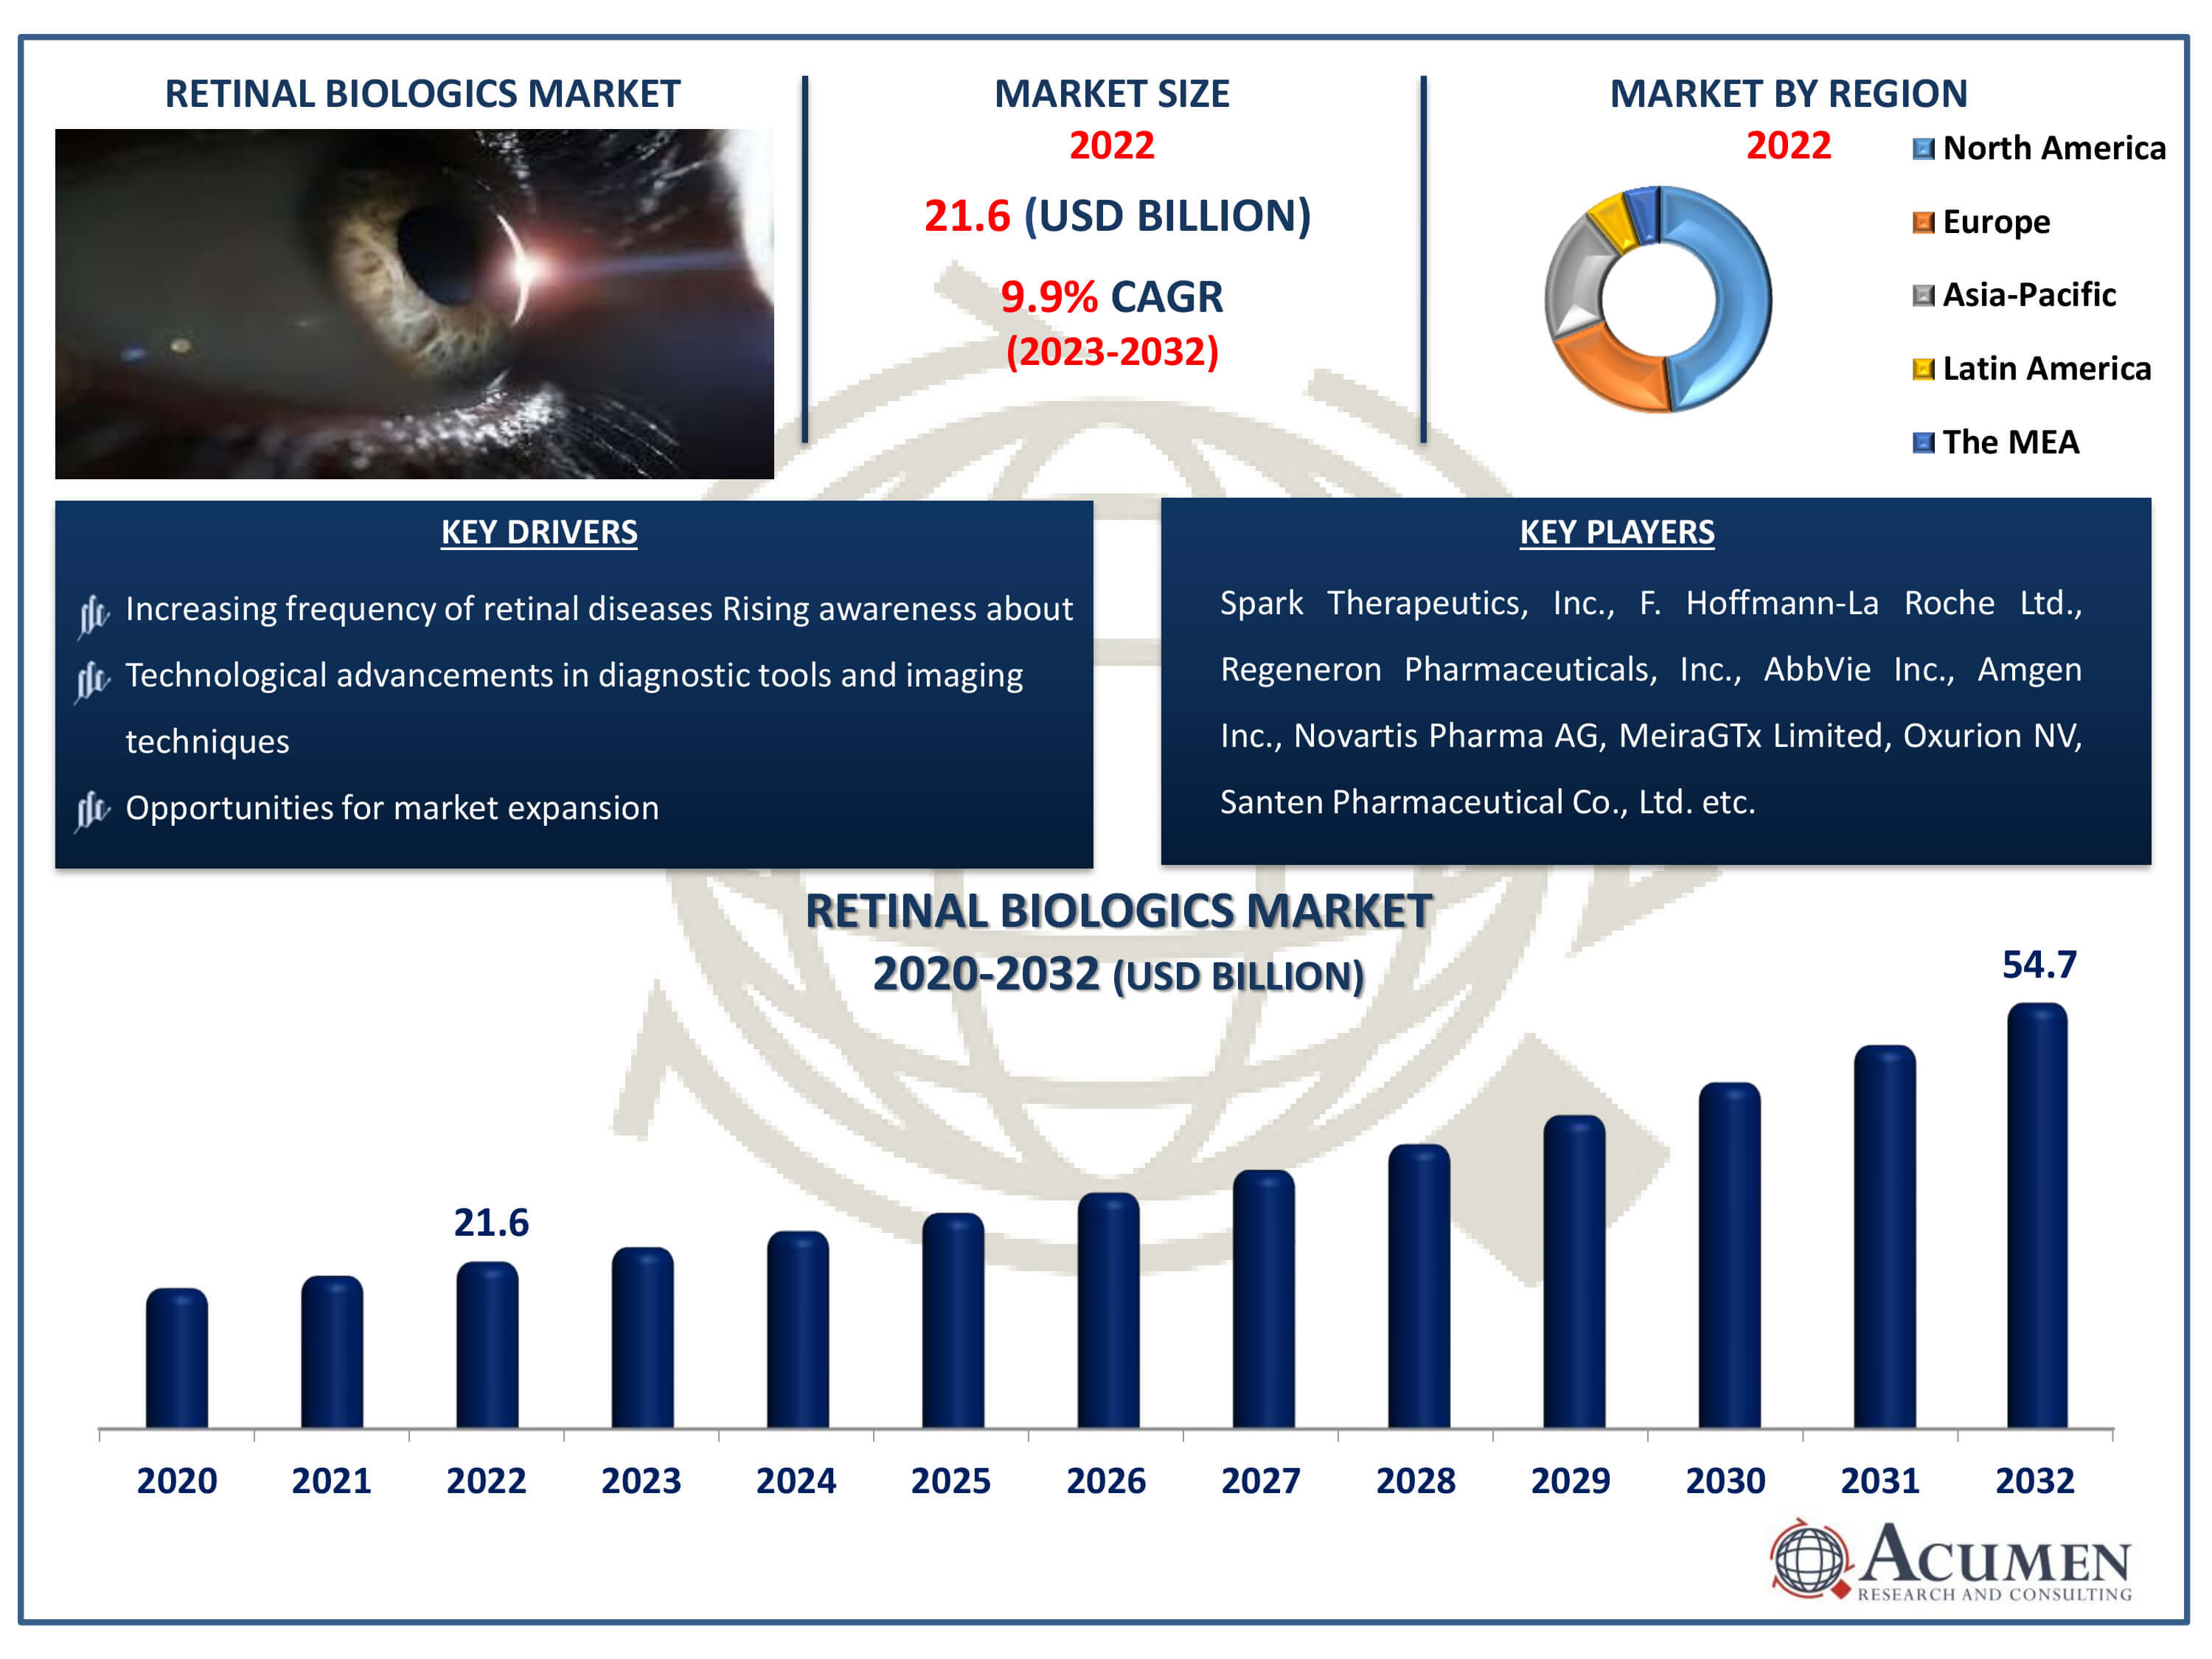
The Retinal Biologics Market Size accounted for USD 21.6 Billion in 2022 and is estimated to achieve a market size of USD 54.7 Billion by 2032 growing at a CAGR of 9.9% from 2023 to 2032.
Retinal Biologics Market Highlights
- Global retinal biologics market revenue is poised to garner USD 54.7 billion by 2032 with a CAGR of 9.9 % from 2023 to 2032
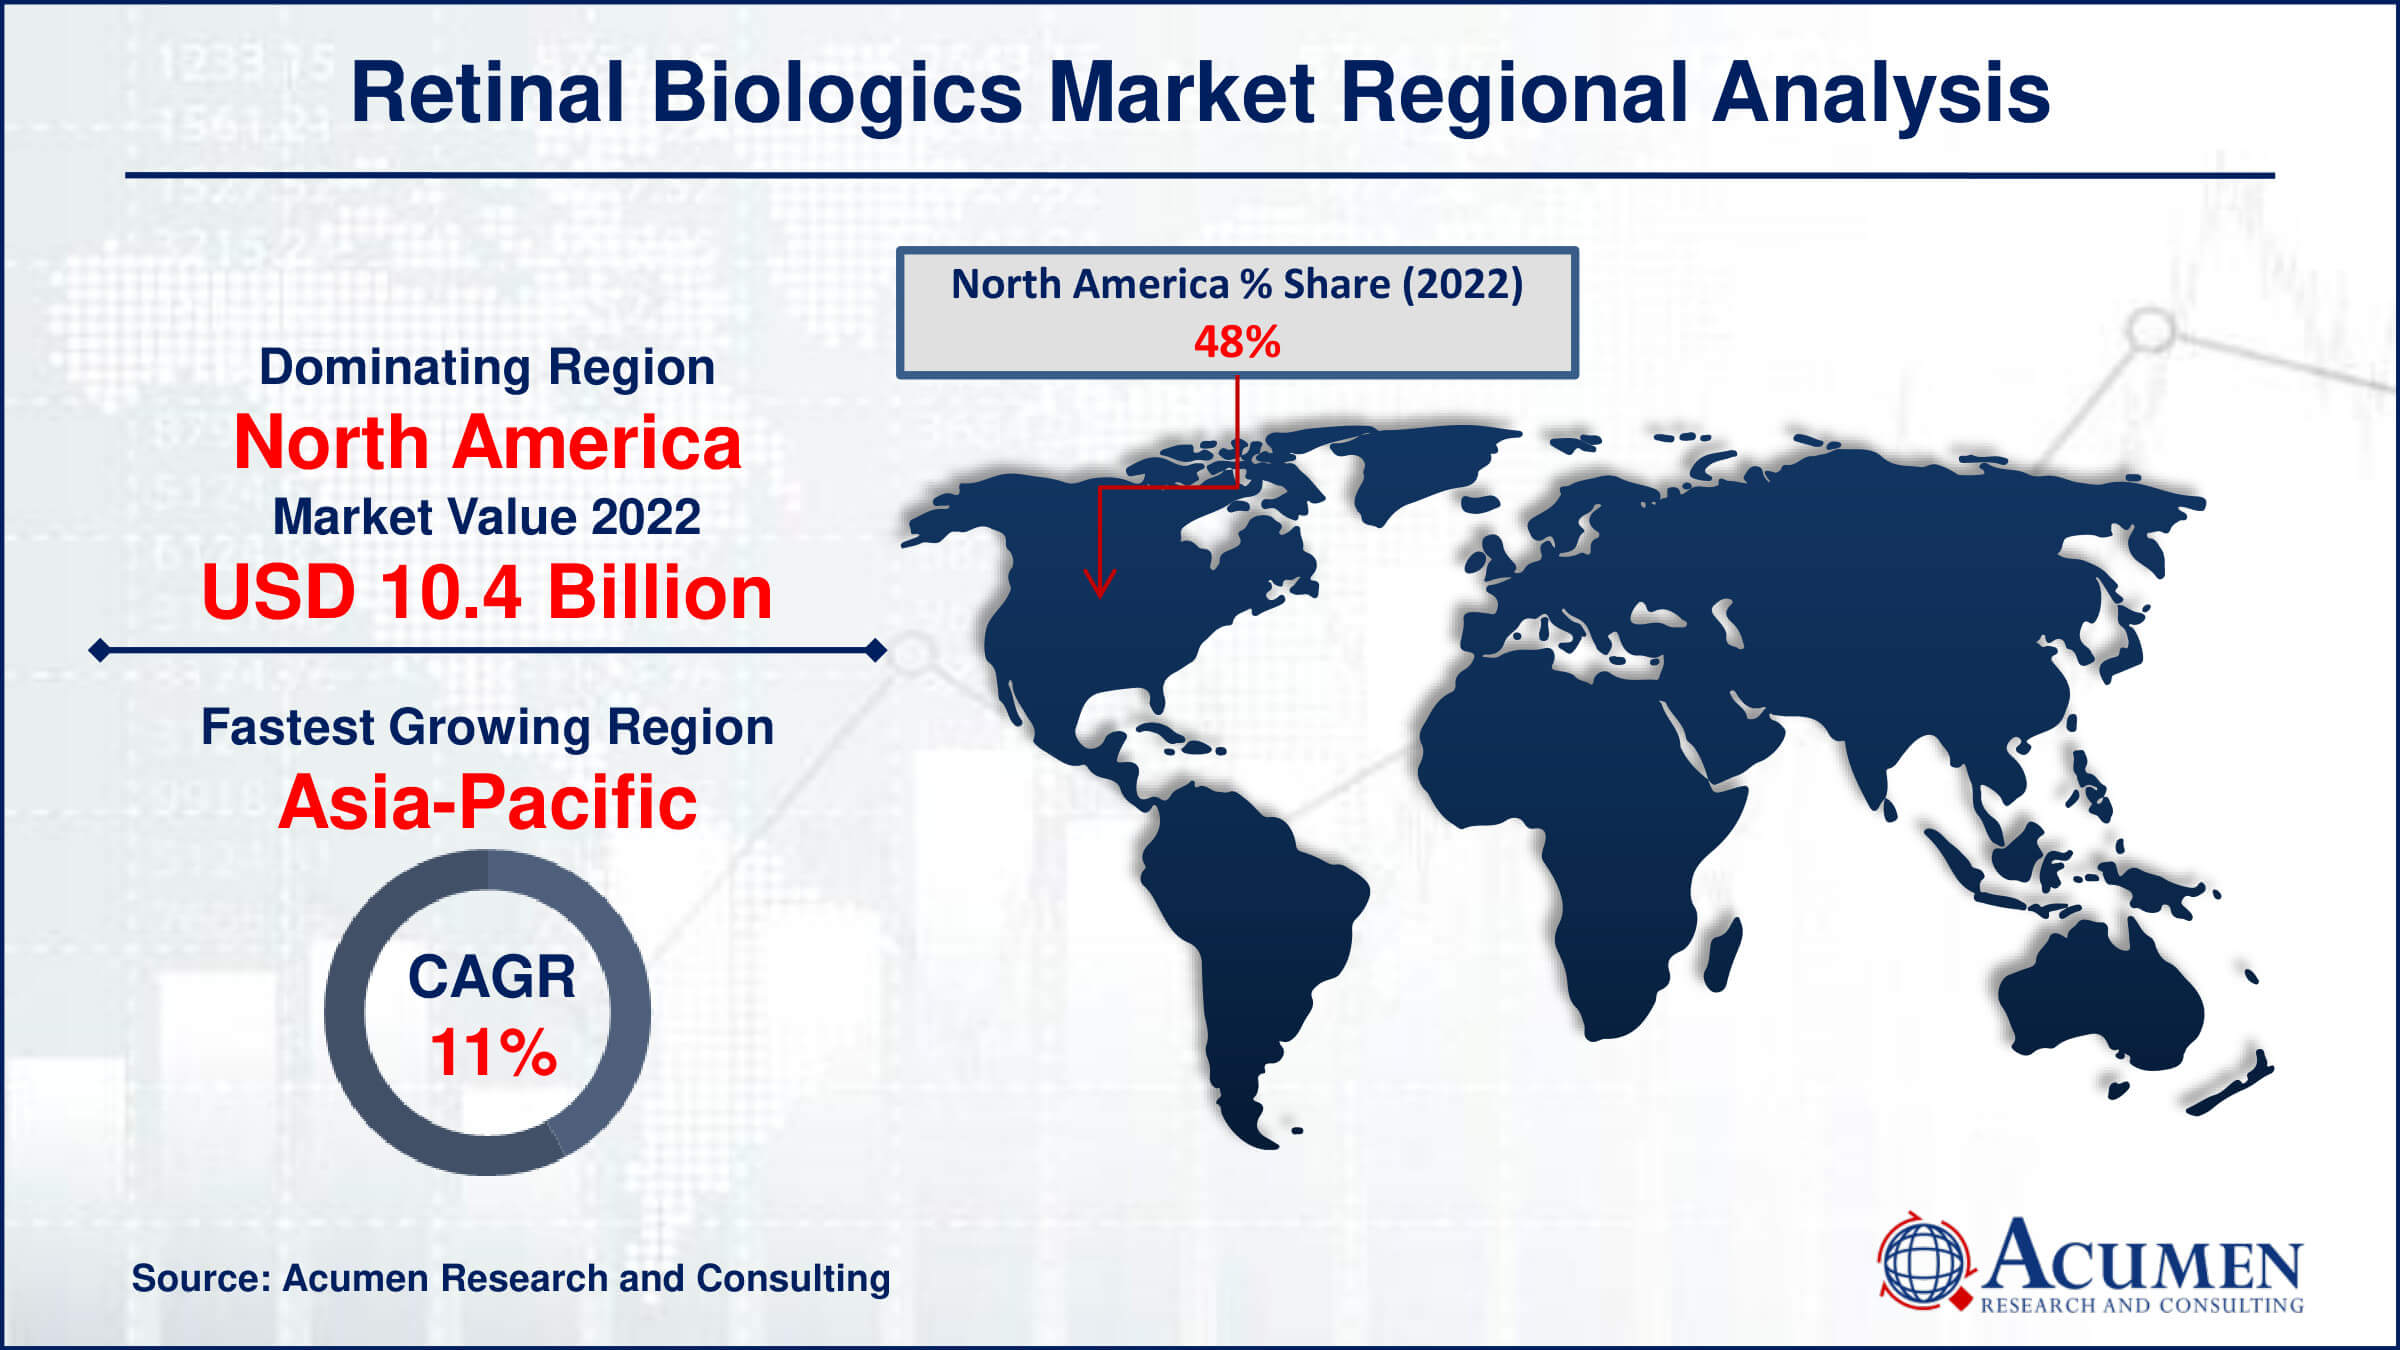
- North America retinal biologics market value occupied around USD 10.4 billion in 2022
- Asia-Pacific retinal biologics market growth will record a CAGR of more than 11% from 2023 to 2032
- Among indication, macular generation sub-segment generated USD 7.6 billion revenue in 2022
- Based on distribution channel, hospital pharmacy sub-segment generated around 49% market share in 2022
- Increasing focus on gene therapies for treating retinal disorders is one of the retinal biologics market trend

Retinal biologics are therapeutic agents used to treat eye problems related to the retina. These molecules are composed of living cells or tissue and play a vital role in treating various retinal issues, such as retinal tear, retinal detachment, diabetic retinopathy, epiretinal membrane, macular hole, macular degeneration, and retinitis pigmentosa. Individuals aged 50 and above are at a higher risk of experiencing vision problems.
For example, according to the National Eye Institute, Age-Related Macular Degeneration (AMD) is the most common cause of vision loss in adults. People aged 55 and above have the highest likelihood of developing Age-Related Macular Degeneration (AMD).
Global Retinal Biologics Market Dynamics
Market Drivers
- Increasing frequency of retinal diseases
- Technological advancements in diagnostic tools and imaging techniques
- Growing awareness among healthcare professionals and the general population about the importance of regular eye check-ups
Market Restraints
- High cost and limited access hamper the market growth
- Limited accessibility to advanced healthcare facilities in certain regions
- Stringent regulatory processes and the need for extensive clinical trials
Market Opportunities
- Technological advances and new product approvals
- Approval of new retinal biologics and related therapies by regulatory authorities
- Opportunities for market expansion exist in untapped regions with growing healthcare infrastructure
Retinal Biologics Market Report Coverage
| Market | Retinal Biologics Market |
| Retinal Biologics Market Size 2022 | USD 21.6 Billion |
| Retinal Biologics Market Forecast 2032 |
USD 54.7 Billion |
| Retinal Biologics Market CAGR During 2023 - 2032 | 9.9% |
| Retinal Biologics Market Analysis Period | 2020 - 2032 |
| Retinal Biologics Market Base Year |
2022 |
| Retinal Biologics Market Forecast Data | 2023 - 2032 |
| Segments Covered | By Drug Class, By Indication, By Distribution Channel, And By Geography |
| Regional Scope | North America, Europe, Asia Pacific, Latin America, and Middle East & Africa |
| Key Companies Profiled | Spark Therapeutics, Inc., F. Hoffmann-La Roche Ltd., Regeneron Pharmaceuticals, Inc., AbbVie Inc., Amgen Inc., Novartis Pharma AG, MeiraGTx Limited, Oxurion NV, Santen Pharmaceutical Co., Ltd, Bayer AG, Bausch Health Companies Inc., Merck & Co., Inc. |
| Report Coverage |
Market Trends, Drivers, Restraints, Competitive Analysis, Player Profiling, Covid-19 Analysis, Regulation Analysis |
Retinal Biologics Market Insights
The increasing frequency of retinal diseases is expected to boost the demand for the retinal biologics market. Age-related blindness is experiencing significant growth in the forecast year. For instance, according to the National Institute of Health in November 2022, India contains approximately 25% of people with vision impairment and blindness. Additionally, retinal problems are not only increasing in individuals above 50 years old but also in children due to the growing interest in technical gadgets like smartphones, television, and others. For instance, in the United States, approximately 6.8% of children above 18 years old have vision problems. Also, 3% of children above 18 years old are blind or usually impaired. Furthermore, the economic cost of major vision problems is estimated to increase to $373 billion by 2050. Overall, the increasing number of vision problems drives the demand for retinal biologics in the market.
However, high costs and limited access may hamper market growth in the coming years. Treatment costs may have an even greater impact on low- and middle-income countries due to limited medical insurance coverage, restricted access to treatment, high initial costs, and reimbursement issues. Unaffordability, accounting for 41%, is the main reason in retinal biologics that impedes the market. Overall, there is a need to provide more affordable and cost-effective anti-VEGF treatments for neovascular retinal diseases globally.
Technological advancements in the development of retinal biologics will also become an opportunity for the retinal biologics market. For instance, according to the National Library of Medicine, intravitreal treatment requires more time to recover from eye issues, so for that reason, new investigations are focused on an extended drug delivery system, i.e., ocular drug delivery. Overall, these advancements will further become an opportunity in the retinal biologics market.
Retinal Biologics Market Segmentation
The worldwide market for retinal biologics is segmented into drug class, indication, distribution channel, and region.
Retinal Biologics Market By Drug Class
- VEGF-A Antagonist
- TNF-A Inhibitor
According to the analysis of retinal biologics, the market is segmented based on drug class into VEGF-A Antagonist and TNF-a Inhibitor. The VEGF-A Antagonist dominates the retinal biologics market with the largest market share. VEGF-A, which stands for vascular endothelial growth factor, is the primary contributor to this dominance, attributed to the rising number of product approvals.
For instance, in January 2022, the U.S. FDA approved faricimab-svoa (Vabysmo) to treat neovascular (wet) age-related macular degeneration and diabetic macular edema. Vabysmo is a vascular endothelial growth factor (VEGF) and angiopoietin-2 (Ang-2) inhibitor indicated for the treatment of patients with neovascular (wet) age-related macular degeneration (nAMD) and diabetic macular edema (DME). Overall, these drug approvals significantly contribute to the increased demand for VEGF-A Antagonists in the retinal biologics market.
Retinal Biologics Market By Indication
- Macular degeneration
- Diabetic retinopathy
- Uveitis
- Others
According to retinal biologics, the market is segmented based on indication into macular degeneration, diabetic retinopathy, uveitis, and others. Macular degeneration, causing irreversible blindness, is mostly prevalent in older individuals. The macular degeneration segment dominates the retinal biologics market, and this dominance is attributed to the rising number of people suffering from macular degeneration.
For instance, according to the National Institute of Health, 200 million people worldwide suffer from AMD, and this number is projected to grow to 300 million by 2040. Furthermore, it is estimated that 5.4 million Americans will be affected by AMD by 2050. The increasing number of drug launches in the macular degeneration sector will further contribute to the dominance of macular degeneration in the market.
Retinal Biologics Market By Distribution Channel
- Retail Pharmacies
- Hospital Pharmacies
- Online Pharmacies
According to retinal biologics, based on the distribution channel, the market is segmented into retail pharmacies, hospital pharmacies, and online pharmacies. Hospital pharmacies dominate the retinal biologics market, and this dominance is attributed to the presence of a number of medicines that provide direct access to the medical records of patients.
Retinal Biologics Market Regional Outlook
North America
- U.S.
- Canada
Europe
- U.K.
- Germany
- France
- Spain
- Rest of Europe
Asia-Pacific
- India
- Japan
- China
- Australia
- South Korea
- Rest of Asia-Pacific
Latin America
- Brazil
- Mexico
- Rest of Latin America
The Middle East & Africa
- South Africa
- GCC Countries
- Rest of the Middle East & Africa (ME&A)

Retinal Biologics Market Regional Analysis
According to the retinal biologics market, regional analysis is based on North America, Europe, Asia Pacific, Latin America, the Middle East, and Africa. North America dominates the retinal biologics market due to the presence of robust key players. Additionally, new acquisitions, partnerships, and product launches by these key players will continue to contribute to the dominance of North America in this market.
For instance, the US FDA approved the updated label of Novartis Beovu on June 11, 2020. This label includes descriptions of adverse events, such as retinal vasculitis and retinal vascular occlusion. Furthermore, according to the National Institute of Medicine, on September 17, 2021, SB 11 was approved by the U.S. Food and Drug Administration (FDA) for the treatment of nAMD and other retinal diseases. These discoveries and developments will aid in the treatment of various retinal diseases. Therefore, the acquisitions and developments in North America are expected to dominate the retinal biologics market.
Retinal Biologics Market Players
Some of the top retinal biologics companies offered in our report includes Spark Therapeutics, Inc., F. Hoffmann-La Roche Ltd., Regeneron Pharmaceuticals, Inc., AbbVie Inc., Amgen Inc., Novartis Pharma AG, MeiraGTx Limited, Oxurion NV, Santen Pharmaceutical Co., Ltd, Bayer AG, Bausch Health Companies Inc., Merck & Co., Inc.
Frequently Asked Questions
How big is the retinal biologics market?
The retinal biologics market size was valued at USD 21.6 billion in 2022.
What is the CAGR of the global retinal biologics market from 2023 to 2032?
The CAGR of nerve repair and regeneration is 9.9% during the analysis period of 2023 to 2032.
Which are the key players in the retinal biologics market?
The key players operating in the global market are including Spark Therapeutics, Inc., F. Hoffmann-La Roche Ltd., Regeneron Pharmaceuticals, Inc., AbbVie Inc., Amgen Inc., Novartis Pharma AG, MeiraGTx Limited, Oxurion NV, Santen Pharmaceutical Co., Ltd, Bayer AG, Bausch Health Companies Inc., and Merck & Co., Inc.
Which region dominated the global retinal biologics market share?
North America held the dominating position in the retinal biologics market analysis period of 2023 to 2032.
Which region registered fastest CAGR from 2023 to 2032?
Asia-Pacific region exhibited fastest growing CAGR for market of nerve repair and regeneration during the analysis period of 2023 to 2032.
What are the current trends and dynamics in the global nerve repair and regeneration industry?
The current trends and dynamics in the retinal biologics market are the increasing frequency of retinal diseases, technological advancements in diagnostic tools and imaging techniques, and approval of new retinal biologics and related therapies by regulatory authorities will drives the demand for retinal biologics market.
Which segment dominates the market By Drug Class?
Which segment dominates the market By Drug Class?
Select Licence Type
Connect with our sales team
Why Acumen Research And Consulting
100%
Customer Satisfaction
24x7
Availability - we are always there when you need us
200+
Fortune 50 Companies trust Acumen Research and Consulting
80%
of our reports are exclusive and first in the industry
100%
more data and analysis
1000+
reports published till date


