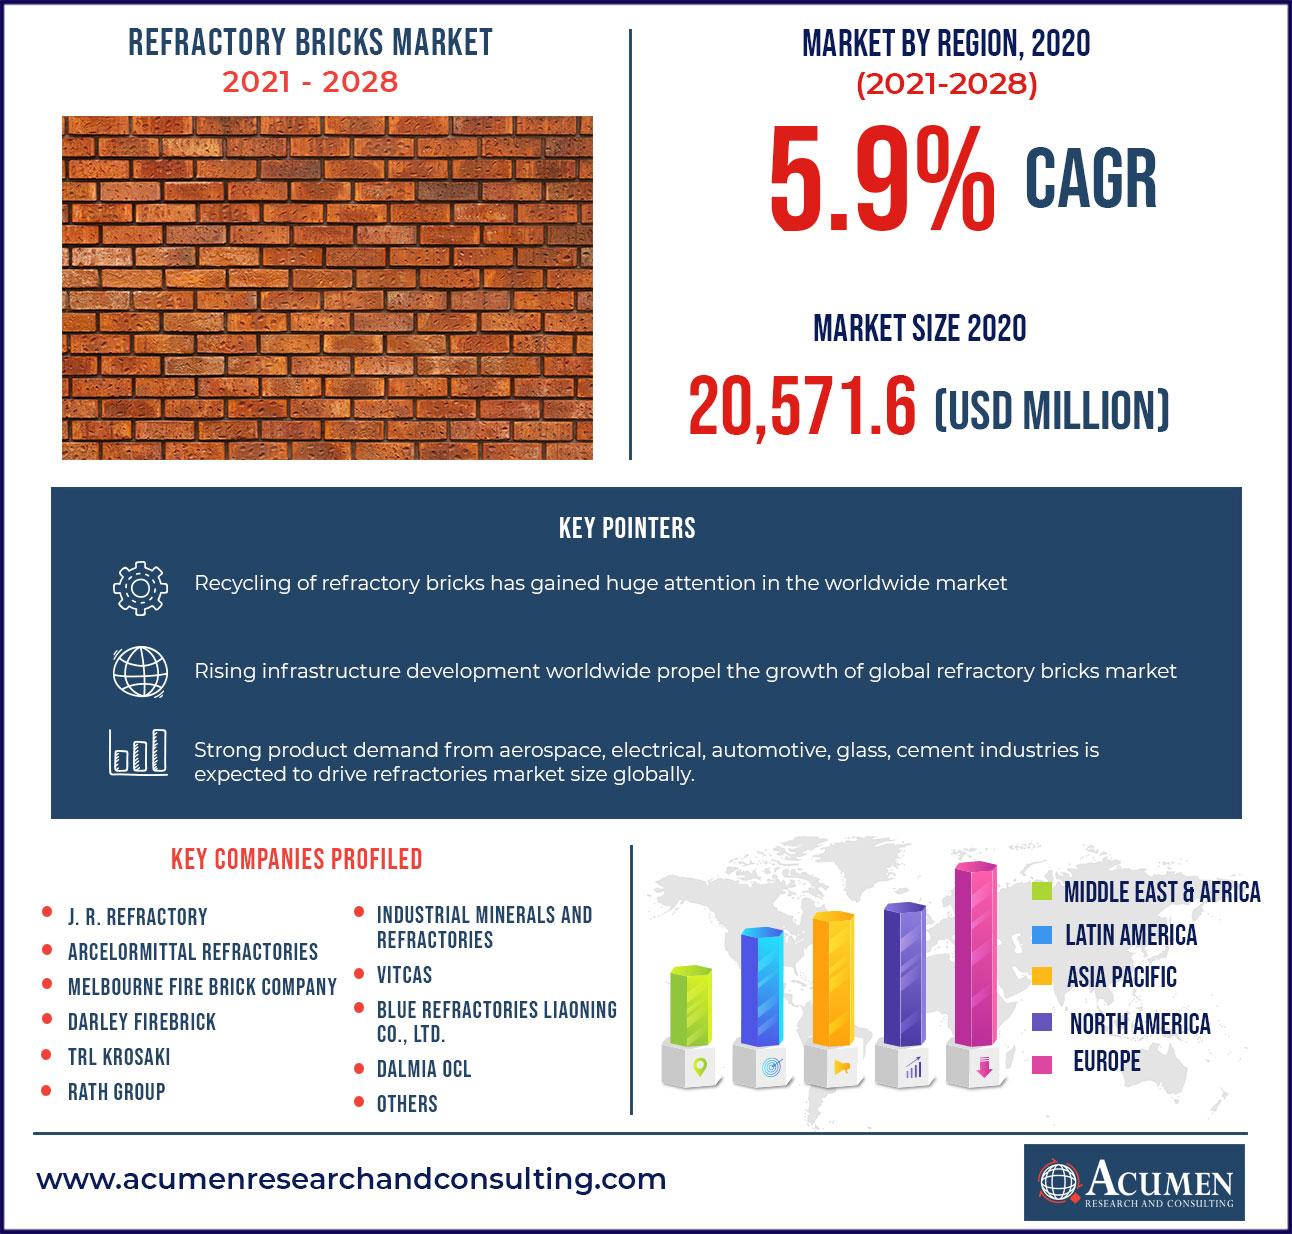
The global refractory bricks market accounted US$ 20,571.6 Mn in 2020 by recording significant CAGR of 5.9% during the analysis period of 2021 to 2028.
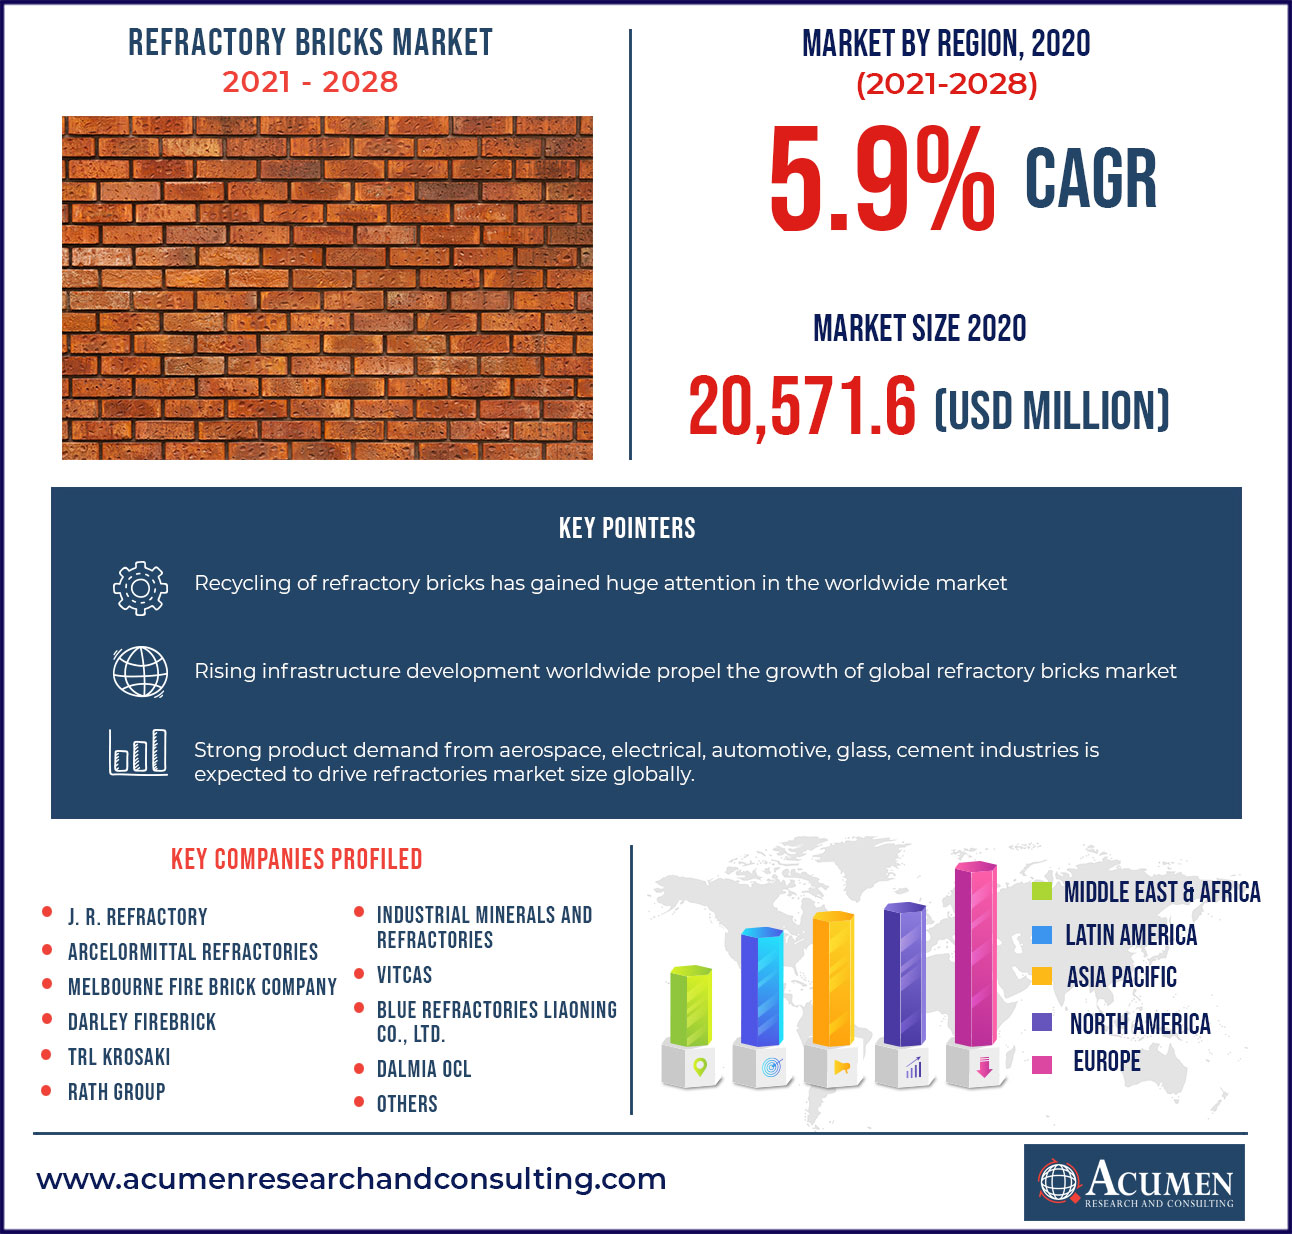
Refractory brick is defined as a block of ceramic material specially designed for utilization in kilns, furnaces, lining, fireboxes, and fireplaces. Additionally, it can withstand very high temperature for up to 16490C with low thermal conductivity for greater energy efficiency. Further, basic refractory bricks are composed of magnesite brick (comprising of 85% magnesium oxide + 35% iron oxide) and dolomite refractory bricks (that can resist temperature at 14000C to 16000C temperature).
Report coverage
Market |
Refractory Bricks Market |
Analysis Period |
2017 - 2028 |
Base Year |
2020 |
Forecast Data |
2021 - 2028 |
Segments Covered |
By Type, By Application, By Material, and By Geography
|
Regional Scope |
North America, Europe, Asia Pacific, Latin America, and Middle East & Africa |
Key Companies Profiled |
J. R. Refractory, ArcelorMittal Refractories, Melbourne Fire Brick Company, Darley Firebrick, TRL Krosaki, Rath Group, Industrial Minerals and Refractories, Vitcas, Blue Refractories Liaoning Co., Ltd., Dalmia OCL, and among others |
Report Coverage
|
Market Trends, Drivers, Restraints, Competitive Analysis, Player Profiling, Regulation Analysis |
Customization Scope |
10 hrs of free customization and expert consultation
|
Market Trends:
Recycling of refractory bricks has gained huge attention in the worldwide market
Refractory are indispensable for all high temperature processes, involving production of metals, cement, glass, and ceramics. Additionally, refractory production is around 35-40 million tons per year, with annual fluctuations determined largely by the iron and steel industry responsible for 70% of the total demand. During this phase, 30-40% of the refractory is consumed pinpointing up to 28 million tons of spent refractory generated every year. From the past two decades, recycling of spent refractory has started to emerge as a growing trend owing to environmental favorability and rising cost for land filling. Therefore, with rising pricing and supply issues for high quality virgin raw materials have imposed pressure for closed-loop refractory recycling; the interest for recycling within the refractory production industry is rising at a tremendous pace.
Rising infrastructure development worldwide propels the growth of global refractory bricks market
Rising demand especially for the construction of new buildings is likely to bolster the demand for refractory bricks in the coming years. As refractory production is strongly dependant on high quality raw materials, many of these are becoming center of attraction for construction of new building. Additionally, tremendous growth witnessed in the construction activity fuel the demand for the production of iron and steel globally particularly in developing economies. Also, the rising use of iron and steel in the automobile sector further propel the demand for refractory bricks in the market. Some of these major applications for refractory bricks in these sectors include usage in internal lining of furnaces to make iron and steel, in furnaces for heating steel before further processing, in vessels for holding and transporting metal and slag, and in the flues or stacks through which hot gases are conducted. For instance, according to the report released by the World Steel Association, the global demand for steel has reached about 1.76 million metric ton in 2019, and is anticipated to reach 1.81 million tons by 2021, with a growth of about 1.7%. Furthermore, architects have exposed the utilization of refractory bricks to build and coat surfaces.
Key takeaway:
Reprocessed polyolefin water sachet waste, commonly called "pure water" sachet has been strongly investigated and declared as a new porosity inducing material for the manufacturing of insulating refractory bricks. Used polyolefin sachet were chemically treated and recrystallized into powder of varying particle size and the powder has been found to burn readily without a residue. This prominent characteristic is considered ideal for porosity material for the manufacturing of insulating refractory bricks and some preliminary studies have been conducted. As bricks were composed with varying proportion of the new material and the bulk density, shrinkage and thermal conductivity were determined and compared with those of the bricks composed from sawdust and naphthalene that are the common conventional porosity materials. Therefore, this new material is found to compare favorably well, and in some cases, better than the conventional materials.
Market Segmentation
The global refractory bricks market is segmented based on type, application, and material. Based on type, the market is bifurcated into unshaped and shaped. By application, the market is segregated as furnaces, metallurgy, kilns, incinerators, and others. By materials, the market is segregated as alumino-silicates, silicon carbides, and ceramic bricks.
Based on type, shaped segment will hold dominating share for the overall market. Shape refractory is those refractory that have resistance to corrosive reactions that are chemically basic slags, dusts and fumes at elevated temperatures. Additionally, shape refractory is characterized by an extremely high refractoriness and good resistance to basic slags. The chemical-physical characteristics make ideal refractory for steel making process. Hence, shape refractory received increase importance with the introduction of basic oxygen steel making process.
Regional Landscape
Europe records maximum share for refractory bricks market; Asia Pacific records fastest growing CAGR for the analysis period of 2021 to 2028
Among European countries, Germany is the highest contributing country for refractory bricks market accounting to US$1,368.4 Mn in 2020 revenue. The EU Publications Office report states that recycling of spent refractory constitutes an important new secondary source of refractory raw materials. In Europe, recycling refractory has increased substantially over the years. Increased recycling will also reduce the cost of raw materials and make the production of refractory material in Europe more competitive and resource efficient. On the other hand, economic and environmental assessment reveals that the REFRASORT system can meet the market demand for increasing refractory recycling with creating economic benefits for both refractory recyclers and producers by reducing environmental impact associated to refractory production at the European and global level. A substantial replication potential is possible at the European and worldwide level, for the steel industry as well as all refractory consuming industry.
Asia Pacific is set to record fastest growing CAGR for refractory bricks market in the forthcoming years. Among APAC provinces, China is the hub for alumina, bauxite, graphite, and magnesia as many countries are highly dependent on import of key refractory grade minerals. For instance, the European refractory industry relies completely on imports of raw materials, particularly high grade magnesia, bauxite, and graphite that are mainly sourced from China. This is one of the key factors that attribute for the growth of refractory bricks at regional level.
Competitive Landscape
The prominent players of the global refractory bricks market involve J. R. Refractory, ArcelorMittal Refractories, Melbourne Fire Brick Company, Darley Firebrick, TRL Krosaki, Rath Group, Industrial Minerals and Refractories, Vitcas, Blue Refractories Liaoning Co., Ltd., Dalmia OCL, and among others
Market Segmentation
Market By Type
Market By Application
- Furnaces
- Metallurg
- Kilns
- Incinerators
- Others
Market By Material
- Alumino-silicates
- Silicon Carbides
- Ceramic Bricks
Market By Geography
- North America
- Europe
- U.K.
- Germany
- France
- Spain
- Rest of Europe
- Asia-Pacific
- China
- Japan
- India
- Australia
- South Korea
- Rest of Asia-Pacific
- Latin America
- Brazil
- Mexico
- Rest of Latin America
- Middle East & Africa
- GCC
- South Africa
- Rest of Middle East & Africa
CHAPTER 1. Industry Overview of Refractory Bricks
1.1. Definition and Scope
1.1.1. Definition of Refractory Bricks
1.1.2. Market Segmentation
1.1.3. Years Considered for the Study
1.1.4. Assumptions and Acronyms Used
1.1.4.1. Market Assumptions and Market Forecast
1.1.4.2. Acronyms Used in Global Refractory Bricks Market
1.2. Summary
1.2.1. Executive Summary
1.2.2. Refractory Bricks Market By Type
1.2.3. Refractory Bricks Market By Application
1.2.4. Refractory Bricks Market By Material
1.2.5. Refractory Bricks Market by Regions
CHAPTER 2. Research Approach
2.1. Methodology
2.1.1. Research Programs
2.1.2. Market Size Estimation
2.1.3. Market Breakdown and Data Triangulation
2.2. Data Source
2.2.1. Secondary Sources
2.2.2. Primary Sources
CHAPTER 3. Market Dynamics And Competition Analysis
3.1. Market Drivers
3.1.1. Driver 1
3.1.2. Driver 2
3.2. Restraints and Challenges
3.2.1. Restrain 1
3.2.2. Restrain 2
3.3. Growth Opportunities
3.3.1. Opportunity 1
3.3.2. Opportunity 2
3.4. Porter’s Five Forces Analysis
3.4.1. Bargaining Power of Suppliers
3.4.2. Bargaining Power of Buyers
3.4.3. Threat of Substitute
3.4.4. Threat of New Entrants
3.4.5. Degree of Competition
3.5. Market Concentration Ratio and Market Maturity Analysis of Refractory Bricks Market
3.5.1. Go To Market Strategy
3.5.1.1. Introduction
3.5.1.2. Growth
3.5.1.3. Maturity
3.5.1.4. Saturation
3.5.1.5. Possible Development
3.6. Technological Roadmap for Refractory Bricks Market
3.7. Value Chain Analysis
3.7.1. List of Key Manufacturers
3.7.2. List of Customers
3.7.3. Level of Integration
3.8. Cost Structure Analysis
3.8.1. Price Trend of Key Raw Materials
3.8.2. Raw Material Suppliers
3.8.3. Proportion of Manufacturing Cost Structure
3.8.3.1. Raw Material
3.8.3.2. Labor Cost
3.8.3.3. Manufacturing Expense
3.9. Regulatory Compliance
3.10. Competitive Landscape, 2020
3.10.1. Player Positioning Analysis
3.10.2. Key Strategies Adopted By Leading Players
CHAPTER 4. Manufacturing Plant Analysis
4.1. Manufacturing Plant Location and Establish Date of Major Manufacturers in 2020
4.2. R&D Status and Application Source of Refractory Bricks Major Manufacturers in 2020
CHAPTER 5. Refractory Bricks Market By Type
5.1. Introduction
5.2. Refractory Bricks Revenue By Type
5.2.1. Refractory Bricks Revenue (US$ Mn) and Forecast, By Type, 2017-2028
5.2.2. Unshaped
5.2.2.1. Unshaped Market Revenue (US$ Mn) and Growth Rate (%), 2017-2028
5.2.3. Shaped
5.2.3.1. Shaped Market Revenue (US$ Mn) and Growth Rate (%), 2017-2028
CHAPTER 6. Refractory Bricks Market Revenue By Application
6.1. Introduction
6.2. Refractory Bricks Revenue (US$ Mn) By Application
6.2.1. Refractory Bricks Revenue (US$ Mn) and Forecast By Application, 2017-2028
6.2.2. Furnaces
6.2.2.1. Furnaces Market Revenue (US$ Mn) and Growth Rate (%), 2017-2028
6.2.3. Metallurg
6.2.3.1. Metallurg Market Revenue (US$ Mn) and Growth Rate (%), 2017-2028
6.2.4. Kilns
6.2.4.1. Kilns Market Revenue (US$ Mn) and Growth Rate (%), 2017-2028
6.2.5. Incinerators
6.2.5.1. Incinerators Market Revenue (US$ Mn) and Growth Rate (%), 2017-2028
6.2.6. Others
6.2.6.1. Others Market Revenue (US$ Mn) and Growth Rate (%), 2017-2028
CHAPTER 7. Refractory Bricks Market By Material
7.1. Introduction
7.2. Refractory Bricks Revenue (US$ Mn) By Material
7.2.1. Refractory Bricks Revenue (US$ Mn) and Forecast By Material, 2017-2028
7.2.2. Alumino-silicates
7.2.2.1. Alumino-silicates Market Revenue (US$ Mn) and Growth Rate (%), 2017-2028
7.2.3. Silicon Carbides
7.2.3.1. Silicon Carbides Market Revenue (US$ Mn) and Growth Rate (%), 2017-2028
7.2.4. Ceramic Bricks
7.2.4.1. Ceramic Bricks Market Revenue (US$ Mn) and Growth Rate (%), 2017-2028
CHAPTER 8. North America Refractory Bricks Market By Country
8.1. North America Refractory Bricks Overview
8.2. U.S.
8.2.1. U.S. Refractory Bricks Market Revenue (US$ Mn) and Forecast By Type, 2017-2028
8.2.2. U.S. Refractory Bricks Market Revenue (US$ Mn) and Forecast By Application, 2017-2028
8.2.3. U.S. Refractory Bricks Market Revenue (US$ Mn) and Forecast By Material, 2017-2028
8.3. Canada
8.3.1. Canada Refractory Bricks Market Revenue (US$ Mn) and Forecast By Type, 2017-2028
8.3.2. Canada Refractory Bricks Market Revenue (US$ Mn) and Forecast By Application, 2017-2028
8.3.3. Canada Refractory Bricks Market Revenue (US$ Mn) and Forecast By Material, 2017-2028
8.4. North America PEST Analysis
CHAPTER 9. Europe Refractory Bricks Market By Country
9.1. Europe Refractory Bricks Market Overview
9.2. U.K.
9.2.1. U.K. Refractory Bricks Market Revenue (US$ Mn) and Forecast By Type, 2017-2028
9.2.2. U.K. Refractory Bricks Market Revenue (US$ Mn) and Forecast By Application, 2017-2028
9.2.3. U.K. Refractory Bricks Market Revenue (US$ Mn) and Forecast By Material, 2017-2028
9.3. Germany
9.3.1. Germany Refractory Bricks Market Revenue (US$ Mn) and Forecast By Type, 2017-2028
9.3.2. Germany Refractory Bricks Market Revenue (US$ Mn) and Forecast By Application, 2017-2028
9.3.3. Germany Refractory Bricks Market Revenue (US$ Mn) and Forecast By Material, 2017-2028
9.4. France
9.4.1. France Refractory Bricks Market Revenue (US$ Mn) and Forecast By Type, 2017-2028
9.4.2. France Refractory Bricks Market Revenue (US$ Mn) and Forecast By Application, 2017-2028
9.4.3. France Refractory Bricks Market Revenue (US$ Mn) and Forecast By Material, 2017-2028
9.5. Spain
9.5.1. Spain Refractory Bricks Market Revenue (US$ Mn) and Forecast By Type, 2017-2028
9.5.2. Spain Refractory Bricks Market Revenue (US$ Mn) and Forecast By Application, 2017-2028
9.5.3. Spain Refractory Bricks Market Revenue (US$ Mn) and Forecast By Material, 2017-2028
9.6. Rest of Europe
9.6.1. Rest of Europe Refractory Bricks Market Revenue (US$ Mn) and Forecast By Type, 2017-2028
9.6.2. Rest of Europe Refractory Bricks Market Revenue (US$ Mn) and Forecast By Application, 2017-2028
9.6.3. Rest of Europe Refractory Bricks Market Revenue (US$ Mn) and Forecast By Material, 2017-2028
9.7. Europe PEST Analysis
CHAPTER 10. Asia Pacific Refractory Bricks Market By Country
10.1. Asia Pacific Refractory Bricks Market Overview
10.2. China
10.2.1. China Refractory Bricks Market Revenue (US$ Mn) and Forecast By Type, 2017-2028
10.2.2. China Refractory Bricks Market Revenue (US$ Mn) and Forecast By Application, 2017-2028
10.2.3. China Refractory Bricks Market Revenue (US$ Mn) and Forecast By Material, 2017-2028
10.3. Japan
10.3.1. Japan Refractory Bricks Market Revenue (US$ Mn) and Forecast By Type, 2017-2028
10.3.2. Japan Refractory Bricks Market Revenue (US$ Mn) and Forecast By Application, 2017-2028
10.3.3. Japan Refractory Bricks Market Revenue (US$ Mn) and Forecast By Material, 2017-2028
10.4. India
10.4.1. India Refractory Bricks Market Revenue (US$ Mn) and Forecast By Type, 2017-2028
10.4.2. India Refractory Bricks Market Revenue (US$ Mn) and Forecast By Application, 2017-2028
10.4.3. India Refractory Bricks Market Revenue (US$ Mn) and Forecast By Material, 2017-2028
10.5. Australia
10.5.1. Australia Refractory Bricks Market Revenue (US$ Mn) and Forecast By Type, 2017-2028
10.5.2. Australia Refractory Bricks Market Revenue (US$ Mn) and Forecast By Application, 2017-2028
10.5.3. Australia Refractory Bricks Market Revenue (US$ Mn) and Forecast By Material, 2017-2028
10.6. South Korea
10.6.1. South Korea Refractory Bricks Market Revenue (US$ Mn) and Forecast By Type, 2017-2028
10.6.2. South Korea Refractory Bricks Market Revenue (US$ Mn) and Forecast By Application, 2017-2028
10.6.3. South Korea Refractory Bricks Market Revenue (US$ Mn) and Forecast By Material, 2017-2028
10.7. Rest of Asia-Pacific
10.7.1. Rest of Asia-Pacific Refractory Bricks Market Revenue (US$ Mn) and Forecast By Type, 2017-2028
10.7.2. Rest of Asia-Pacific Refractory Bricks Market Revenue (US$ Mn) and Forecast By Application, 2017-2028
10.7.3. Rest of Asia-Pacific Refractory Bricks Market Revenue (US$ Mn) and Forecast By Material, 2017-2028
10.8. Asia Pacific PEST Analysis
CHAPTER 11. Latin America Refractory Bricks Market By Country
11.1. Latin America Refractory Bricks Market Overview
11.2. Brazil
11.2.1. Brazil Refractory Bricks Market Revenue (US$ Mn) and Forecast By Type, 2017-2028
11.2.2. Brazil Refractory Bricks Market Revenue (US$ Mn) and Forecast By Application, 2017-2028
11.2.3. Brazil Refractory Bricks Market Revenue (US$ Mn) and Forecast By Material, 2017-2028
11.3. Mexico
11.3.1. Mexico Refractory Bricks Market Revenue (US$ Mn) and Forecast By Type, 2017-2028
11.3.2. Mexico Refractory Bricks Market Revenue (US$ Mn) and Forecast By Application, 2017-2028
11.3.3. Mexico Refractory Bricks Market Revenue (US$ Mn) and Forecast By Material, 2017-2028
11.4. Rest of Latin America
11.4.1. Rest of Latin America Refractory Bricks Market Revenue (US$ Mn) and Forecast By Type, 2017-2028
11.4.2. Rest of Latin America Refractory Bricks Market Revenue (US$ Mn) and Forecast By Application, 2017-2028
11.4.3. Rest of Latin America Refractory Bricks Market Revenue (US$ Mn) and Forecast By Material, 2017-2028
11.5. Latin America PEST Analysis
CHAPTER 12. Middle East & Africa Refractory Bricks Market By Country
12.1. Middle East & Africa Refractory Bricks Market Overview
12.2. Saudi Arabia
12.2.1. Saudi Arabia Refractory Bricks Market Revenue (US$ Mn) and Forecast By Type, 2017-2028
12.2.2. Saudi Arabia Refractory Bricks Market Revenue (US$ Mn) and Forecast By Application, 2017-2028
12.2.3. Saudi Arabia Refractory Bricks Market Revenue (US$ Mn) and Forecast By Material, 2017-2028
12.3. UAE
12.3.1. UAE Refractory Bricks Market Revenue (US$ Mn) and Forecast By Type, 2017-2028
12.3.2. UAE Refractory Bricks Market Revenue (US$ Mn) and Forecast By Application, 2017-2028
12.3.3. UAE Refractory Bricks Market Revenue (US$ Mn) and Forecast By Material, 2017-2028
12.4. Rest of Middle East & Africa
12.4.1. Rest of Middle East & Africa Refractory Bricks Market Revenue (US$ Mn) and Forecast By Type, 2017-2028
12.4.2. Rest of Middle East & Africa Refractory Bricks Market Revenue (US$ Mn) and Forecast By Application, 2017-2028
12.4.3. Rest of Middle East & Africa Refractory Bricks Market Revenue (US$ Mn) and Forecast By Material, 2017-2028
12.5. Middle East & Africa PEST Analysis
CHAPTER 13. Player Analysis Of Refractory Bricks
13.1. Refractory Bricks Market Company Share Analysis
13.2. Competition Matrix
13.2.1. Competitive Benchmarking of key players by price, presence, market share, and R&D investment
13.2.2. New Product Launches and Product Enhancements
13.2.3. Mergers And Acquisition In Global Refractory Bricks Market
13.2.4. Partnership, Joint Ventures and Strategic Alliances/ Sales Agreements
CHAPTER 14. COMPANY PROFILE
14.1. J. R. Refractory
14.1.1. Company Snapshot
14.1.2. Business Overview
14.1.3. Financial Overview
14.1.3.1. Revenue (US$ Mn), 2020
14.1.3.2. J. R. Refractory 2020 Refractory Bricks Business Regional Distribution
14.1.4. Product/ Service and Specification
14.1.5. Recent Developments & Business Strategy
14.1.6. Manufacturing Plant Footprint Analysis
14.2. ArcelorMittal Refractories
14.3. Melbourne Fire Brick Company
14.4. Darley Firebrick
14.5. TRL Krosaki
14.6. Rath Group
14.7. Industrial Minerals and Refractories
14.8. Vitcas
14.9. Blue Refractories Liaoning Co., Ltd.
14.10. Dalmia OCL
14.11. Others