Public Safety and Security Market Size (By Solution, By Service, By Deployment Mode, By Application, and By Geography) - Global Industry, Share, Analysis, Trends and Forecast 2024 - 2032
Published :
Report ID:
Pages :
Format :
Public Safety and Security Market Size (By Solution, By Service, By Deployment Mode, By Application, and By Geography) - Global Industry, Share, Analysis, Trends and Forecast 2024 - 2032
Report Coverage
- Industry Dynamics
- Market Size and Forecast Data
- Segment Analysis
- Competitive Landscape
- Regional Analysis with a Niche Focus on Country-Level Data
- High Level Analysis - Porter's, PESTEL, Value Chain, etc.
- Company Profiles of Key Players
- Option to Customize the Report As Per Your Specific Need
Request Sample Report
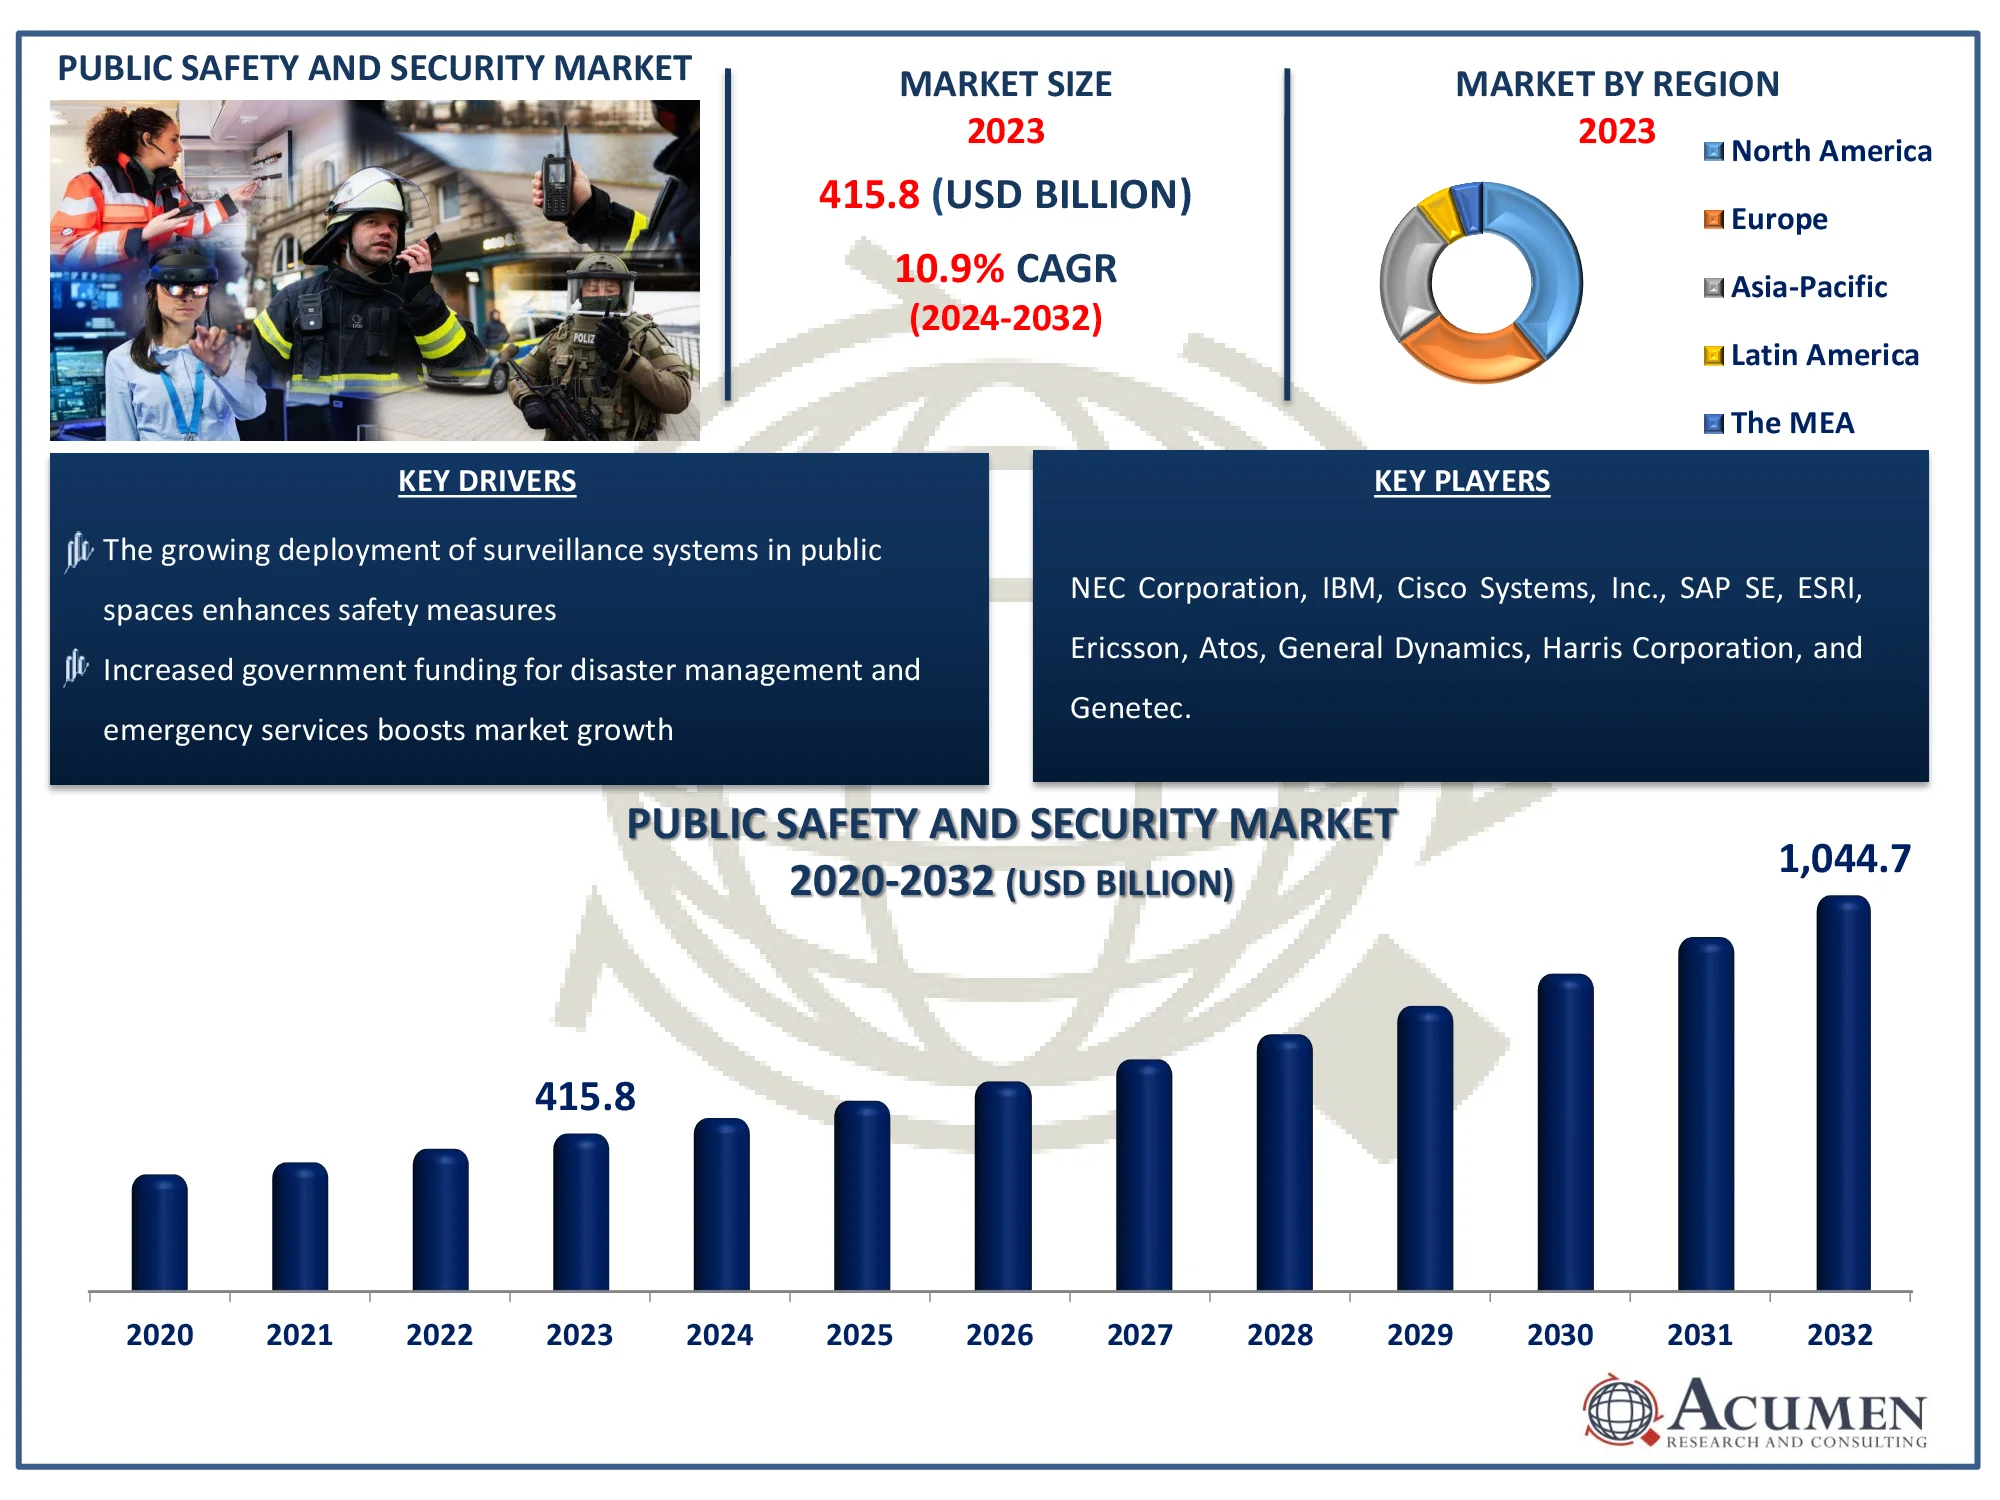
The Global Public Safety and Security Market Size accounted for USD 415.8 Billion in 2023 and is estimated to achieve a market size of USD 1,044.7 Billion by 2032 growing at a CAGR of 10.9% from 2024 to 2032.
Public Safety and Security Market Highlights
- Global public safety and security market revenue is poised to garner USD 1,044.7 billion by 2032 with a CAGR of 10.9% from 2024 to 2032
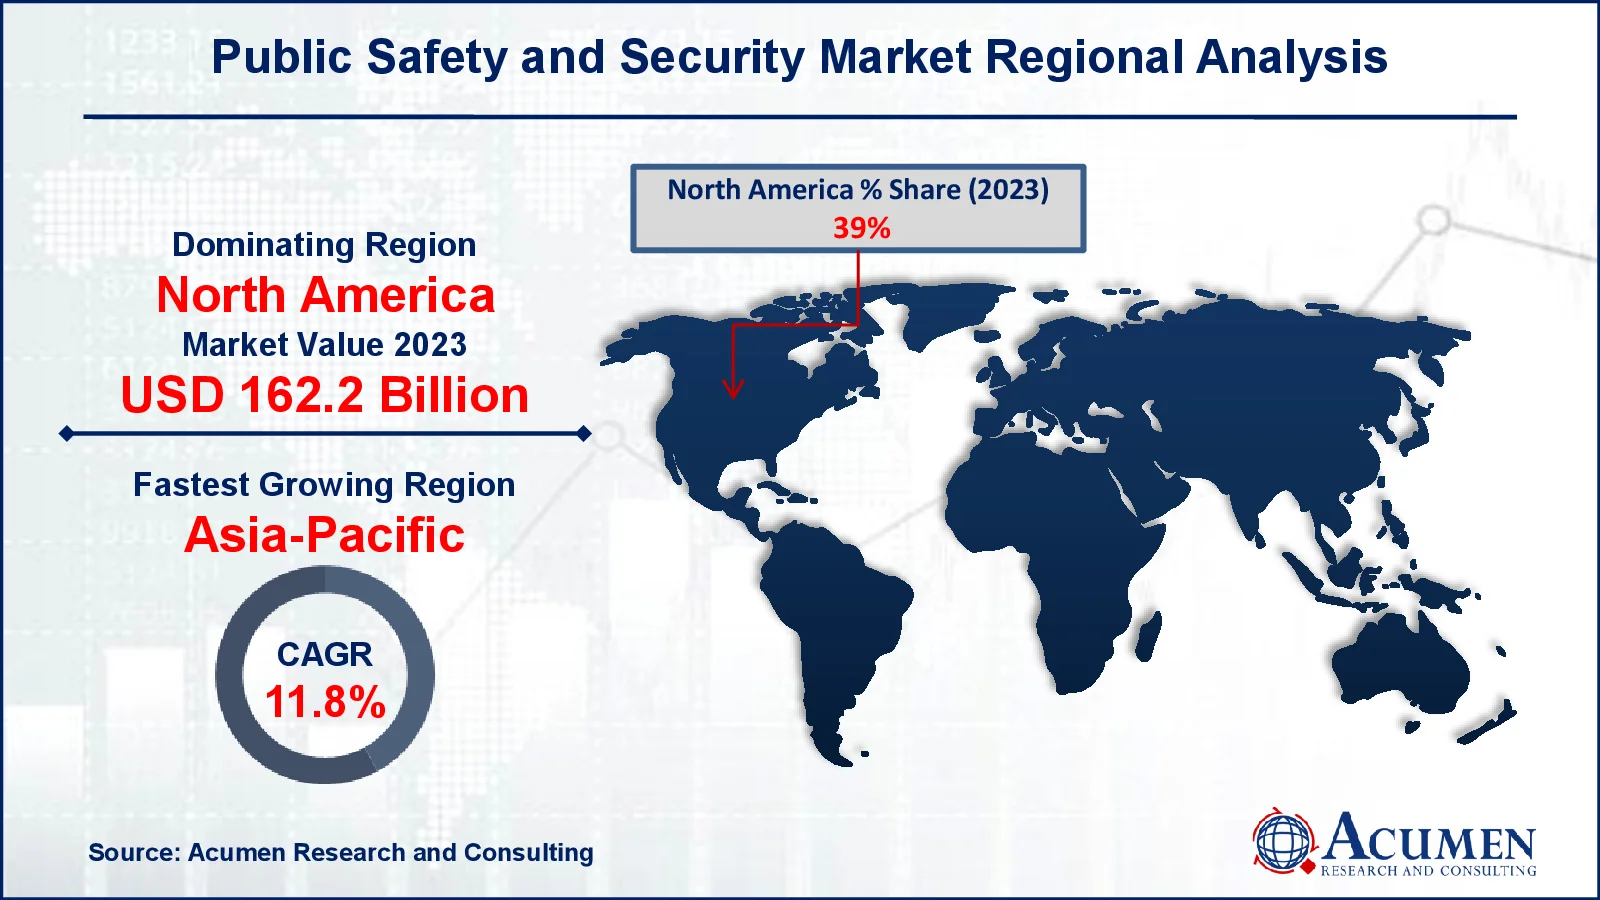
- North America public safety and security market value occupied around USD 162.2 billion in 2023
- Asia-Pacific public safety and security market growth will record a CAGR of more than 11.8% from 2024 to 2032
- Among solution, the critical communication network sub-segment generated more than USD 91.5 billion revenue in 2023
- Based on application, the homeland security sub-segment generated around 30% market share in 2023
- Growing awareness and adoption of public safety solutions in developing economies is a popular public safety and security market trend that fuels the industry demand

The public safety and security market is an important industry that creates and delivers technologies and services to safeguard persons and communities. This market includes a diverse set of solutions, such as surveillance systems, emergency response tools, cybersecurity measures, and disaster management systems. This market's primary goal is to improve public safety, reduce crime, and alleviate the effects of a variety of threats, including terrorism, natural catastrophes, and cyberattacks. The government provides public safety and security to ensure that people, organizations, and infrastructure are safe and protected from harm. Public safety and security systems offer a variety of benefits to their users, including cybersecurity, rapid application development, accessibility, and secure mobility.
Global Public Safety and Security Market Dynamics
Market Drivers
- Increasing threats of cyberattacks are driving the adoption of advanced security systems
- Rising urbanization and smart city initiatives demand robust public safety infrastructure
- The growing deployment of surveillance systems in public spaces enhances safety measures
- Increased government funding for disaster management and emergency services boosts market growth
Market Restraints
- High initial investment and maintenance costs hinder market adoption in developing regions
- Data privacy concerns pose challenges to the deployment of integrated security solutions
- Limited technical expertise in operating advanced safety systems restricts market expansion
Market Opportunities
- Integration of artificial intelligence in surveillance systems offers advanced predictive capabilities
- The emergence of 5G technology facilitates real-time communication in safety applications
- Increasing demand for cloud-based security solutions provides scalable and cost-effective options
Public Safety and Security Market Report Coverage
|
Market |
Public Safety and Security Market |
|
Public Safety and Security Market Size 2023 |
USD 415.8 Billion |
|
Public Safety and Security Market Forecast 2032 |
USD 1,044.7 Billion |
|
Public Safety and Security Market CAGR During 2024 - 2032 |
10.9% |
|
Public Safety and Security Market Analysis Period |
2020 - 2032 |
|
Public Safety and Security Market Base Year |
2023 |
|
Public Safety and Security Market Forecast Data |
2024 - 2032 |
|
Segments Covered |
By Solution, By Service, By Deployment Mode, By Application, and By Geography |
|
Regional Scope |
North America, Europe, Asia Pacific, Latin America, and Middle East & Africa |
|
Key Companies Profiled |
NEC Corporation, IBM, Cisco Systems, Inc., SAP SE, ESRI, Ericsson, Atos, General Dynamics, Harris Corporation, and Genetec. |
|
Report Coverage |
Market Trends, Drivers, Restraints, Competitive Analysis, Player Profiling, Covid-19 Analysis, Regulation Analysis |
Public Safety and Security Market Insights
The growth of the public safety and security market is primarily driven by growing number of criminal activities and terrorist attacks, stringent government regulations regarding public safety, increase in demand for IoT in public safety, rising smart city projects, and technological advancements in public safety and security. Furthermore, increase in government initiatives to reduce the response time and loss caused by man-made and natural disasters, is estimated to boost the market growth. According to Homeland Security of U.S., the government of US has been investing around USD 81 billion on public safety & security by 2021.
Moreover, people and organization are facing threats from natural and manmade disasters, terrorism and cyber attacks, growing safety and security industry, AI in safety and security, technological advancement and increase in the number of applications are expected to create opportunities for the manufacturers in the global market over the forecast period. However, high installations and maintenance cost of public safety and lack of awareness are expected to hamper the growth of the global public safety and security market in the coming years.
Public Safety and Security Market Segmentation
The worldwide market for public safety and security is split based on solution, service, deployment mode, application, and geography.
Public Safety & Security Market By Solution
- Critical Communication Network
- C2/C4ISR System
- Biometric Security and Authentication System
- Surveillance System
- Scanning and Screening System
- Emergency and Disaster Management
- Cybersecurity
- Public Address and General Alarm
- Backup and Recovery System
According to public safety and security industry analysis, critical communication networks account for the majority of this business. These networks are crucial for enabling consistent and reliable communication among public safety personnel such as police, firefighters, and emergency medical services. They enable quick reaction to emergencies, coordinated activities, and efficient information sharing, ultimately improving public safety outcomes.
The emergency and disaster management solution segment expected to grow during the public safety and security market forecast period. Increase in number of natural disasters such as tsunami, cyclones, earthquakes, and any other emergency service and increase in government spending on emergency services, and advantages offered by emergency and disaster management solution such as surveillance systems, simulation systems, and geographic info systems is further expected to raise segment over the forecast period.
Public Safety & Security Market By Service
- Managed Services
- Professional Services
The public safety and security sector divides its services into two categories managed services and professional services. Managed services are the market's largest category. These services include constant monitoring, maintenance, and administration of security systems and infrastructures. This covers duties like system upgrades, security evaluations, and 24/7 monitoring and assistance to ensure optimal system performance and proactive threat detection. Managed services offer various advantages, including cost-effectiveness, increased efficiency, and improved security posture, by leveraging the knowledge of professional service providers.
Public Safety & Security Market By Deployment Mode
- Cloud
- On-premises
In the public safety and security market, cloud deployment is expected to become the most prominent sector. This increase is being driven by the growing use of cloud-based solutions, which are scalable, cost-effective, and simple to implement. Cloud deployment allows real-time data exchange, enhanced analytics, and seamless connection with current systems, all of which are crucial in public safety applications. Furthermore, the growing emphasis on digital transformation, as well as the increasing need for remote access, is driving up demand for cloud solutions. The cloud is a desired option for organizations all over the world due to improved security measures and compliance with strict regulations.
Public Safety & Security Market By Application
- Homeland Security
- Emergency Services
- Logistics & Transportation Systems
- Critical Infrastructure Security
- Others
The homeland security segment accounted for approximately 30% of the share in the global public safety and security market in 2023. Growing number of terrorist attacks and growing investment by government on border security is further expected to raise segment over the forecast period. The homeland security helps in protection of government building, nuclear power plants, and defense due to terrorist focus on these areas for illegal movement of weapons, drugs, contrabands, and people. These factors further grow the demand for public safety and security in homeland security during the forecast period.
Public Safety and Security Market Regional Outlook
North America
- U.S.
- Canada
Europe
- U.K.
- Germany
- France
- Spain
- Rest of Europe
Asia-Pacific
- India
- Japan
- China
- Australia
- South Korea
- Rest of Asia-Pacific
Latin America
- Brazil
- Mexico
- Rest of LATAM
The Middle East & Africa
- South Africa
- GCC Countries
- Rest of the Middle East & Africa (ME&A)

Public Safety and Security Market Regional Analysis
North America accounted for the high market share of the public safety and security market and the region is also expected to maintain its dominance over the forecast period. The region is experiencing the maximum growth owing to the rapid consumption of public safety and security in various applications, presence of public safety and security companies, stable economy, and increased adoption in new technologies. High research and development in public safety and security, development and government initiatives towards improvement of public safety and security, and developed defense infrastructure in the North America region are some of the key factors driving the consumption of public safety and security in this region. Moreover, the presence of major manufacturers, regulatory bodies, research institutes in key countries such as the US and Canada is also propelling the growth of public safety and security in the North America region. Europe is followed by the North America region in the public safety and security market.
Asia-Pacific is expected to hold the highest CAGR in the global market during the forecast period. The growing demand to protect the business from attacks and industry increase in innovation and development in public safety and security, and growing implementation of public safety and security in all verticals, are expected to enhance the market growth in the global public safety and security market during the forecast.
Public Safety and Security Market Players
Some of the top public safety and security companies offered in our report include NEC Corporation, IBM, Cisco Systems, Inc., SAP SE, ESRI, Ericsson, Atos, General Dynamics, Harris Corporation, and Genetec.
Frequently Asked Questions
How big is the public safety and security market?
The public safety and security market size was valued at USD 415.8 Billion in 2023.
What is the CAGR of the global public safety and security market from 2024 to 2032?
The CAGR of public safety and security is 10.9% during the analysis period of 2024 to 2032.
Which are the key players in the public safety and security market?
The key players operating in the global market are including NEC Corporation, IBM, Cisco Systems, Inc., SAP SE, ESRI, Ericsson, Atos, General Dynamics, Harris Corporation, and Genetec.
Which region dominated the global public safety and security market share?
North America held the dominating position in public safety and security industry during the analysis period of 2024 to 2032.
Which region registered fastest CAGR from 2024 to 2032?
Asia-Pacific region exhibited fastest growing CAGR for market of public safety and security during the analysis period of 2024 to 2032.
What are the current trends and dynamics in the global public safety and security industry?
The current trends and dynamics in the public safety and security industry include increasing threats of cyberattacks are driving the adoption of advanced security systems, and rising urbanization and smart city initiatives demand robust public safety infrastructure.
Which deployment mode held the maximum share in 2023?
The cloud deployment mode held the notable share of the public safety and security industry.


