Psoriatic Arthritis Treatment Market | Acumen Research and Consulting
Psoriatic Arthritis Treatment Market Size - Global Industry, Share, Analysis, Trends and Forecast 2024 - 2032
Published :
Report ID:
Pages :
Format : 
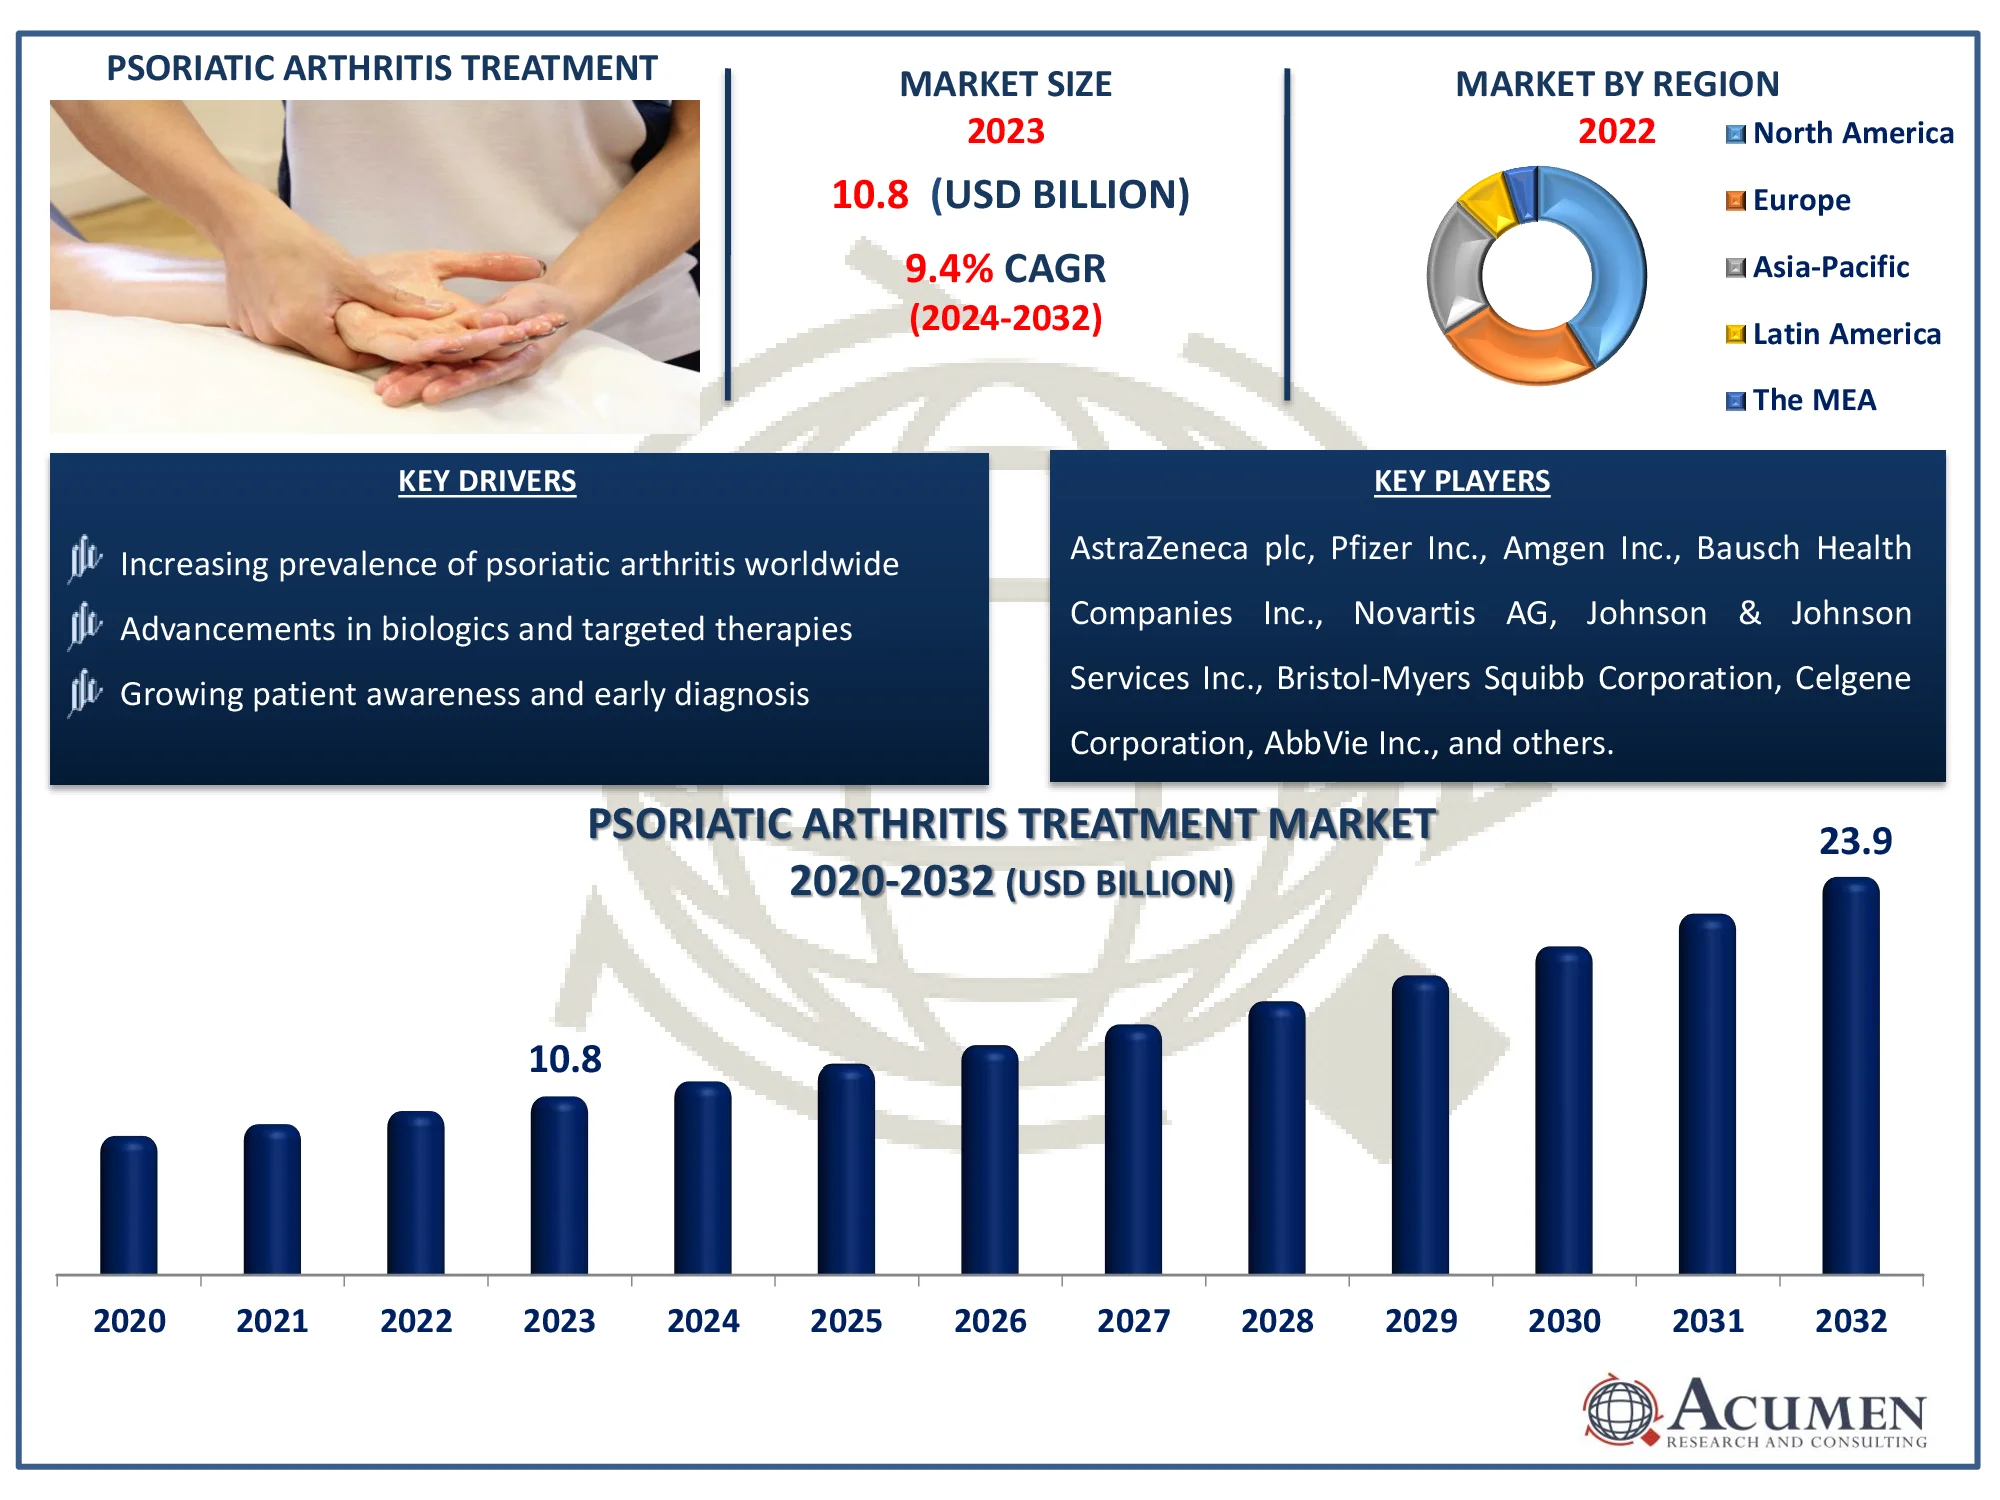
The Global Psoriatic Arthritis Treatment Market Size accounted for USD 10.8 Billion in 2023 and is estimated to achieve a market size of USD 23.9 Billion by 2032 growing at a CAGR of 9.4% from 2024 to 2032.
Psoriatic Arthritis Treatment Market Highlights
- The global psoriatic arthritis treatment market is projected to reach USD 23.9 billion by 2032, with a CAGR of 9.4% from 2024 to 2032
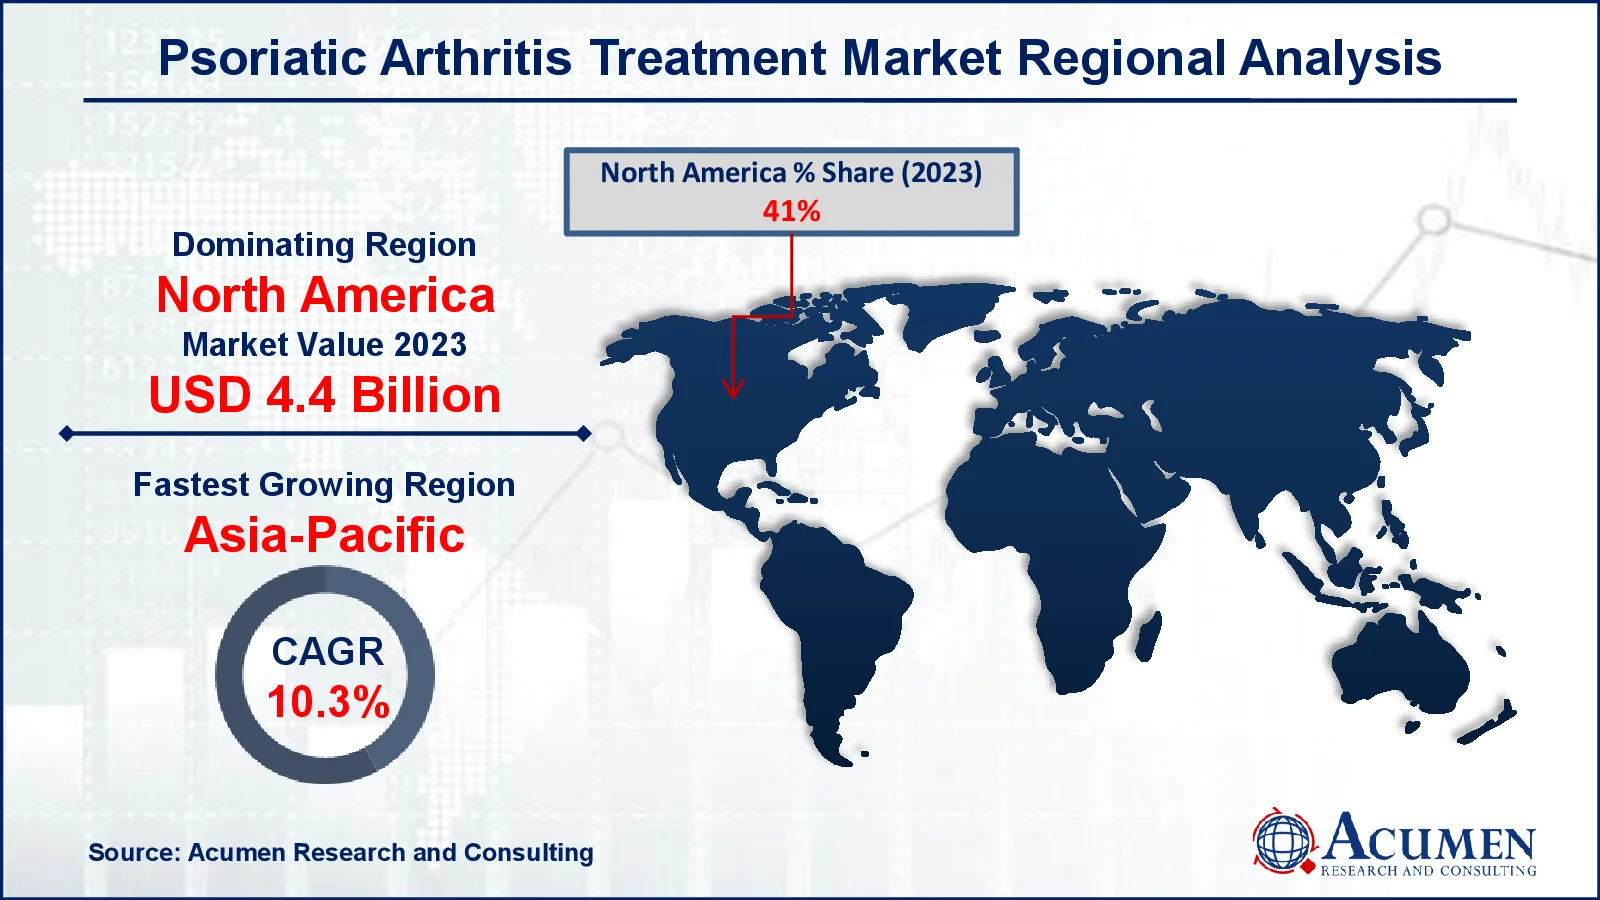
- In 2023, the North America psoriatic arthritis treatment market was valued at approximately USD 4.4 billion
- The Asia-Pacific psoriatic arthritis treatment market is expected to grow at a CAGR of over 10.3% from 2024 to 2032
- In 2023, the DMARD sub-segment accounted for 63% of the market share among drug classes
- The injectable sub-segment generated 58% of the market share based on the route of administration in 2023
- Technological advancements in drug delivery systems, such as injectables and oral formulations, are enhancing patient compliance is the psoriatic arthritis treatment market trend that fuels the industry demand

Psoriatic arthritis is a chronic inflammatory arthritis linked to psoriasis, a skin ailment marked by red, scaly patches. It primarily affects the joints and entheses, which are the points where tendons and ligaments connect to bone, causing pain, swelling, and stiffness. The illness can appear in a variety of ways, including asymmetric oligoarthritis and spondylitis, affecting both small and big joints. To distinguish it from other types of arthritis, it is frequently diagnosed using clinical evaluation, imaging techniques, and laboratory tests. Nonsteroidal anti-inflammatory medications (NSAIDs), disease-modifying antirheumatic medicines (DMARDs), and biologic therapy designed to regulate inflammation and prevent joint damage are commonly used in treatment. Early detection and treatment are critical for improving patients' long-term prognosis and quality of life.
Global Psoriatic Arthritis Treatment Market Dynamics
Market Drivers
- Increasing prevalence of psoriatic arthritis worldwide
- Advancements in biologics and targeted therapies
- Growing patient awareness and early diagnosis
Market Restraints
- High cost of biologic treatments
- Limited access to healthcare in developing regions
- Adverse side effects associated with long-term medication
Market Opportunities
- Emerging markets offering untapped growth potential
- Development of personalized treatment options
- Expansion of telemedicine and online pharmacy services
Psoriatic Arthritis Treatment Market Report Coverage
| Market | Psoriatic Arthritis Treatment Market |
| Psoriatic Arthritis Treatment Market Size 2022 |
USD 10.8 Billion |
| Psoriatic Arthritis Treatment Market Forecast 2032 | USD 23.9 Billion |
| Psoriatic Arthritis Treatment Market CAGR During 2023 - 2032 | 9.4% |
| Psoriatic Arthritis Treatment Market Analysis Period | 2020 - 2032 |
| Psoriatic Arthritis Treatment Market Base Year |
2022 |
| Psoriatic Arthritis Treatment Market Forecast Data | 2023 - 2032 |
| Segments Covered | By Drug Class, By Product Type, By Route Of Administration, By Distribution Channel, And By Geography |
| Regional Scope | North America, Europe, Asia Pacific, Latin America, and Middle East & Africa |
| Key Companies Profiled | AstraZeneca plc, Pfizer Inc., Amgen Inc., Bausch Health Companies Inc., Bristol-Myers Squibb Corporation, Novartis International AG, Johnson & Johnson Services Inc., Celgene Corporation, AbbVie Inc., and Eli Lilly and Company |
| Report Coverage |
Market Trends, Drivers, Restraints, Competitive Analysis, Player Profiling, Covid-19 Analysis, Regulation Analysis |
Psoriatic Arthritis Treatment Market Insights
The majority of psoriasis patients were initially diagnosed with psoriatic arthritis and then with psoriasis. For instance, according to the National Psoriasis Foundation, more than 8 million Americans have psoriasis. According to the World Psoriasis Day consortium, psoriasis affects 125 million individuals globally, or 2 to 3 percent of the overall population. An estimated 30% of persons with psoriasis develop psoriatic arthritis. The frequency of psoriasis in African Americans is 1.5 percent, compared to 3.6 percent among Caucasians. The symptoms of psoriatic arthritis include swollen joints, nail pitting, low back discomfort, conjunctivitis, and foot pain. Some of the variables expected to accelerate development include promising pipelines, the introduction of new products, an increased risk of disease, and a significant rise in customer awareness.
Psoriatic arthritis can be misinterpreted as either RA or gout. Increased consumer awareness, on the other hand, is likely to reduce misdiagnosis or erroneous therapy rates, as evidenced by various efforts launched by private and public organizations. Furthermore, increased therapy costs and undesirable effects from certain medications are expected to limit market expansion.
Psoriatic arthritis therapy, driven by biologics focused effects and biological development, represents a significant paradigm shift. However, customer demand for cost-effective pharmaceutical items with improved safety and efficacy profiles might have a positive impact on market dynamics.
The development of tailored therapy options in the psoriatic arthritis market presents considerable prospects by adapting medicines to unique patient profiles, hence increasing treatment efficacy. For instance, according to National Human Genome Research Institute, personalized medicine is a relatively new medical technique that analyzes an individual's genetic profile to guide illness prevention, diagnosis, and treatment decisions. With advances in genetic and biomarker studies, medications can be more precisely tailored to a patient's unique immune response and disease development. This tailored strategy improves patient outcomes while simultaneously reducing side effects.
Psoriatic Arthritis Treatment Market Segmentation
The worldwide market for psoriatic arthritis treatment is split based on drug class, product type, route of administration, distribution channel, and geography.
Psoriatic Arthritis Treatment Industry By Drug Class
- DMARD
- NSAIDs
- Biologics
- Others
According to the psoriatic arthritis treatment industry analysis, the DMARD (Disease-Modifying Antirheumatic Drugs) medicine class has dominated the market due to its ability to reduce disease progression and prevent joint destruction. These drugs, which include both standard DMARDs such as methotrexate and newer biologic treatments, target specific inflammatory pathways. Their effectiveness in controlling both joint and skin symptoms of psoriatic arthritis makes them an essential component of treatment. Furthermore, growing awareness of early intervention and treatment options has accelerated the use of DMARDs in clinical settings.
Psoriatic Arthritis Treatment Industry By Product Type
- OTC
- Prescriptions
According to the psoriatic arthritis treatment industry analysis, prescription drugs were conducted in 2023 via Over-the-Counter (OTC) items and are predicted to maintain leadership throughout the forecast year. Because most biologics and DMARDs were marketed as prescriptions, the industry kept the majority of its revenue in 2023. Selected NSAIDs are available as over-the-counter psoriatic arthritis medicines. Over-the-counter medications for psoriatic arthritis are expected to lose stock during the projection period. The declining trend is attributed to the increasing availability and prescription of biologics and biosimilars.
Psoriatic Arthritis Treatment Industry By Route of Administration
- Oral
- Topical
- Injectable
According to the psoriatic arthritis treatment industry analysis, in terms of route of administration, injectable medications resulted in the psoriatic arthritis (PsA) market for therapy. The industry is also likely to grow rapidly in the coming years as more biological and biosimilar products are introduced. Many biologics can be injected subcutaneously or intravenously. Subjects of upgraded choices with more efficient mechanistic actions are projected to lose significant market share. Throughout the forecast period, oral products will maintain their market share.
Psoriatic Arthritis Treatment Industry By Distribution Channel
- Hospital Pharmacies
- Retail Pharmacies
- Online Pharmacies
According to the psoriatic arthritis treatment market forecast, hospital pharmacists dominate market because to the high administration requirements of many sophisticated biologic medicines, which are frequently administered via injection or infusion. These medications, which include TNF inhibitors and IL-17 inhibitors, are normally delivered under medical supervision; hence hospitals are the principal distribution points. In addition, hospital pharmacy provides the experience required to manage complex treatment regimens and monitor for any adverse effects.
Psoriatic Arthritis Treatment Market Regional Outlook
North America
- U.S.
- Canada
Europe
- U.K.
- Germany
- France
- Spain
- Rest of Europe
Asia-Pacific
- India
- Japan
- China
- Australia
- South Korea
- Rest of Asia-Pacific
Latin America
- Brazil
- Mexico
- Rest of Latin America
The Middle East & Africa
- South Africa
- GCC Countries
- Rest of the Middle East & Africa (ME&A)

Psoriatic Arthritis Treatment Market Regional Analysis
For several reasons, this was made possible by more than half of North America's and Europe's combined wealth. North America dominated the regional markets, driven mostly by product revenues from the US market. For instance, in October 2023, Novartis gained FDA clearance for an intravenous formulation of Cosentyx, expanding its indication to treat people with psoriatic arthritis, ankylosing spondylitis, and non-radiographic axial spondyloarthritis. This approval aims to broaden therapy options for psoriatic arthritis by supplementing existing biologic intravenous medications. Furthermore, the attendance of major producers, proactive government initiatives, favorable reimbursement regulations, and a large patient pool all contribute to the growth of the PsA therapy sector.
Asia-Pacific is expected to be one of the fastest-growing regions over the projection period. Biosimilar trends are a major driver of growth in emerging economies including China, India, and South Korea. Furthermore, overall economic development, improved health infrastructure, expanded availability, and consumer awareness are all expected to add to the regional growth rate.
As fertility in the region has declined over time, Europe held the majority of the market share in 2023.
Psoriatic Arthritis Treatment Market Players
Some of the top psoriatic arthritis treatment companies offered in our report include AstraZeneca plc, Pfizer Inc., Amgen Inc., Bausch Health Companies Inc., Bristol-Myers Squibb Corporation, Novartis International AG, Johnson & Johnson Services Inc., Celgene Corporation, AbbVie Inc, and Eli Lilly and Company.
Frequently Asked Questions
How big is the psoriatic arthritis treatment market?
The psoriatic arthritis treatment market size was valued at USD 10.8 billion in 2023.
What is the CAGR of the global psoriatic arthritis treatment market from 2024 to 2032?
The CAGR of Psoriatic Arthritis Treatment is 9.4% during the analysis period of 2024 to 2032.
Which are the key players in the psoriatic arthritis treatment market?
The key players operating in the global market are including AstraZeneca plc, Pfizer Inc., Amgen Inc., Bausch Health Companies Inc., Bristol-Myers Squibb Corporation, Novartis International AG, Johnson & Johnson Services Inc., Celgene Corporation, AbbVie Inc., and Eli Lilly and Company
Which region dominated the global psoriatic arthritis treatment market share?
North America held the dominating position in psoriatic arthritis treatment industry during the analysis period of 2024 to 2032.
Which region registered fastest growing CAGR from 2024 to 2032?
Asia-Pacific region exhibited fastest growing CAGR for market of psoriatic arthritis treatment during the analysis period of 2024 to 2032.
What are the current trends and dynamics in the global psoriatic arthritis treatment industry?
The current trends and dynamics in the psoriatic arthritis treatment industry include increasing prevalence of psoriatic arthritis worldwide, advancements in biologics and targeted therapies, and growing patient awareness and early diagnosis.
Which drug class held the maximum share in 2023?
The DMARD drug class held the maximum share of the psoriatic arthritis treatment industry.
Select Licence Type
Connect with our sales team
Why Acumen Research And Consulting
100%
Customer Satisfaction
24x7
Availability - we are always there when you need us
200+
Fortune 50 Companies trust Acumen Research and Consulting
80%
of our reports are exclusive and first in the industry
100%
more data and analysis
1000+
reports published till date


