Prosthetics and Orthotics Market Size - Global Industry, Share, Analysis, Trends and Forecast 2025 - 2033
Published :
Report ID:
Pages :
Format :
Prosthetics and Orthotics Market Size - Global Industry, Share, Analysis, Trends and Forecast 2025 - 2033
Report Coverage
- Industry Dynamics
- Market Size and Forecast Data
- Segment Analysis
- Competitive Landscape
- Regional Analysis with a Niche Focus on Country-Level Data
- High Level Analysis - Porter's, PESTEL, Value Chain, etc.
- Company Profiles of Key Players
- Option to Customize the Report As Per Your Specific Need
Request Sample Report
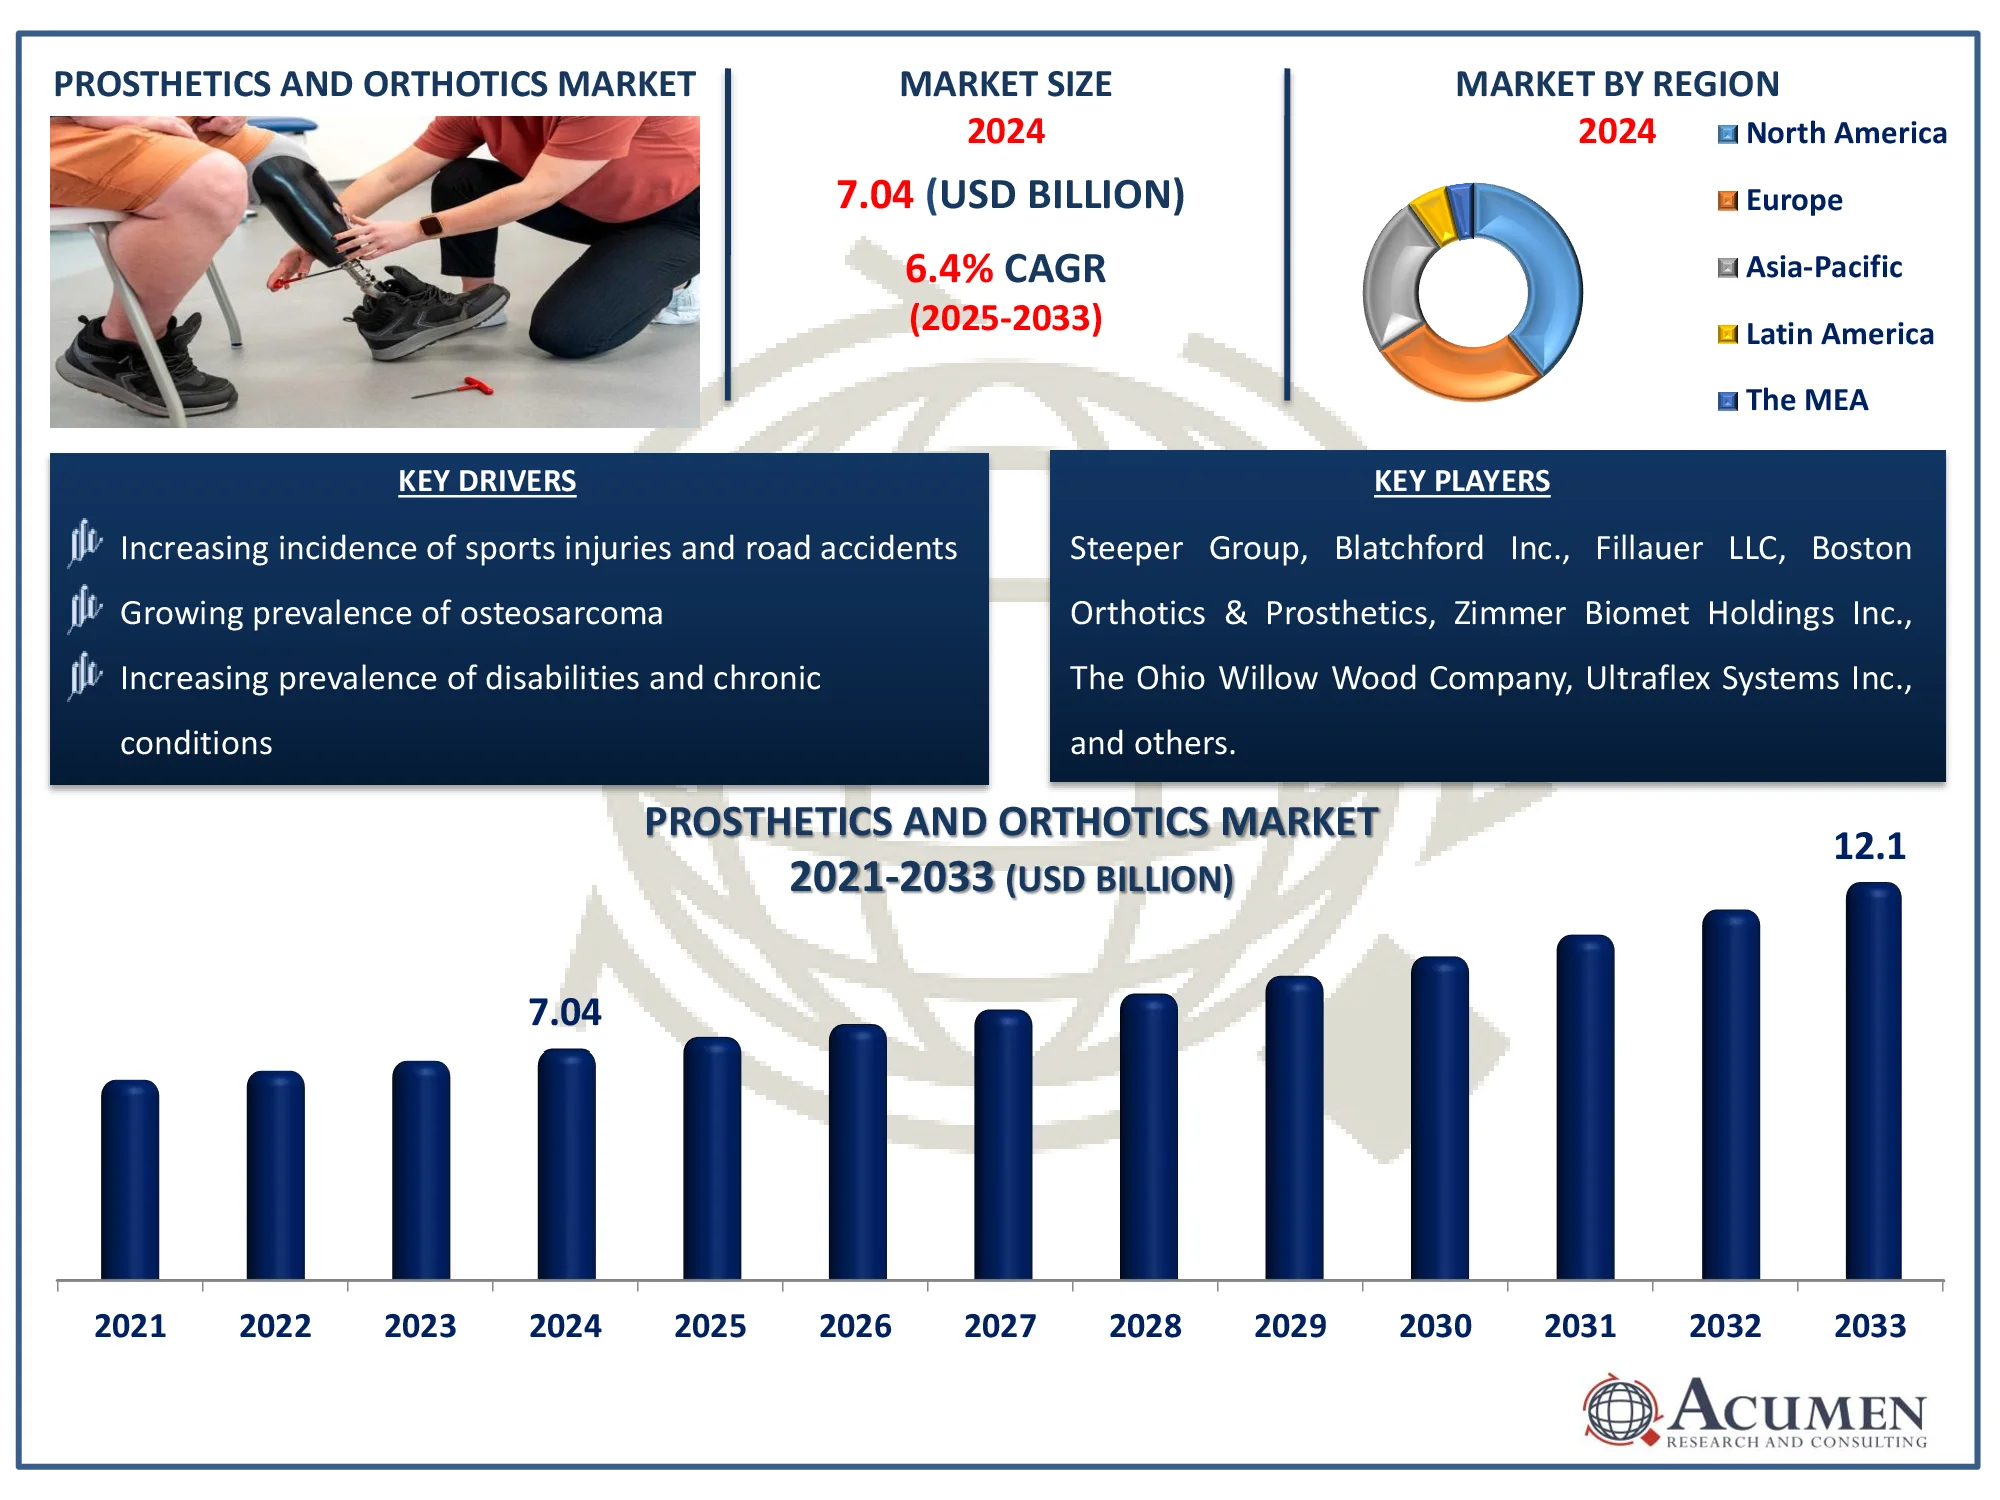
The Global Prosthetics and Orthotics Market Size accounted for USD 7.04 Billion in 2024 and is estimated to achieve a market size of USD 12.1 Billion by 2033 growing at a CAGR of 6.4% from 2025 to 2033.
Prosthetics and Orthotics Market Highlights
- The global prosthetics and orthotics market is expected to reach USD 12.1 billion by 2033, growing at a CAGR of 6.4% from 2025 to 2033
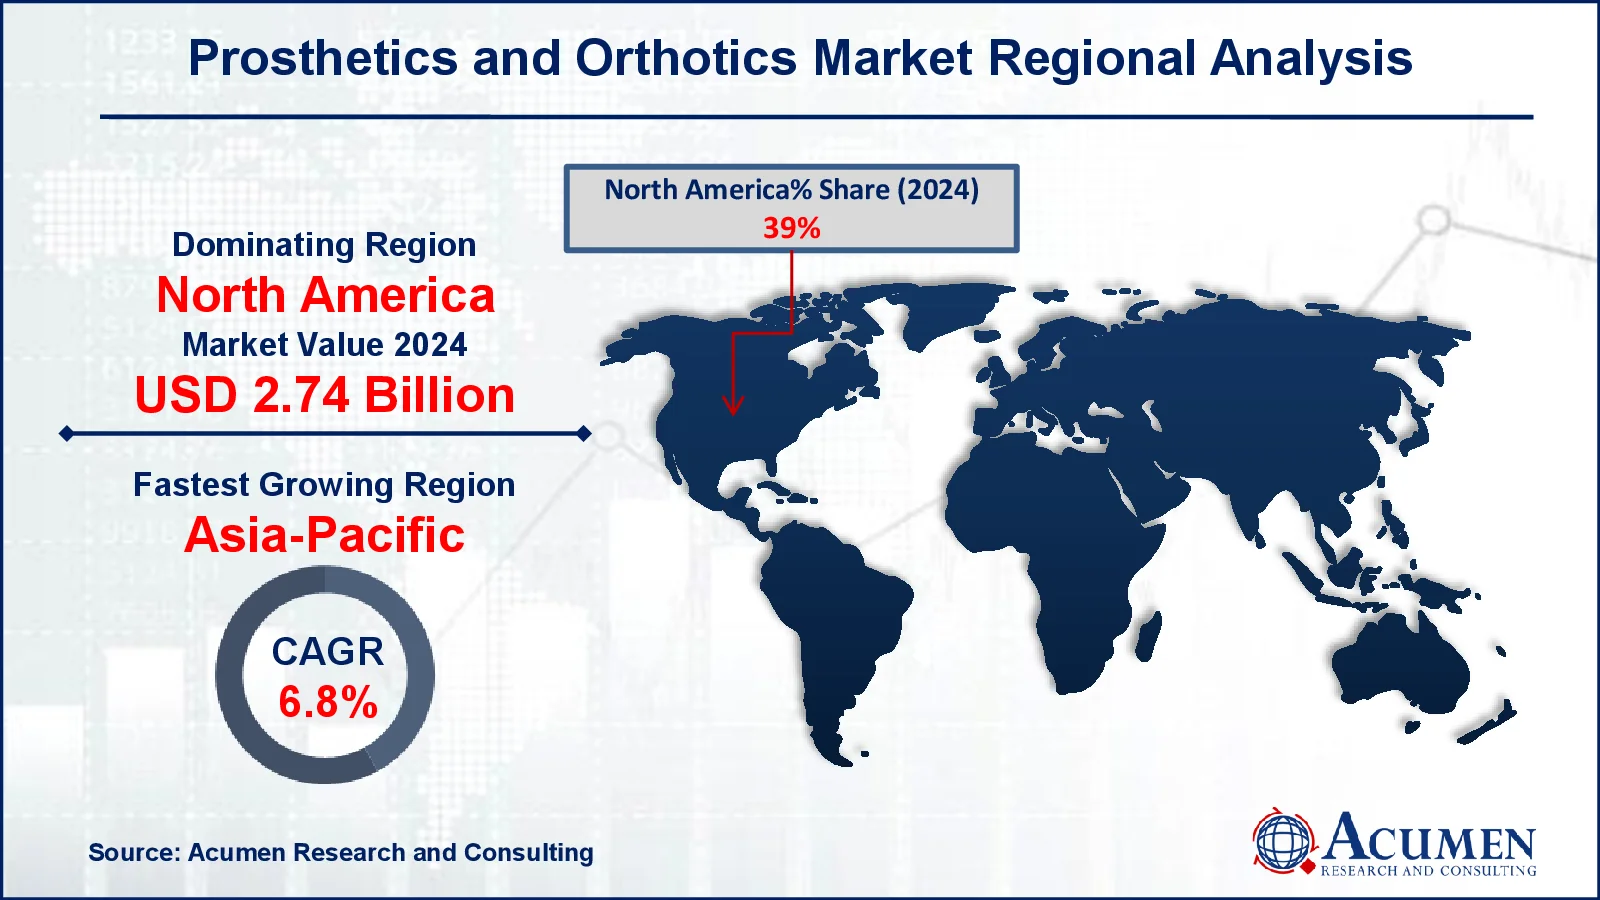
- The North America prosthetics and orthotics market was valued at approximately USD 2.74 billion in 2024
- The Asia-Pacific region is projected to grow at a CAGR of over 6.8% from 2025 to 2033
- The orthotics sub-segment accounted for 61% of the market share in 2024
- Conventional technologies represented 48% of the market share in 2024
- AI-powered bionic limbs with advanced sensory feedback for enhanced mobility is a popular market trend that fuels the industry demand

Prosthetics and orthotics are specialist clinical fields that create and provide artificial limbs for people who have had amputations, as well as supportive devices (orthoses) for those who have musculoskeletal weakness or neurological diseases. Each device must be carefully crafted with the appropriate materials, design, alignment, and construction to meet the user's specific functional requirements. These requirements differ between upper and lower extremities, as well as between prosthetic and orthotic applications. Upper limb prostheses must facilitate reaching, grasping, and specific occupational tasks such as painting, hammering, or lifting, along with essential daily activities like writing, eating, and dressing. In contrast, lower limb prostheses prioritize stability for standing and walking, energy efficiency, shock absorption, and aesthetic appeal, while also accommodating high-performance functions such as running, jumping, and other athletic pursuits.
Global Prosthetics and Orthotics Market Dynamics
Market Drivers
- Increasing incidence of sports injuries and road accidents
- Growing prevalence of osteosarcoma
- Increasing prevalence of disabilities and chronic conditions
- Advancements in technology and materials for prosthetics and orthotics
- The growing aging population and related mobility issues
Market Restraints
- Lack of adequate healthcare infrastructure
- High costs associated with prosthetic and orthotic devices
- Limited reimbursement policies and insurance coverage
- Lack of skilled professionals and expertise in the field
- Social stigma and psychological barriers associated with using prosthetics
Market Opportunities
- Expanding healthcare infrastructure in developing regions
- Growing demand for personalized and customizable prosthetic solutions
- Integration of artificial intelligence and robotics in prosthetics and orthotics
- Collaborations between research institutions and industry players
Prosthetics and Orthotics Market Report Coverage
|
Market |
Prosthetics and Orthotics Market |
|
Prosthetics and Orthotics Market Size 2024 |
USD 7.04 Billion |
|
Prosthetics and Orthotics Market Forecast 2033 |
USD 12.1 Billion |
|
Prosthetics and Orthotics Market CAGR During 2025 - 2033 |
6.4% |
|
Prosthetics and Orthotics Market Analysis Period |
2021 - 2033 |
|
Prosthetics and Orthotics Market Base Year |
2024 |
|
Prosthetics and Orthotics Market Forecast Data |
2025 - 2033 |
|
Segments Covered |
By Type, By Technology, By End-User, and By Geography |
|
Regional Scope |
North America, Europe, Asia Pacific, Latin America, and Middle East & Africa |
|
Key Companies Profiled Aviation |
Steeper Group, Blatchford Inc., Fillauer LLC, Boston Orthotics & Prosthetics, Zimmer Biomet Holdings Inc., The Ohio Willow Wood Company, Ultraflex Systems Inc., Ossur, Ottobock Healthcare GmbH, and BCP Group. |
|
Report Coverage |
Market Trends, Drivers, Restraints, Competitive Analysis, Player Profiling, Covid-19 Analysis, Regulation Analysis |
Prosthetics and Orthotics Market Insights
The growing incidence of sports injuries and road accidents, along with the rising prevalence of osteosarcoma due to unhealthy lifestyles and an aging population, is expected to drive market growth for prosthetics and orthotics. For instance, according to the National Institutes of Health (NIH), osteosarcoma, or osteogenic sarcoma, is the most common primary malignant bone tumor, accounting for around 20% of all cases. Osteosarcoma has a bimodal age distribution and typically affects the extremities. Approximately 75% of osteosarcoma diagnoses occur in patients under the age of 25, with an average age of 20. However, osteosarcoma frequently occurs in people aged 65 and up as a result of irradiation or Paget's disease of the bone.
Furthermore, rising awareness of these medical solutions and an increase in diabetes-related amputations are driving market growth. The ongoing rise in traffic accidents is a major factor driving this trend. According to the WHO's road safety infographics, roughly 20-50 million people worldwide are injured or disabled as a result of vehicle accidents each year. In the United States alone, around 2.35 million individuals are injured or incapacitated each year, with over 37,000 fatalities due from traffic accidents.
Despite these development drivers, various hurdles may hamper market progress. These include a dearth of well-equipped rehabilitation institutions, the high cost of therapy, and poor payment regulations in many parts of the world.
 Prosthetics and Orthotics Market Segmentation
The worldwide market for prosthetics and orthotics is split based on type, technology, end-user, and geography.
Prosthetics and Orthotics Market By Type
- Orthotics
- Upper Limb
- Lower Limb
- Spinal
- Prosthetics
- Upper Extremity
- Lower Extremity
- Liners
- Sockets
- Modular Technology
According to prosthetics and orthotics industry analysis, orthotics accounted for the biggest market share in 2024, driven by factors such as increased sports injury rates, osteoarthritis prevalence, unhealthy lifestyles, the introduction of new products, and the growing use of innovative orthopedic technology. According to United Nations figures, the world's population aged 60 and more is expected to more than double from 962 million in 2017 to 2.1 billion by 2050. The elderly are more likely to develop orthopedic disorders such as osteopenia and osteoporosis, making them a substantial consumer base for orthopedic products.
Upper limb orthotics dominated the orthotics market due to their ability to reduce pain and shorten recovery time. However, the spinal orthotics segment is predicted to develop the fastest, driven by an aging population, an increase in spinal injuries, and unhealthy lifestyle factors such as stress, long working hours, and decreased physical exercise. In the prosthetics area, the upper extremity category had the biggest market share.
Prosthetics and Orthotics Market By Technology
- Conventional
- Electric Powered
- Hybrid Orthopedic Prosthetics
According to prosthetics and orthotics industry analysis, during the COVID-19 pandemic, the National Association for the Advancement of Orthotics and Prosthetics issued an advisory to state and local health authorities in the United States, emphasizing the importance of classifying orthopedic and prosthetic services as essential and ensuring that they are available to those in need. In 2024, the traditional segment dominated the worldwide prosthetics and orthotics market, owing to its low cost. This technology provides various advantages, including safety, energy efficiency, and stability, making it a desirable choice for consumers. These benefits are projected to promote further expansion in this category.
Prosthetics and Orthotics Market By End-user
- Hospital
- Clinic
- Others
According to prosthetics and orthotics market forecast, in 2024, clinics had the biggest market share and are likely to maintain that position during the forecast period. This is largely due to the population's preference for perioperative monitoring in hospitals, as well as better hospital and clinic accessibility following the COVID-19 pandemic. Prosthetics and orthotics clinics are expected to have a larger market presence due to investments by corporations looking to open their own clinics in addition to their product offers. This segment's considerable market share is due to an increasing number of amputee patients, the availability of qualified medical personnel, and the tailored care provided to each patient. Furthermore, the hospital segment is likely to experience consistent expansion, underpinned by its enormous infrastructure and strong financial resources.
Prosthetics and Orthotics Market Regional Outlook
North America
- U.S.
- Canada
Europe
- U.K.
- Germany
- France
- Spain
- Rest of Europe
Asia-Pacific
- India
- Japan
- China
- Australia
- South Korea
- Rest of Asia-Pacific
Latin America
- Brazil
- Mexico
- Rest of LATAM
The Middle East & Africa
- South Africa
- GCC Countries
- Rest of the Middle East & Africa (ME&A)
 Prosthetics and Orthotics Market Regional Analysis
In terms of regional segments, in 2024, North America dominated the prosthetics and orthotics market, owing to a well-established healthcare infrastructure, attractive reimbursement policies, the presence of prominent market participants, and large R&D investments. For example, in June 2023, Fillauer unveiled the Myo/One Electrode system, which was developed in collaboration with Coapt. It is a compact, waterproof solution that includes a single preamplifier with two EMG signal channels for myoelectric devices and replaces fabrication aids, sealing rings, wires, and other equipment with a cable.
However, the Asia-Pacific region is likely to have significant growth over the projection period. Factors such as rising traffic accident rates, supportive government initiatives, and increased knowledge of modern prosthetic and orthotic treatments are expected to drive market growth. Furthermore, increased disposable income in emerging markets such as China, India, South Korea, and Indonesia is driving market expansion.
Prosthetics and Orthotics Market Players
Some of the top prosthetics and orthotics companies offered in our report include Steeper Group, Blatchford Inc., Fillauer LLC, Boston Orthotics & Prosthetics, Zimmer Biomet Holdings Inc., The Ohio Willow Wood Company, Ultraflex Systems Inc., Ossur, Ottobock Healthcare GmbH, and BCP Group.
Frequently Asked Questions
What was the market size of the global Prosthetics and Orthotics in 2024?
The market size of prosthetics and orthotics was USD 7.04 Billion in 2024.
What is the CAGR of the global Prosthetics and Orthotics market from 2025 to 2033?
The CAGR of prosthetics and orthotics is 6.4% during the analysis period of 2025 to 2033.
Which are the key players in the Prosthetics and Orthotics market?
The key players operating in the global market are including Steeper Group, Blatchford Inc., Fillauer LLC, Boston Orthotics & Prosthetics, Zimmer Biomet Holdings Inc., The Ohio Willow Wood Company, Ultraflex Systems Inc., Ossur, Ottobock Healthcare GmbH, and BCP Group.
Which region dominated the global Prosthetics and Orthotics market share?
North America held the dominating position in prosthetics and orthotics industry during the analysis period of 2025 to 2033.
Which region registered fastest CAGR from 2025 to 2033?
Asia-Pacific region exhibited fastest growing CAGR for market of prosthetics and orthotics during the analysis period of 2025 to 2033.
What are the current trends and dynamics in the global Prosthetics and Orthotics industry?
The current trends and dynamics in the prosthetics and orthotics industry increasing incidence of sports injuries and road accidents, growing prevalence of osteosarcoma, increasing prevalence of disabilities and chronic conditions, advancements in technology and materials for prosthetics and orthotics, and the growing aging population and related mobility issues
Which type held the maximum share in 2024?
The orthotics held the maximum share of the prosthetics and orthotics industry.


