Prescription Drugs Market Size - Global Industry, Share, Analysis, Trends and Forecast 2022 – 2030
Published :
Report ID:
Pages :
Format :
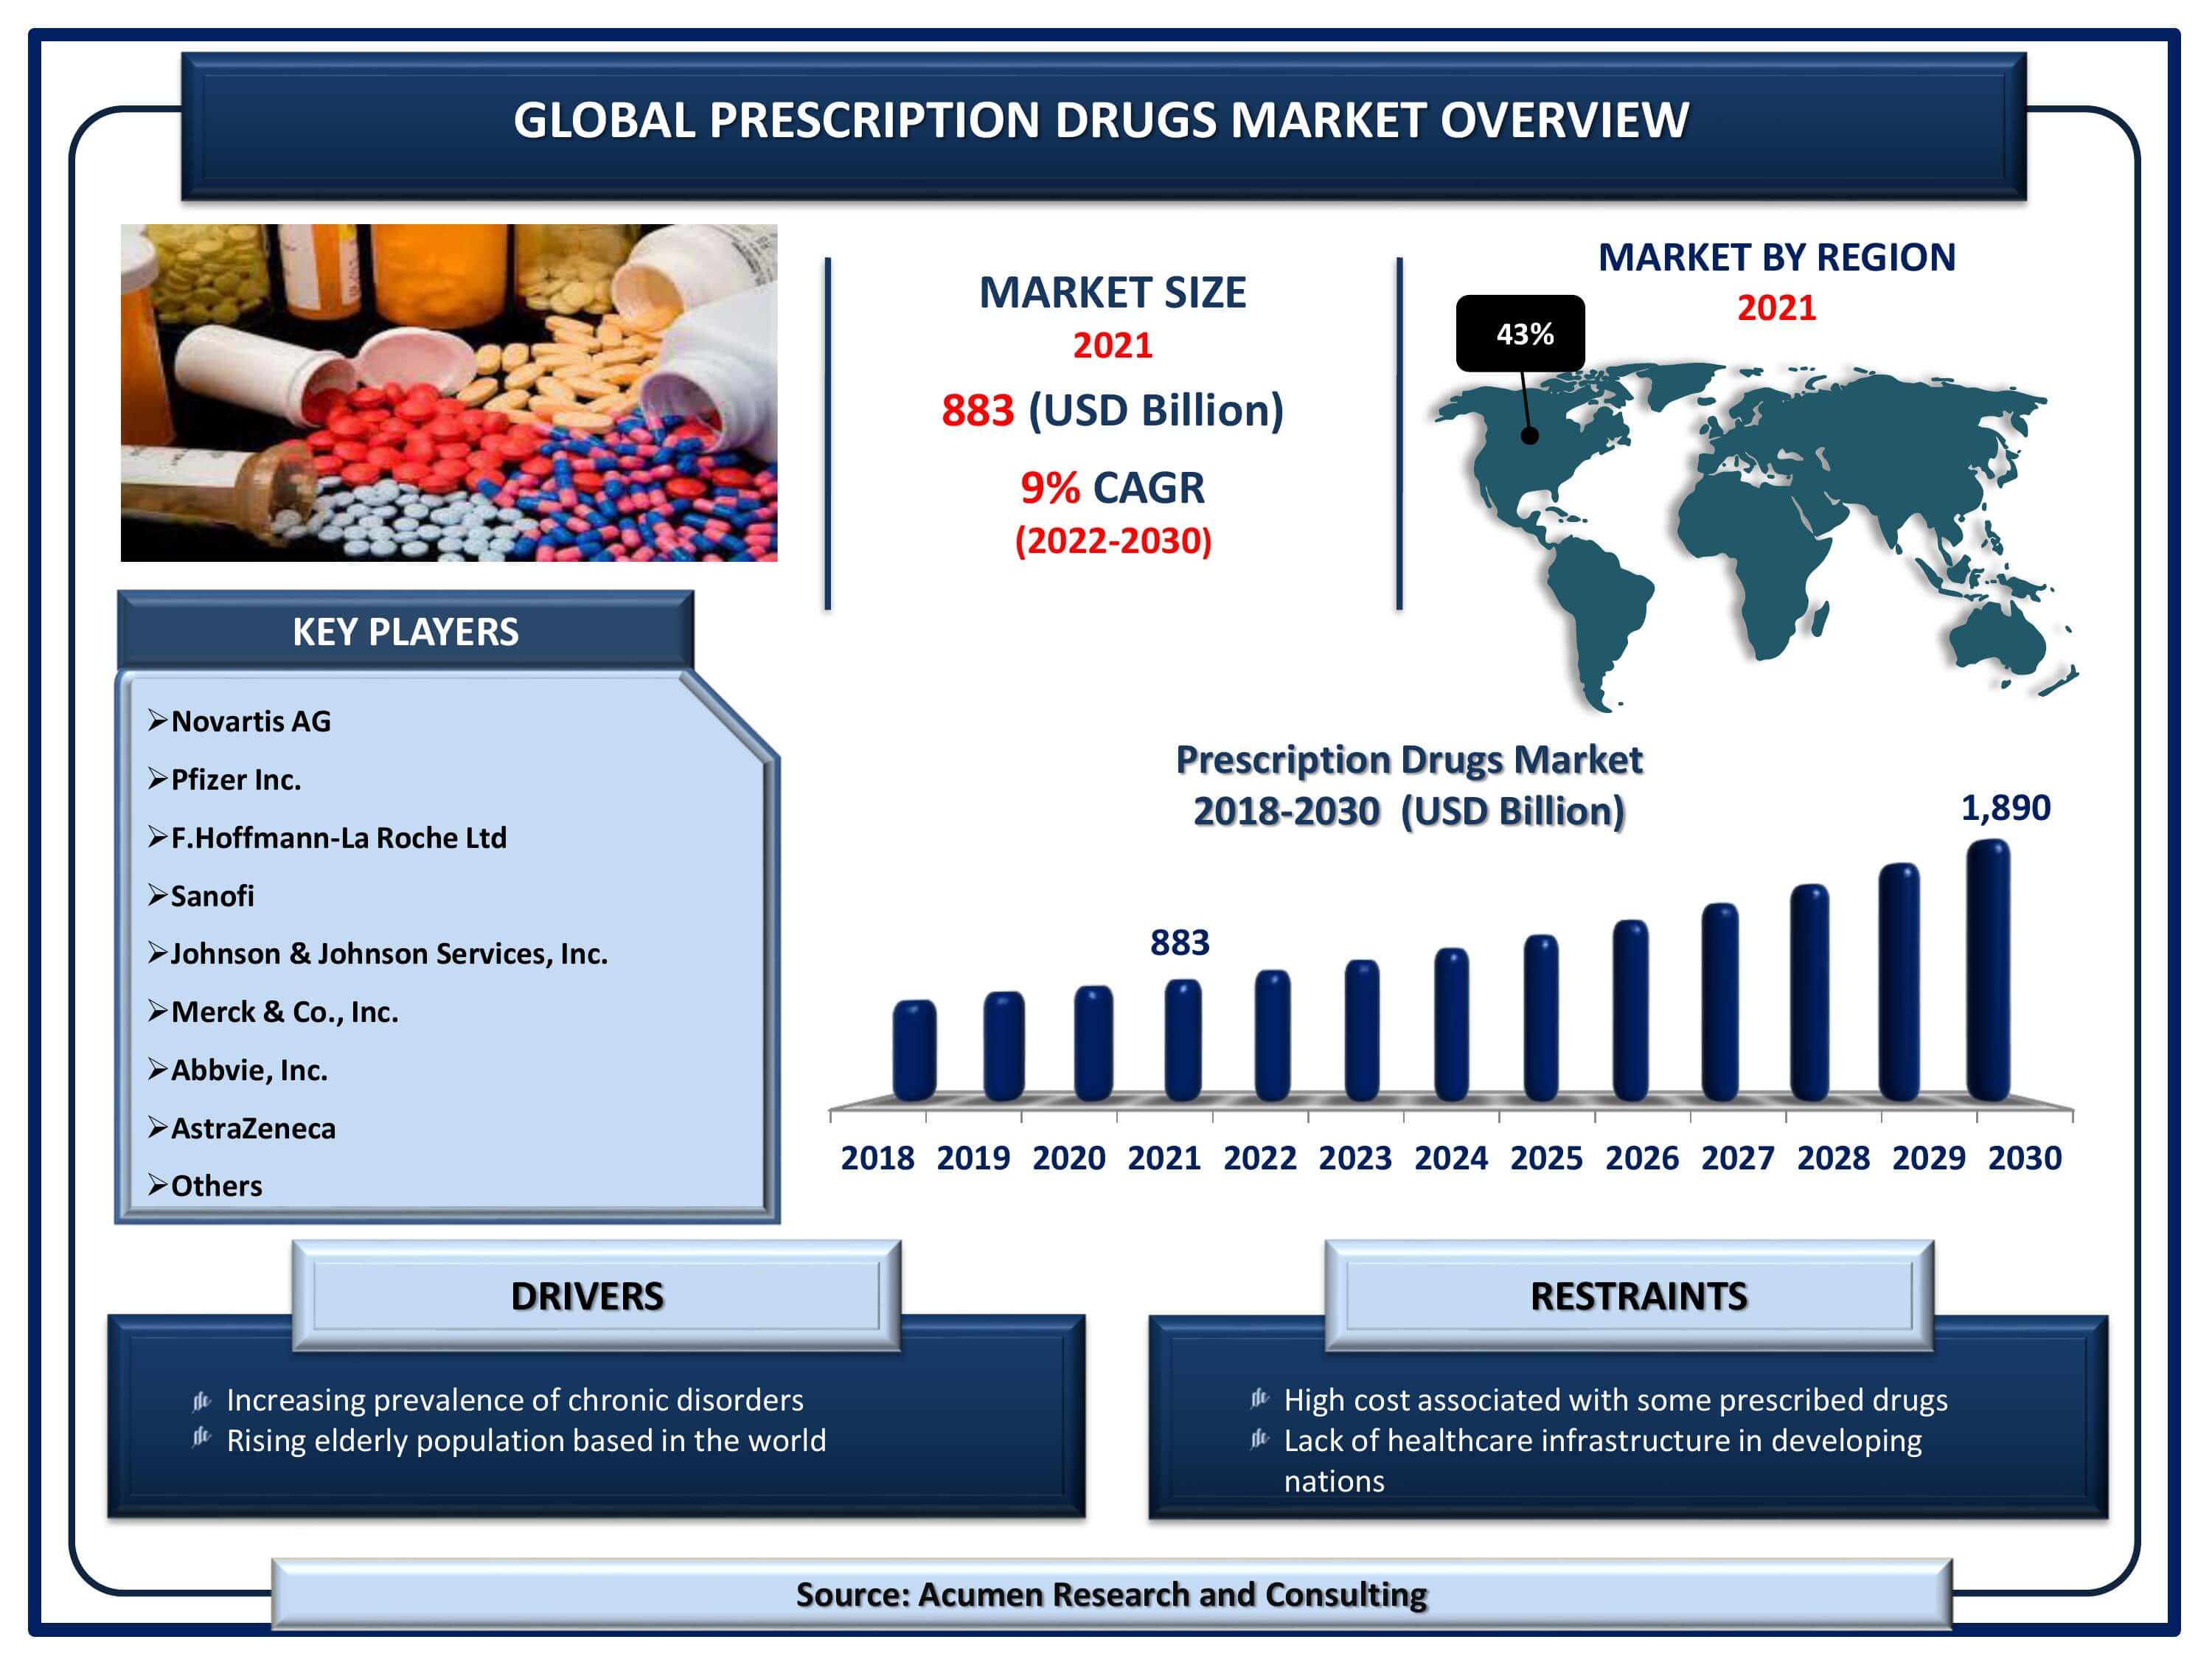
The Global Prescription Drugs Market Size accounted for USD 883 Billion in 2021 and is estimated to garner a market size of USD 1,890 Billion by 2030 rising at a CAGR of 9% from 2022 to 2030. Increasing R&D investments for novel drugs is the primary factor boosting the prescription drugs market size. Growing incidences of chronic disorders is another factor that is flourishing the prescription medicines market growth. In addition to that, rising number of launches of generic equivalents of numerous prominent drugs is witnessed to be a popular prescription drugs market trend that is strengthening the industry growth. Prescription drugs are often strong medication that is why it requires a prescription from the physician. When the medication is prescribed by a doctor, prescription medicines prove helpful in treating many illnesses.

Prescription Drugs Market Report Key Highlights
- Global prescription drugs market revenue is estimated to reach USD 1,890 Billion by 2030 with a CAGR of 9% from 2022 to 2030
- North America prescription drugs market share accounted for over 43% regional shares in 2021
- Asia-Pacific prescription drugs market growth is anticipated to witness fastest CAGR from 2022 to 2030
- According to the WHO 2018 statistics, cancer was diagnosed in 18.1 million people and caused death in 9.6 million globally
- Based on therapy, oncology accounted for approx 40% of the overall market share in 2021
- Growing awareness among consumers among emerging nations propels the global prescription drugs market value
Global Prescription Drugs Market Dynamics
Market Drivers
- Increasing prevalence of chronic disorders
- Rising elderly population based in the world
- Growing number of infectious diseases
- Development of generic and orphan drugs
Market Restraints
- High cost associated with some prescribed drugs
- Lack of healthcare infrastructure in developing nations
Market Opportunities
- Growing demand for specialty drugs
- Increasing spending on R&D activities by private and public organizations
Prescription Drugs Market Report Coverage
| Market | Prescription Drugs Market |
| Prescription Drugs Market Size 2021 | USD 883 Billion |
| Prescription Drugs Market Forecast 2030 | USD 1,890 Billion |
| Prescription Drugs Market CAGR During 2022 - 2030 | 9% |
| Prescription Drugs Market Analysis Period | 2018 - 2030 |
| Prescription Drugs Market Base Year | 2021 |
| Prescription Drugs Market Forecast Data | 2022 - 2030 |
| Segments Covered | By Product Type, By Therapy, By Distribution Channel, And By Geography |
| Regional Scope | North America, Europe, Asia Pacific, Latin America, and Middle East & Africa |
| Key Companies Profiled | Novartis AG, Pfizer Inc., F.Hoffmann-La Roche Ltd, Sanofi, Johnson & Johnson Services, Inc., Merck & Co., Inc., Abbvie, Inc., AstraZeneca, and others. |
| Report Coverage |
Market Trends, Drivers, Restraints, Competitive Analysis, Player Profiling, Regulation Analysis |
Prescription Drugs Market Dynamics
Stringent Regulation Act Positively On the Global Prescription Drugs Market Growth
As per the reports revealed by the FOOD AND DRUG LAW INSTITUTE, in the US, the Federal Food, Drug, and Cosmetic Act (FDCA) and Title 21 of the Code of Federal Regulations Part 202 (21 CFR Part 202) primarily govern prescription drug advertising and promotion. Together, the FDCA and 21 CFR Part 202 regulate how pharmaceutical companies can promote the prescription drug to both healthcare professionals and consumers. One of the fundamental requirements of prescription drug promotion in the US is the requirement that companies promote only uses that are "on the label" or consistent with the Food and Drug Administration (FDA) approved pharmaceutical ingredient (PI). The term "off label" generally refers to the promotion of a Product Type for uses that are inconsistent with the FDA-approved labeling or PI. This can relate to the promotion of uses, dosing/administration, or patient population that are not FDA approved. Apart from that, in Chile, prescription drug advertising and promotion are monitored and regulated by the Agencia Nacional de Medicamentos (ANAMED), also known as the National Drug Agency. ANAMED is a part of the Institute of Public Health (ISP) and is responsible for the control of pharmaceuticals, cosmetics, and medical devices, guaranteeing their quality, safety, and effectiveness.
Generic Drug: An Alternative to Prescription Drug Propel the Growth of Global Prescription Drug Industry
Generic drugs have offered great relief from rising prescription drug costs. As per the statistics released by the Association for Accessible Medicines, in 2016, nearly 3.9 billion generic prescriptions were dispensed. Generics account for 89% of the prescription dispensed but only 26% of total drug costs specifically in the US. Additionally, 20.5% of brand name prescriptions are abandoned compared to 7.7% of generics. The general acceptance of generic substitution has increased the efficiency of the prescription drug market. The utility of generic drugs results in a higher level of adherence and has decreased healthcare costs while improving outcomes. Generic drug use has increased while the share of the pharmaceutical spending attributed to generics has gone down. Nearly, 3.9 billion prescriptions dispensed in the US are for generics. The rate of generic prescribing for all prescriptions had reached almost 75% in 2009 which was up from 57% in 2004. From 2010 to 2014, a number of blockbuster drugs went off patent representing more than US$ 209 Bn in annual drug sales revealed by the OFFICE OF THE ASSISTANT SECRETARY FOR PLANNING AND EVALUATION (ASPE).
Prescription Drugs Market Segmentation
The worldwide prescription drugs market is split based on product type, therapy, distribution channel, and geography.
Prescription Drugs Market By Product Type
- Generics
- Orphan
- Other Prescription Drugs

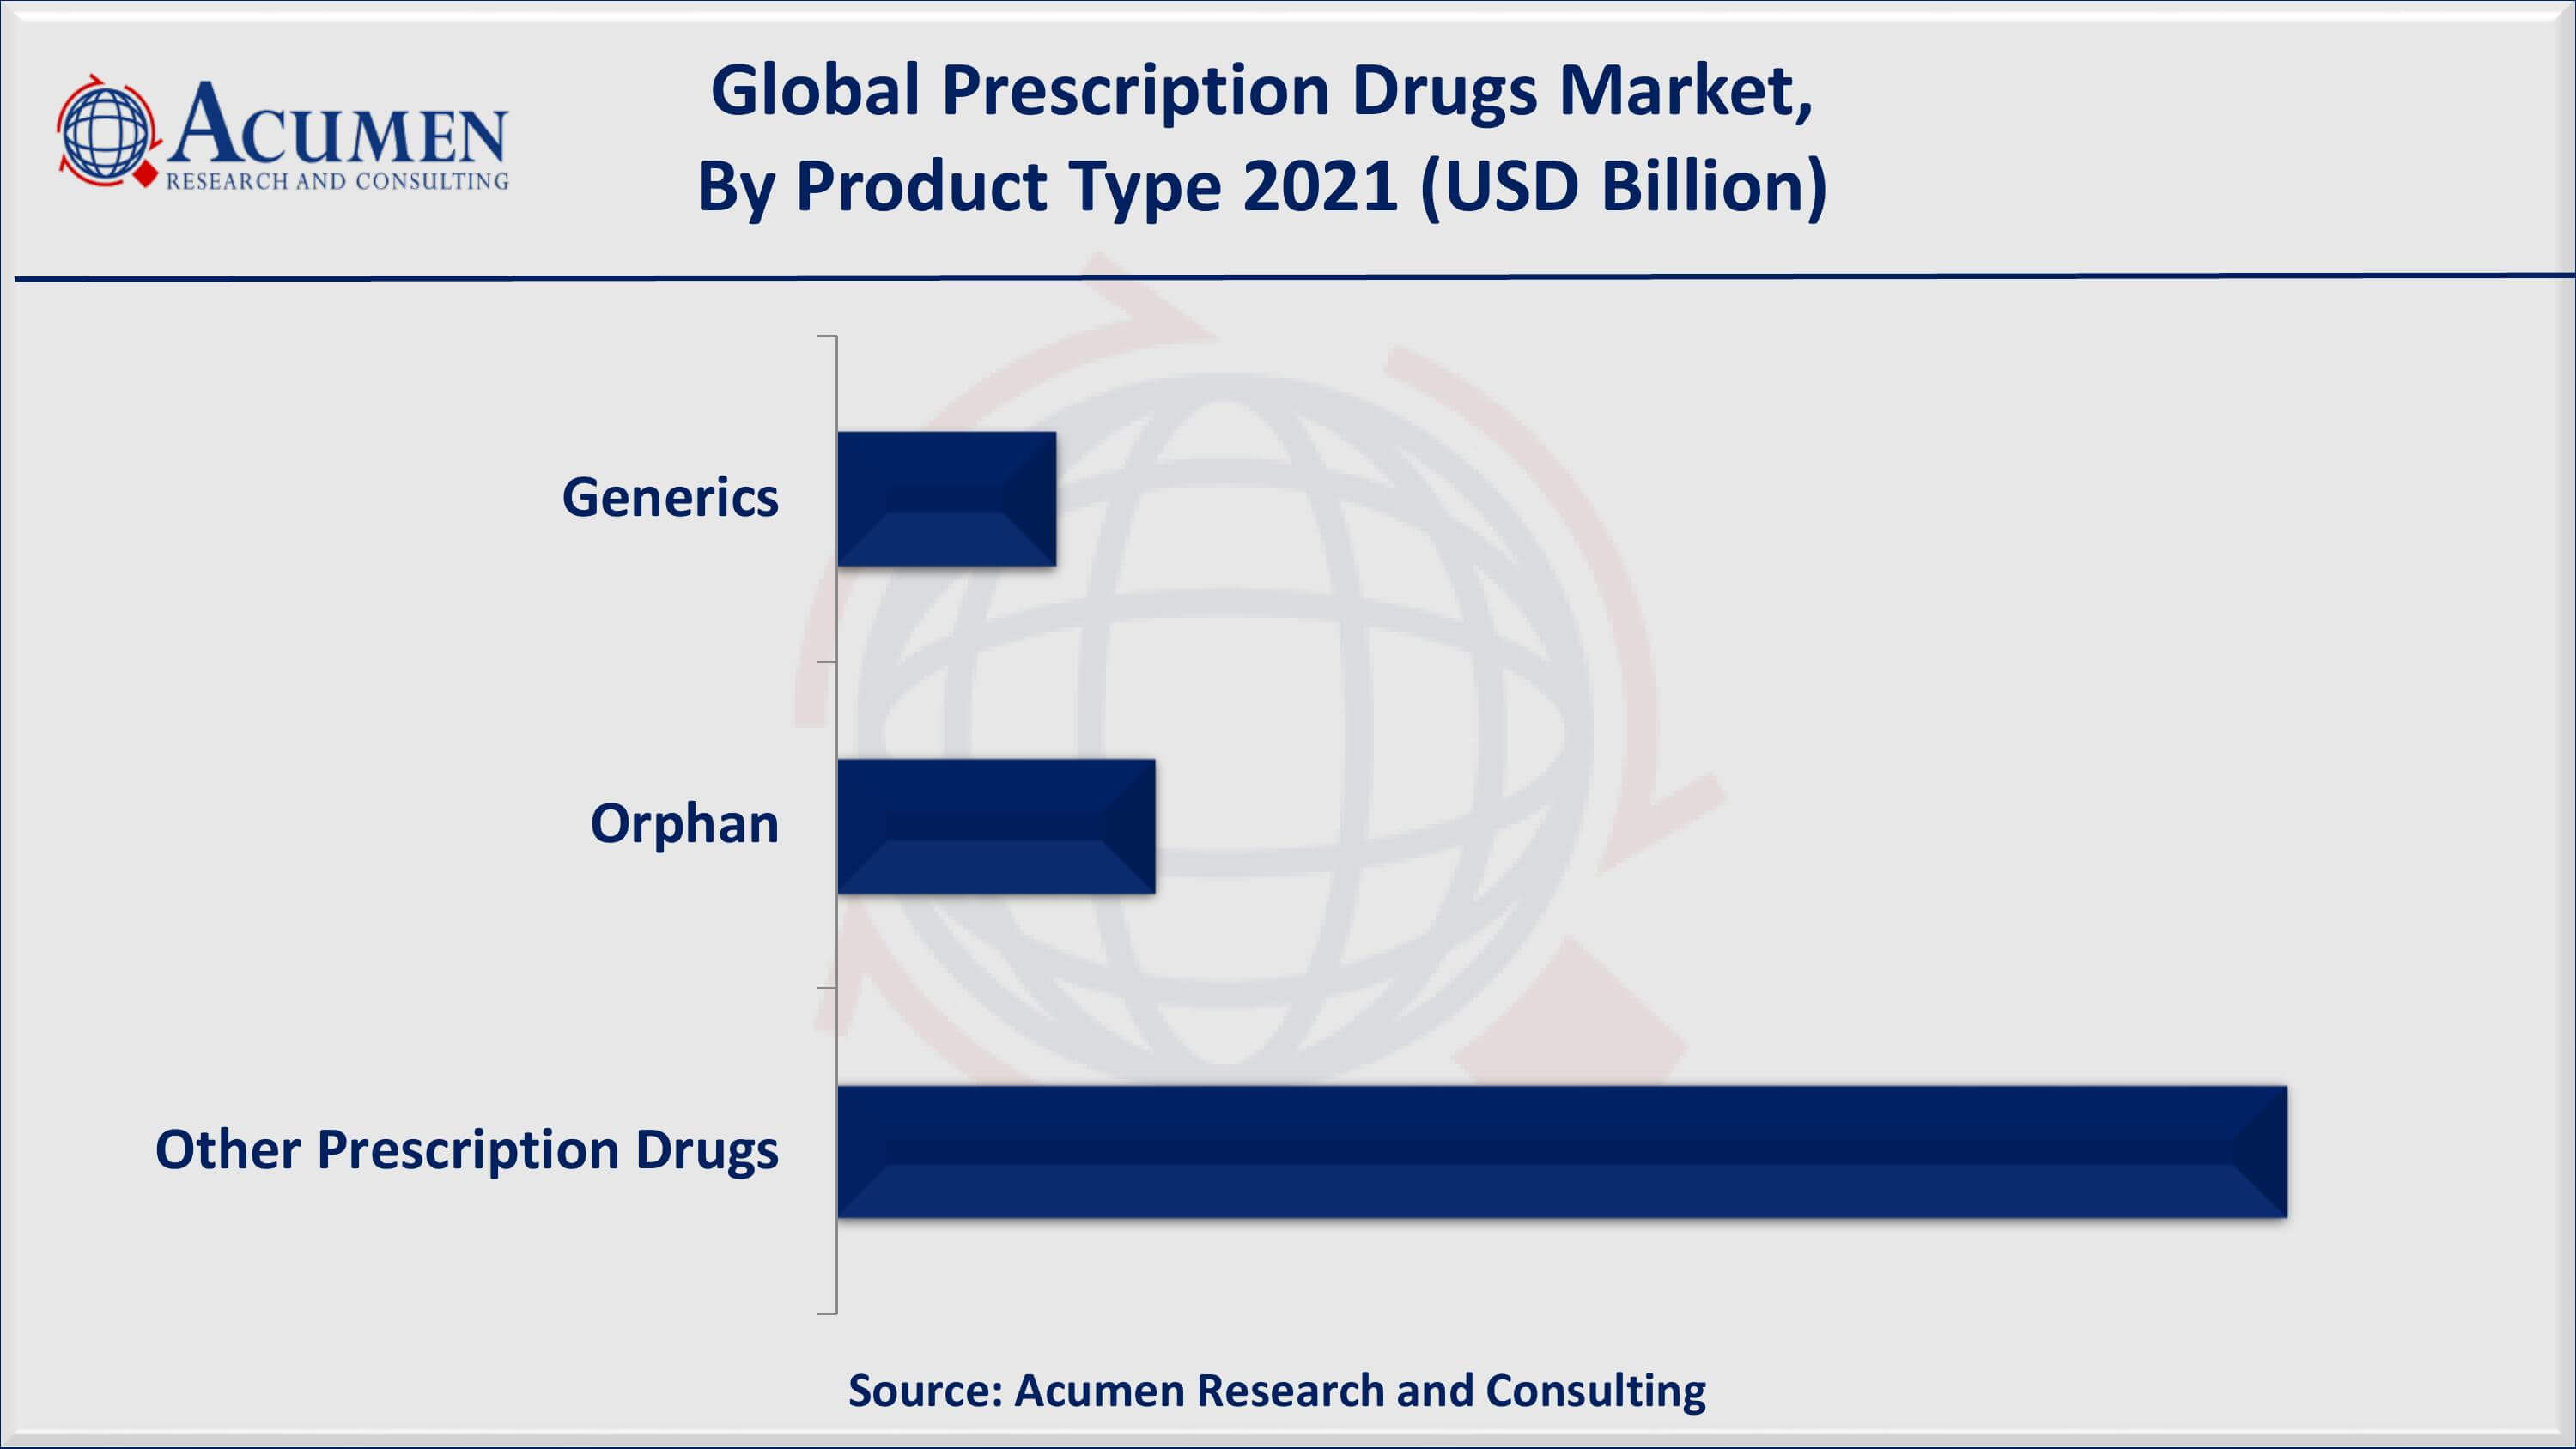
According to our prescription drugs industry analysis, the significant difference between generic and branded prescription drugs is the cost of the product. Generics don’t incur that tremendous expense and are able to pass savings on to the patient. Also, the affordability of generics is a key factor for increased patient compliance. The Federal Government is the nation's largest purchaser of generic drugs. In fact, without generics Medicaid and Medicare spending on prescription medicine would nearly double. According to the reports revealed by the Association for Accessible Medicines, Medicare savings from generics totaled US$ 77 Bn in 2016 with a saving of US$ 1,883 per enrollee. Medicaid program savings from generics reached $37.9 billion, which translates to savings of $512 per enrollee.
Prescription Drugs Market By Therapy
- Oncology
- Anti-diabetics
- Vaccines
- Sensory organs
- Immunosuppressant’s
- Anticoagulants
- Others
By therapy, oncology therapeutics dominates for the prescription drug market globally. The reports revealed by the US National Library of Medicine and National Institutes of Health reveals that 96% of the patients reported taking prescription medicines within three days prior to chemotherapy. Moreover, rising prevalence of cancer is one of the dominating factors responsible for the growth of global prescription drugs market.
Prescription Drugs Market By Distribution Channel
- Hospital Pharmacies
- Retail Pharmacies & Drug Stores
- Online Pharmacies

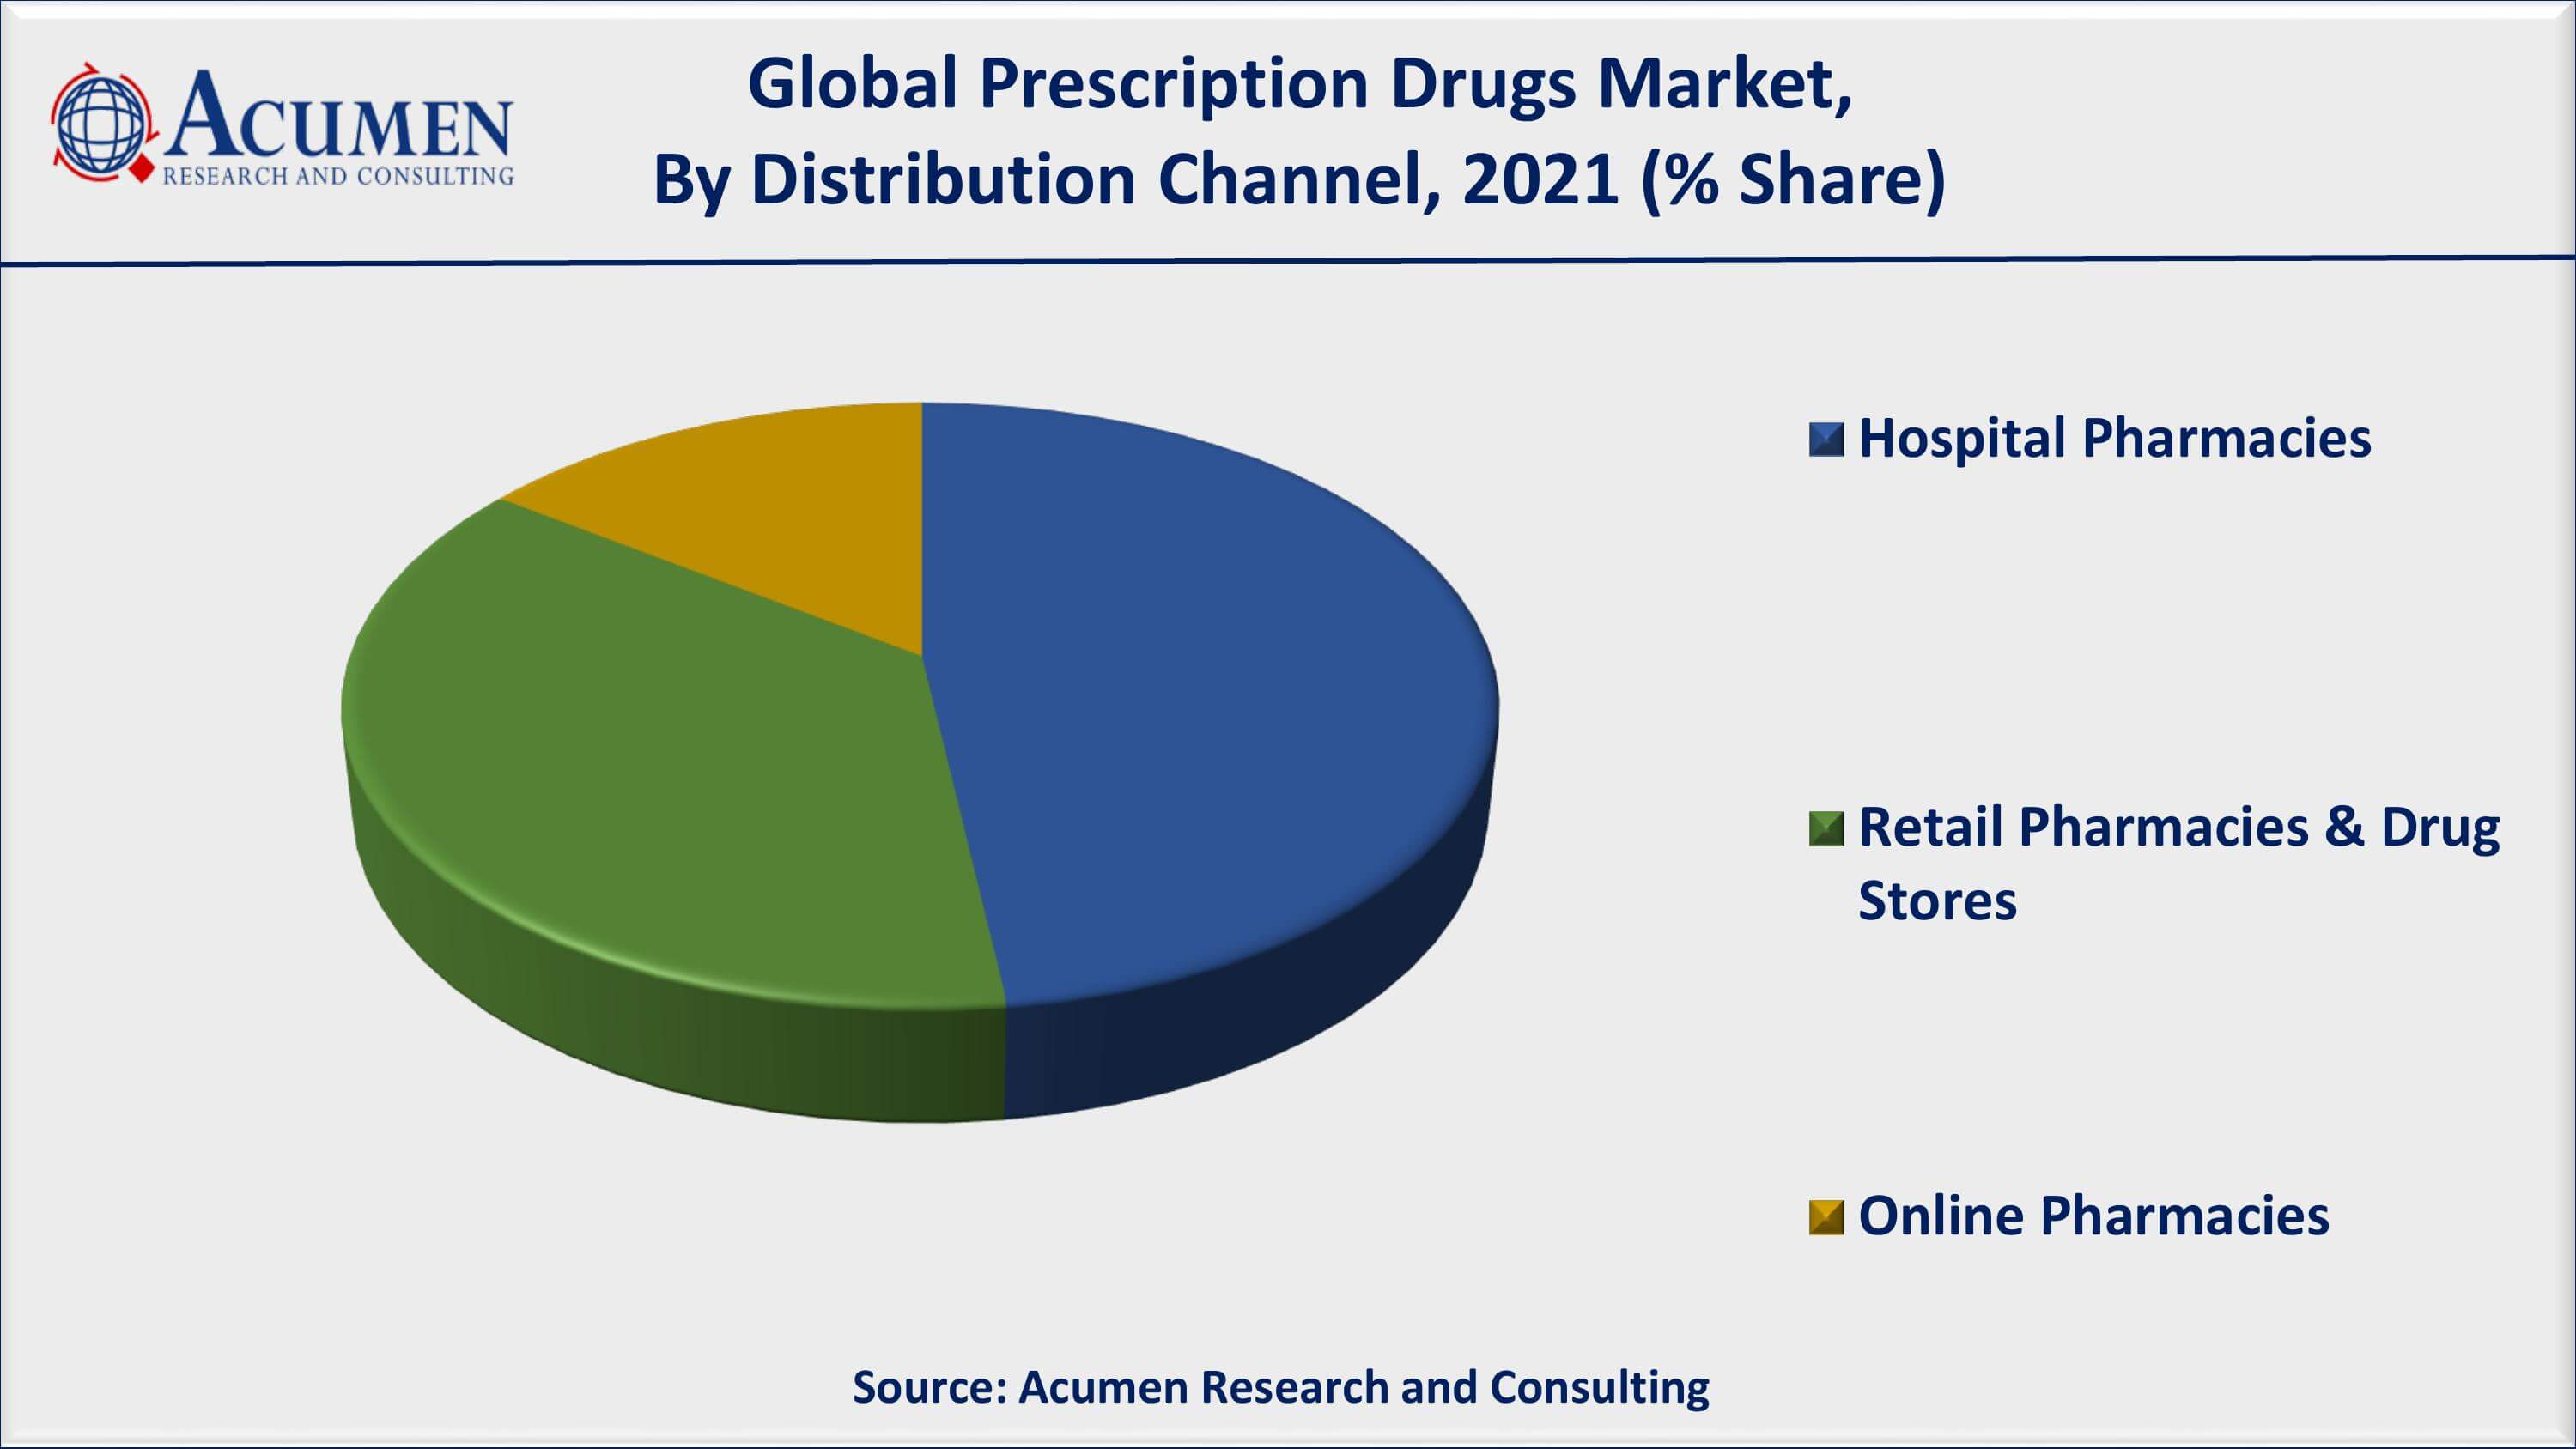
As per our prescription drugs market forecast, the hospital pharmacies accumulated a significant market share in 2021. The high growth in this segment is credited to the stringent policies to sell drugs prescribed from healthcare providers. In addition, hospital pharmacies consists all sorts of drugs that are required to cure every disease. On the other hand, online pharmacies are anticipated to attain significant growth rate from 2022 to 2030. Rising trend of online ordering and increasing e-commerce websites are the leading factors that are boosting the prescription drugs market value.
Prescription Drugs Market Regional Outlook
North America
- U.S.
- Canada
Europe
- U.K.
- Germany
- France
- Spain
- Rest of Europe
Latin America
- Mexico
- Brazil
- Rest of Latin America
Asia-Pacific
- India
- Japan
- China
- Australia
- South Korea
- Rest of Asia-Pacific
The Middle East & Africa (MEA)
- Gulf Cooperation Council (GCC)
- South Africa
- Rest of the Middle East & Africa
High Prevalence of Chronic Disorders and Adoption of Strict Regulatory Policies Fuels Prescription Medicine Market in North America
North America is projected to hold dominating market share of the prescription drugs market. Stringent regulations on the promotion and advertising of prescription drugs are one of the prominent factors that contribute to the growth of the global prescription drug market. In the US, the Office of Prescription Drug Promotion (OPDP), reviews promotional materials submitted at the time of initial dissemination on Form FDA 2253, as well as through routine surveillance and the Bad Ad Program. In 2016, OPDP issued a total of 11 letters, eight untitled letters, and three warning letters. Of the 11 letters, four related to investigational new drugs that had not yet been approved by FDA. The volatile promotional materials at issue in four of these letters were detected via Form FDA 2253, while seven were captured through routine monitoring and surveillance. Another requirement of prescription drug promotion is that promotional materials must not be false or misleading. There are several ways that promotional materials can be deemed false or misleading. To avoid this all prescription drug promotional materials that include efficacy/benefit claims must provide a fair balance between benefit information and information on risk associated with the product.
On the other hand, Asia-Pacific is projected to register a reasonably high CAGR throughout the forecast period. The presence of prominent players and rising awareness of chronic disorders are the factors that contribute to the growth of the global prescription drug market. Europe holds the second largest share of the prescription drug market. New product launches of the efficient prescription product coupled with orphan drugs and rising demand for the advanced prescription product are the factors that contribute to the global growth of the prescription drugs market.
Prescription Drugs Market Players
The global prescription drugs companies profiled in the report include Novartis AG, Pfizer Inc., F.Hoffmann-La Roche Ltd, Sanofi, Johnson & Johnson Services, Inc., Merck & Co., Inc., Abbvie, Inc., AstraZeneca, and others.
Frequently Asked Questions
What is the size of global prescription drugs market in 2021?
The market size of prescription drugs market in 2021 was accounted to be USD 883 Billion.
What is the CAGR of global prescription drugs market during forecast period of 2022 to 2030?
The projected CAGR of prescription drugs market during the analysis period of 2022 to 2030 is 9%.
Which are the key players operating in the market?
The prominent players of the global prescription drugs market are Novartis AG, Pfizer Inc., F.Hoffmann-La Roche Ltd, Sanofi, Johnson & Johnson Services, Inc., Merck & Co., Inc., Abbvie, Inc., AstraZeneca, and others.
Which region held the dominating position in the global prescription drugs market?
North America held the dominating prescription drugs during the analysis period of 2022 to 2030.
Which region registered the fastest growing CAGR for the forecast period of 2022 to 2030?
Asia-Pacific region exhibited fastest growing CAGR for prescription drugs during the analysis period of 2022 to 2030.
What are the current trends and dynamics in the global prescription drugs market?
Increasing prevalence of chronic disorders, rising elderly population based in the world, and growing number of infectious diseases drives the growth of global prescription drugs market.
Which product type held the maximum share in 2021?
Based on product type, other prescription drugs segment is expected to hold the maximum share prescription drugs market.


