Power Amplifier Market Size - Global Industry, Share, Analysis, Trends and Forecast 2023 - 2032
Published :
Report ID:
Pages :
Format :
Power Amplifier Market Size - Global Industry, Share, Analysis, Trends and Forecast 2023 - 2032
Report Coverage
- Industry Dynamics
- Market Size and Forecast Data
- Segment Analysis
- Competitive Landscape
- Regional Analysis with a Niche Focus on Country-Level Data
- High Level Analysis - Porter's, PESTEL, Value Chain, etc.
- Company Profiles of Key Players
- Option to Customize the Report As Per Your Specific Need
Request Sample Report
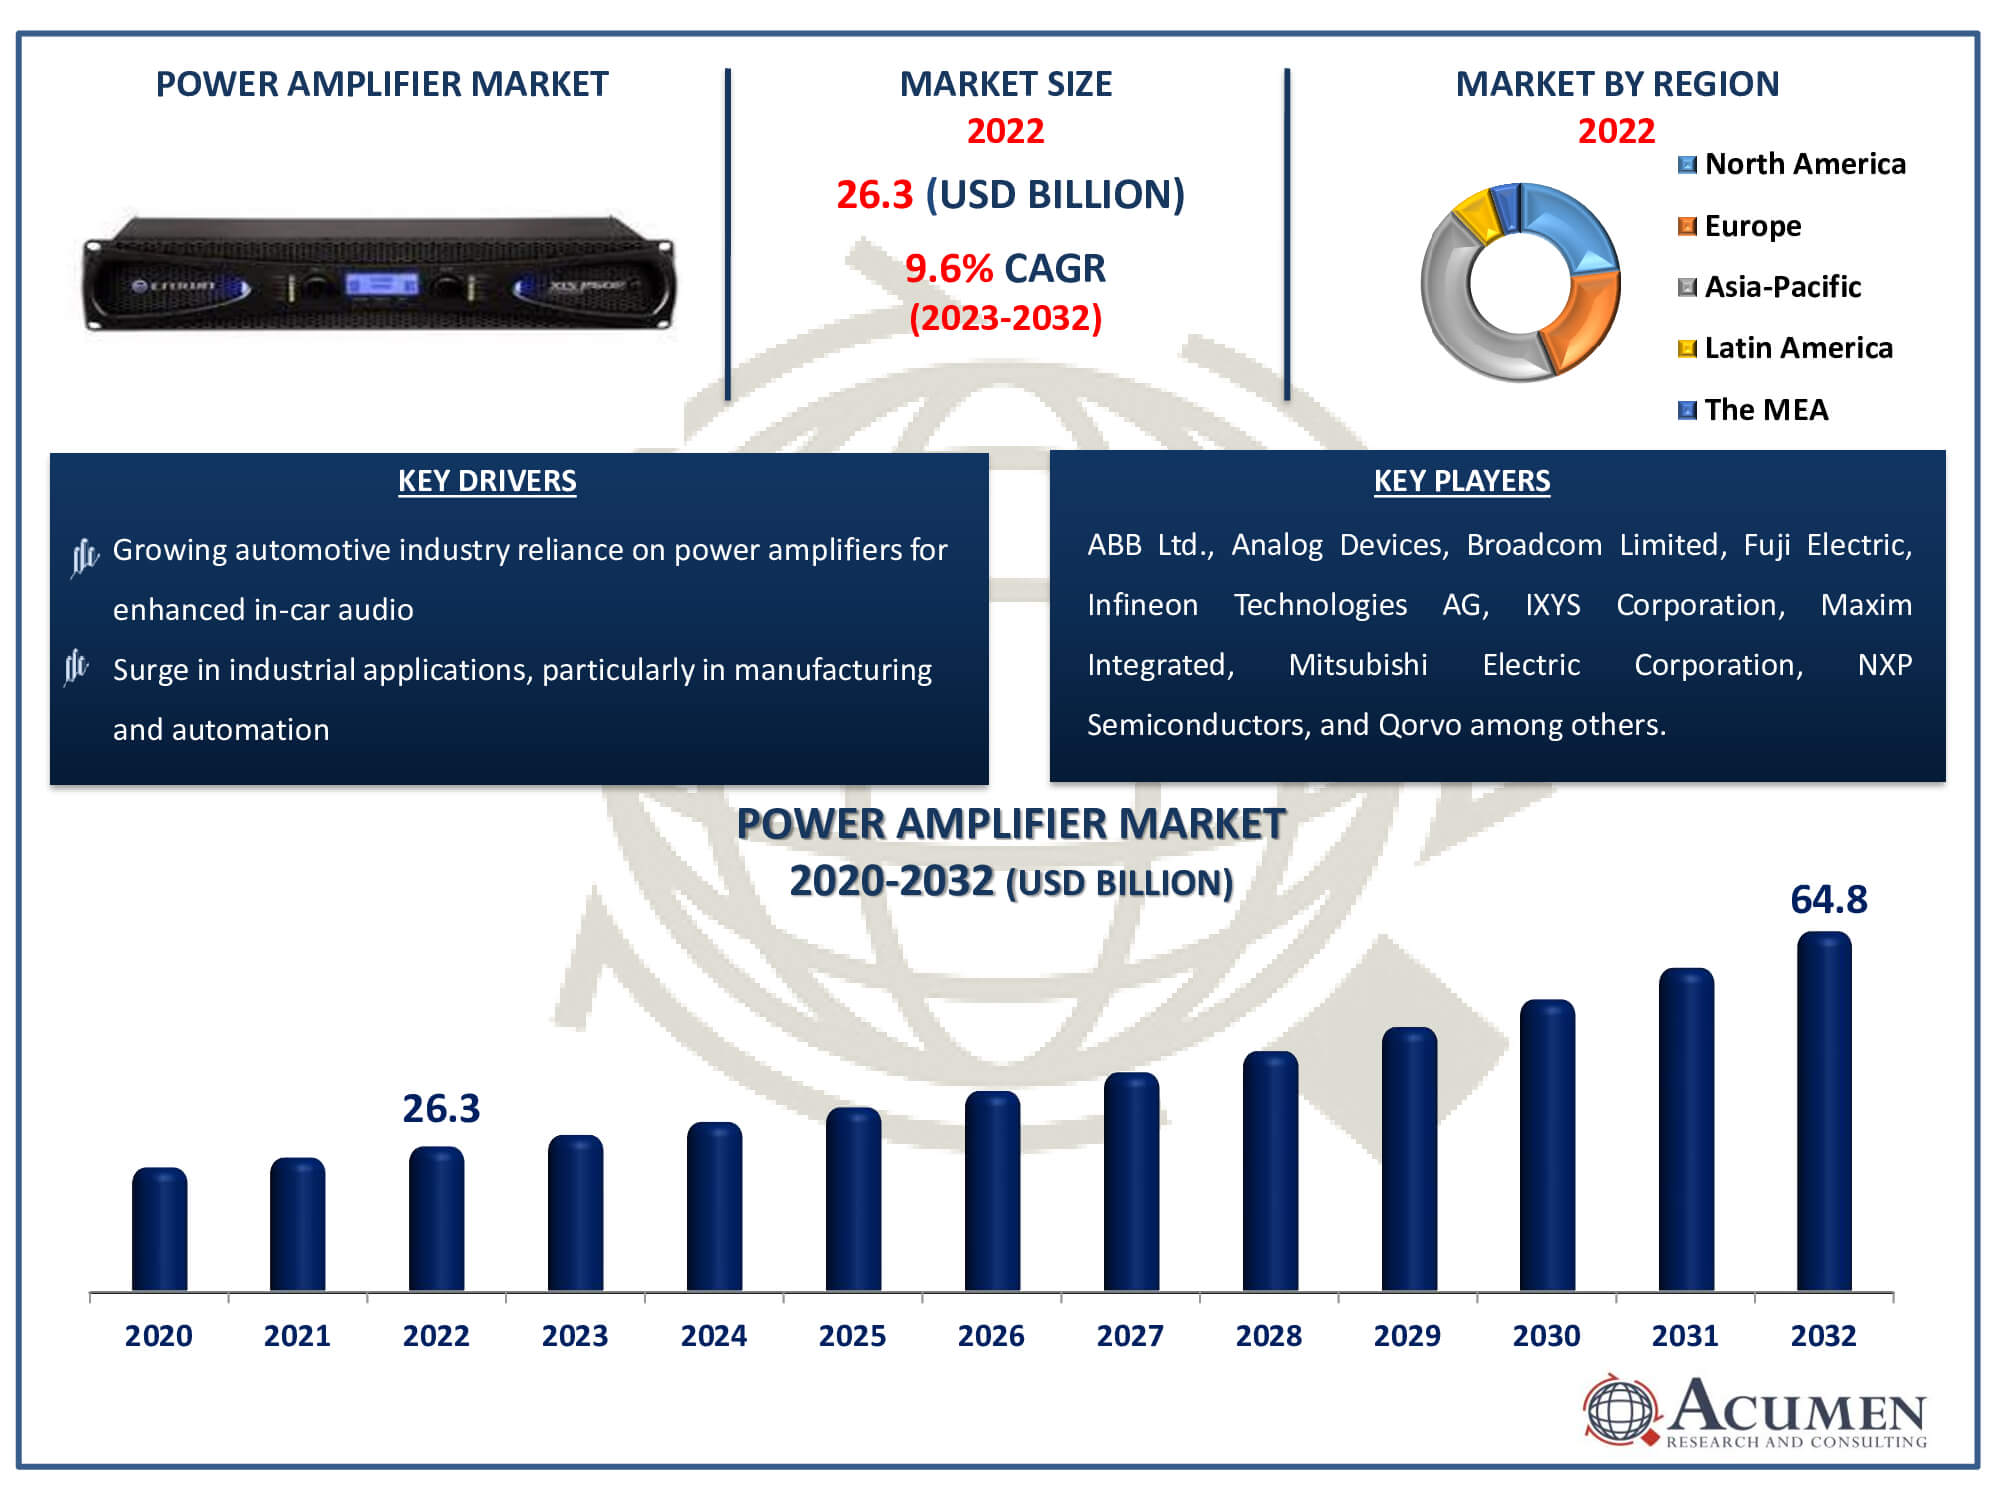
The Power Amplifier Market Size accounted for USD 26.3 Billion in 2022 and is estimated to achieve a market size of USD 64.8 Billion by 2032 growing at a CAGR of 9.6% from 2023 to 2032.
Power Amplifier Market Highlights
- Global power amplifier market revenue is poised to garner USD 64.8 billion by 2032 with a CAGR of 9.6% from 2023 to 2032
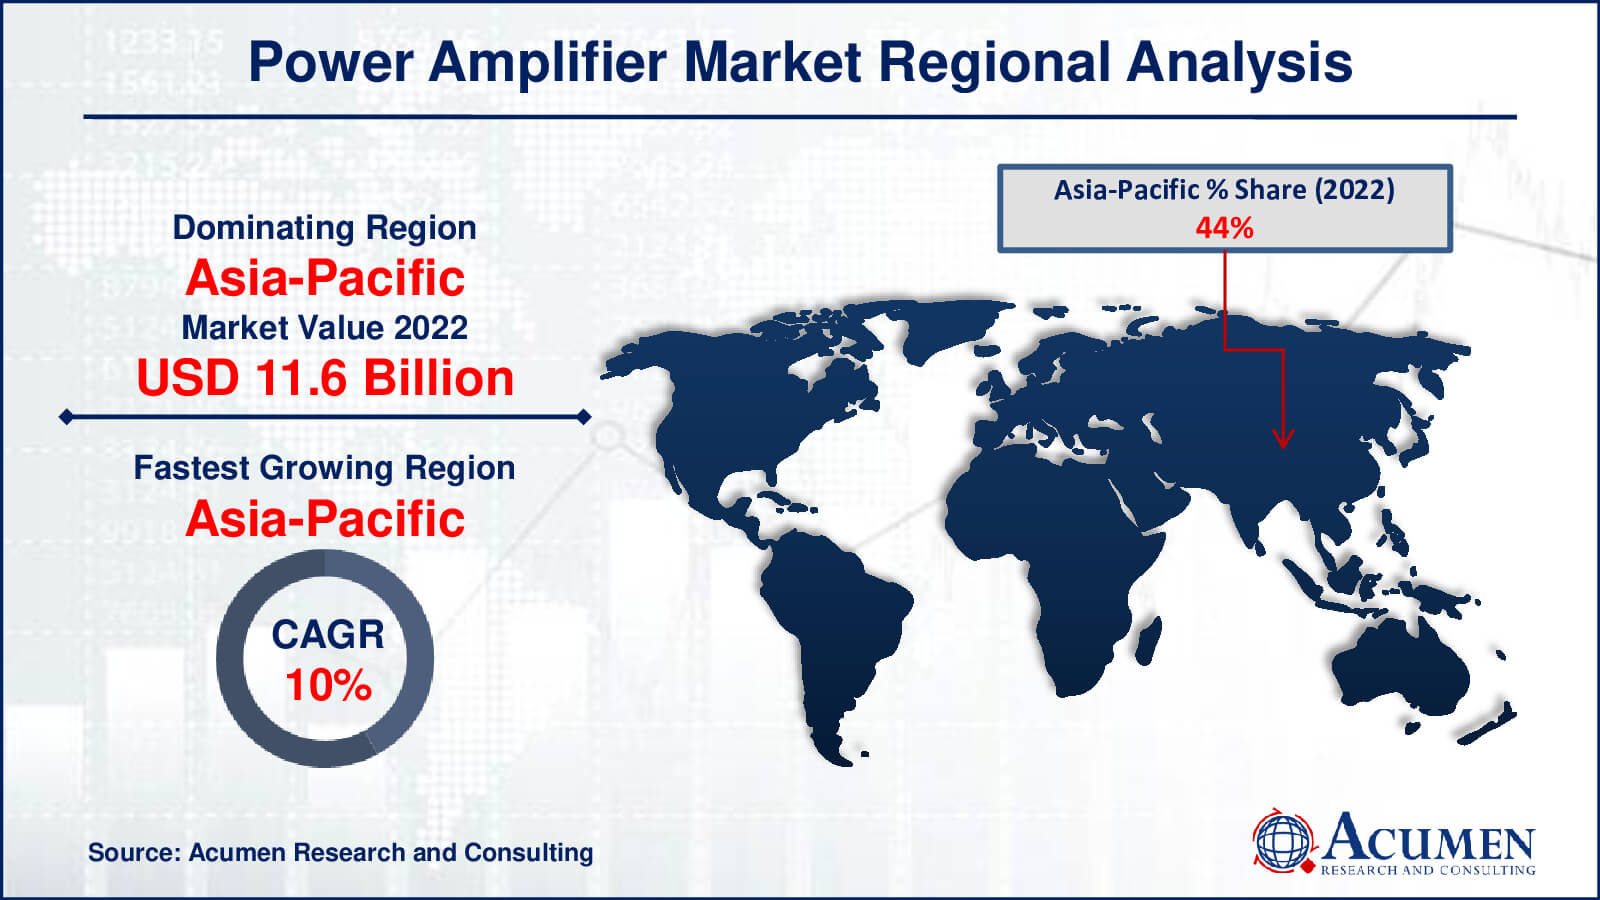
- Asia-Pacific power amplifier market value occupied around USD 11.6 billion in 2022
- Asia-Pacific power amplifier market growth will record a CAGR of more than 10% from 2023 to 2032
- Among product, the audio power amplifier sub-segment generated noteworthy revenue in 2022
- Based on class, the class A and class B sub-segment generated around significant share in 2022
- Increased demand for wireless audio devices is a popular power amplifier market trend that fuels the industry demand

A power amplifier refers to an electric amplifier designed to increase the magnitude of the power of a given input signal. In its operation, the power of the input signal is elevated to a level high enough to drive the loads of output devices such as speakers, headphones, RF transmitters, and others. The power amplifier is specifically designed to drive loads directly and is commonly used as the final block in an amplifier chain. With more people needing amplified signals to power a variety of output devices like speakers, headphones, and RF transmitters, the market for power amplifiers is expanding significantly. This market segment includes electric amplifiers that are intended to increase the input signal's power and serve as the last link in amplifier chains. The power amplifier market is characterized by continuous innovation, the adoption of cutting-edge technologies, and a global presence across regions like North America, Europe, Asia-Pacific, Latin America, and the Middle East & Africa. Applications span diverse industries, including telecommunications, audio systems, and broadcasting. This introduction lays the groundwork for an in-depth examination of the dynamics, patterns, and major players influencing the power amplifier industry.
Global Power Amplifier Market Dynamics
Market Drivers
- Increasing demand for high-quality audio in consumer electronics
- Advancements in telecommunication technologies, such as 5G
- Growing automotive industry reliance on power amplifiers for enhanced in-car audio
- Surge in industrial applications, particularly in manufacturing and automation
Market Restraints
- Performance issues like current leakage and breakdown
- Cost constraints and price sensitivity in certain consumer segments
- Environmental concerns regarding power amplifier manufacturing
Market Opportunities
- Rising adoption of IoT devices
- Development of energy-efficient amplifiers
- Emerging markets in Asia-Pacific for power amplifier manufacturers
Power Amplifier Market Report Coverage
| Market | Power Amplifier Market |
| Power Amplifier Market Size 2022 | USD 26.3 Billion |
| Power Amplifier Market Forecast 2032 | USD 64.8 Billion |
| Power Amplifier Market CAGR During 2023 - 2032 | 9.6% |
| Power Amplifier Market Analysis Period | 2020 - 2032 |
| Power Amplifier Market Base Year |
2022 |
| Power Amplifier Market Forecast Data | 2023 - 2032 |
| Segments Covered | By Product, By Class, By Technology, By Application, And By Geography |
| Regional Scope | North America, Europe, Asia Pacific, Latin America, and Middle East & Africa |
| Key Companies Profiled | ABB Ltd., Analog Devices, Broadcom Limited, Fuji Electric Co. Ltd., Infineon Technologies AG, IXYS Corporation, Maxim Integrated, Mitsubishi Electric Corporation, NXP Semiconductors, Qorvo, STMicroelectronics, Texas Instruments, Toshiba Corporation, and Yamaha. |
| Report Coverage |
Market Trends, Drivers, Restraints, Competitive Analysis, Player Profiling, Covid-19 Analysis, Regulation Analysis |
Power Amplifier Market Insights
The growing global popularity of power amplifiers in consumer electronics, driven by their high efficiency and improved durability, is bolstering market value. The increased adoption of LTE technology and the growing demand for quality audio are contributing to the escalating need for power amplifiers. Technological advancements in power amplifier applications, coupled with rising investments in research and development for the creation of more advanced and efficient solutions in response to today's changing lifestyles, are propelling market growth. Furthermore, manufacturers increasing strategic movements to expand their profit margins are projected to create potential opportunities over the power amplifier industry forecast period timeframe from 2023 to 2032.
However, there could be obstacles that could hinder the power amplifier market's anticipated expansion between 2023 and 2032. Performance problems are a major concern, especially with regard to current leakage and breakdown. Unwanted flow within circuits known as current leakage creates worries about safety risks and operational inefficiency. Concurrently, there is a danger of functionality loss and higher maintenance expenses due to the possibility of breakdown caused by things like manufacture faults or voltage restrictions. If these problems are not resolved, the industry could grow more slowly, necessitating concentrated R&D efforts to guarantee the dependability and durability of power amplifiers.
Power Amplifier Market Segmentation
The worldwide market for power amplifier is split based on product, class, technology, application, and geography.
Power Amplifier Products
- Audio Power Amplifier
- RF Power Amplifier
- Traveling-Wave Tube Amplifier (TWTA)
- Solid State Power Amplifier (SSPA)
According to power amplifier industry analysis, the audio power amplifier section is the largest category in the market. The broad need for high-quality audio amplification in a variety of applications, such as consumer electronics, professional audio systems, and automobile sound systems, is responsible for this dominance. The demand for better audio experiences among customers has led to significant growth in the Audio Power Amplifier market. Its widespread use in audio equipment including speakers, headphones, and home theatre systems reinforces its dominant position and serves as a major catalyst for the growth of the power amplifier market. The need for high-quality audio in a variety of industries highlights the importance of the Audio Power Amplifier market.
Power Amplifier Classes
- Class A
- Class B
- Class AB
- Class C
- Class D
- Others
In the market for power amplifiers, the class C section is the biggest. excellent power output applications, such radio frequency (RF) amplification, frequently use class C amplifiers due to their excellent efficiency. Effective power conversion is achieved by these amplifiers by only allowing a small portion of the input signal to be amplified. This helps explain the dominance of the class C section in RF transmitters, especially in the broadcasting and telecommunications industries. Class C amplifiers remain a major force behind the power amplifier market due to the varying industries' demands for strong RF performance.
Power Amplifier Technologies
- Silicon
- Silicon Germanium
- Gallium Arsenide
- Others
With the largest market share in the power amplifier industry, the silicon technology segment displays its supremacy. Because of silicon power amplifiers' affordability, adaptability, and level of experience in semiconductor production, they are extensively used. They are widely used in automotive, telecommunication, and consumer electronics applications. Silicon technology is the favoured option for many industries due to its ability to mix affordability and performance. This balance has led to its widespread acceptance. Silicon technology remains steadfast in the face of growing demand for power amplifiers, highlighting its critical role in influencing the market environment and satisfying the various needs of a wide range of applications.
Power Amplifier Applications
- Consumer Electronics
- Industrial
- Telecommunication
- Automotive
- Military & Defense
In terms of power amplifier market analysis, the consumer electronics sector stands out as the dominant force, with a significant market share. The need for power amplifiers in consumer electronics is fueled by the widespread use of cellphones, audio systems, and home entertainment devices. The rising user base and the ongoing search of better audio experiences in these devices reinforce the dominance of the user Electronics industry. The need for power amplifiers in this market sector is further increased by the growing integration of cutting-edge features and technologies in contemporary electronic gadgets, which makes it a significant driver and influencer of the dynamics of the power amplifier market as a whole.
Power Amplifier Market Regional Outlook
North America
- U.S.
- Canada
Europe
- U.K.
- Germany
- France
- Spain
- Rest of Europe
Asia-Pacific
- India
- Japan
- China
- Australia
- South Korea
- Rest of Asia-Pacific
Latin America
- Brazil
- Mexico
- Rest of Latin America
The Middle East & Africa
- South Africa
- GCC Countries
- Rest of the Middle East & Africa (ME&A)

Power Amplifier Market Regional Analysis
Asia-Pacific leads the global power amplifiers market, commanding a significant share of revenue, primarily due to the thriving consumer electronics industry in the region. The presence of large populations in developing economies such as China and India further boosts the regional market value. The rapid surge in demand and production of audio systems, smartphones, tablets, PCs, and laptops in the Asia Pacific market propels overall market growth. Furthermore, Asia Pacific is anticipated to experience the fastest growth, with a substantial compound annual growth rate (CAGR %) over the power amplifier market forecast period.
Power Amplifier Market Players
Some of the top power amplifier companies offered in our report includes ABB Ltd., Analog Devices, Broadcom Limited, Fuji Electric Co. Ltd., Infineon Technologies AG , IXYS Corporation, Maxim Integrated, Mitsubishi Electric Corporation, NXP Semiconductors, Qorvo, STMicroelectronics, Texas Instruments, Toshiba Corporation, and Yamaha.
Frequently Asked Questions
How big is the power amplifier market?
The power amplifier market size was valued at USD 26.3 billion in 2022.
What is the CAGR of the global power amplifier market from 2023 to 2032?
The CAGR of power amplifier is 9.6% during the analysis period of 2023 to 2032.
Which are the key players in the power amplifier market?
The key players operating in the global market are including ABB Ltd., Analog Devices, Broadcom Limited, Fuji Electric Co. Ltd., Infineon Technologies AG, IXYS Corporation, Maxim Integrated, Mitsubishi Electric Corporation, NXP Semiconductors, Qorvo, STMicroelectronics, Texas Instruments, Toshiba Corporation, and Yamaha.
Which region dominated the global power amplifier market share?
Asia-Pacific held the dominating position in power amplifier industry during the analysis period of 2023 to 2032.
Which region registered fastest CAGR from 2023 to 2032?
Asia-Pacific region exhibited fastest growing CAGR for market of power amplifier during the analysis period of 2023 to 2032.
What are the current trends and dynamics in the global Power Amplifier industry?
The current trends and dynamics in the power amplifier industry include increasing demand for high-quality audio in consumer electronics, advancements in telecommunication technologies, such as 5G, drive, growing automotive industry reliance on power amplifiers for enhanced in-car audio, and surge in industrial applications, particularly in manufacturing and automation.
Which class held the maximum share in 2022?
The class C held the maximum share of the power amplifier industry.


