Potassium Carbonate Market Size - Global Industry, Share, Analysis, Trends and Forecast 2024 - 2032
Published :
Report ID:
Pages :
Format :
Potassium Carbonate Market Size - Global Industry, Share, Analysis, Trends and Forecast 2024 - 2032
Report Coverage
- Industry Dynamics
- Market Size and Forecast Data
- Segment Analysis
- Competitive Landscape
- Regional Analysis with a Niche Focus on Country-Level Data
- High Level Analysis - Porter's, PESTEL, Value Chain, etc.
- Company Profiles of Key Players
- Option to Customize the Report As Per Your Specific Need
Request Sample Report
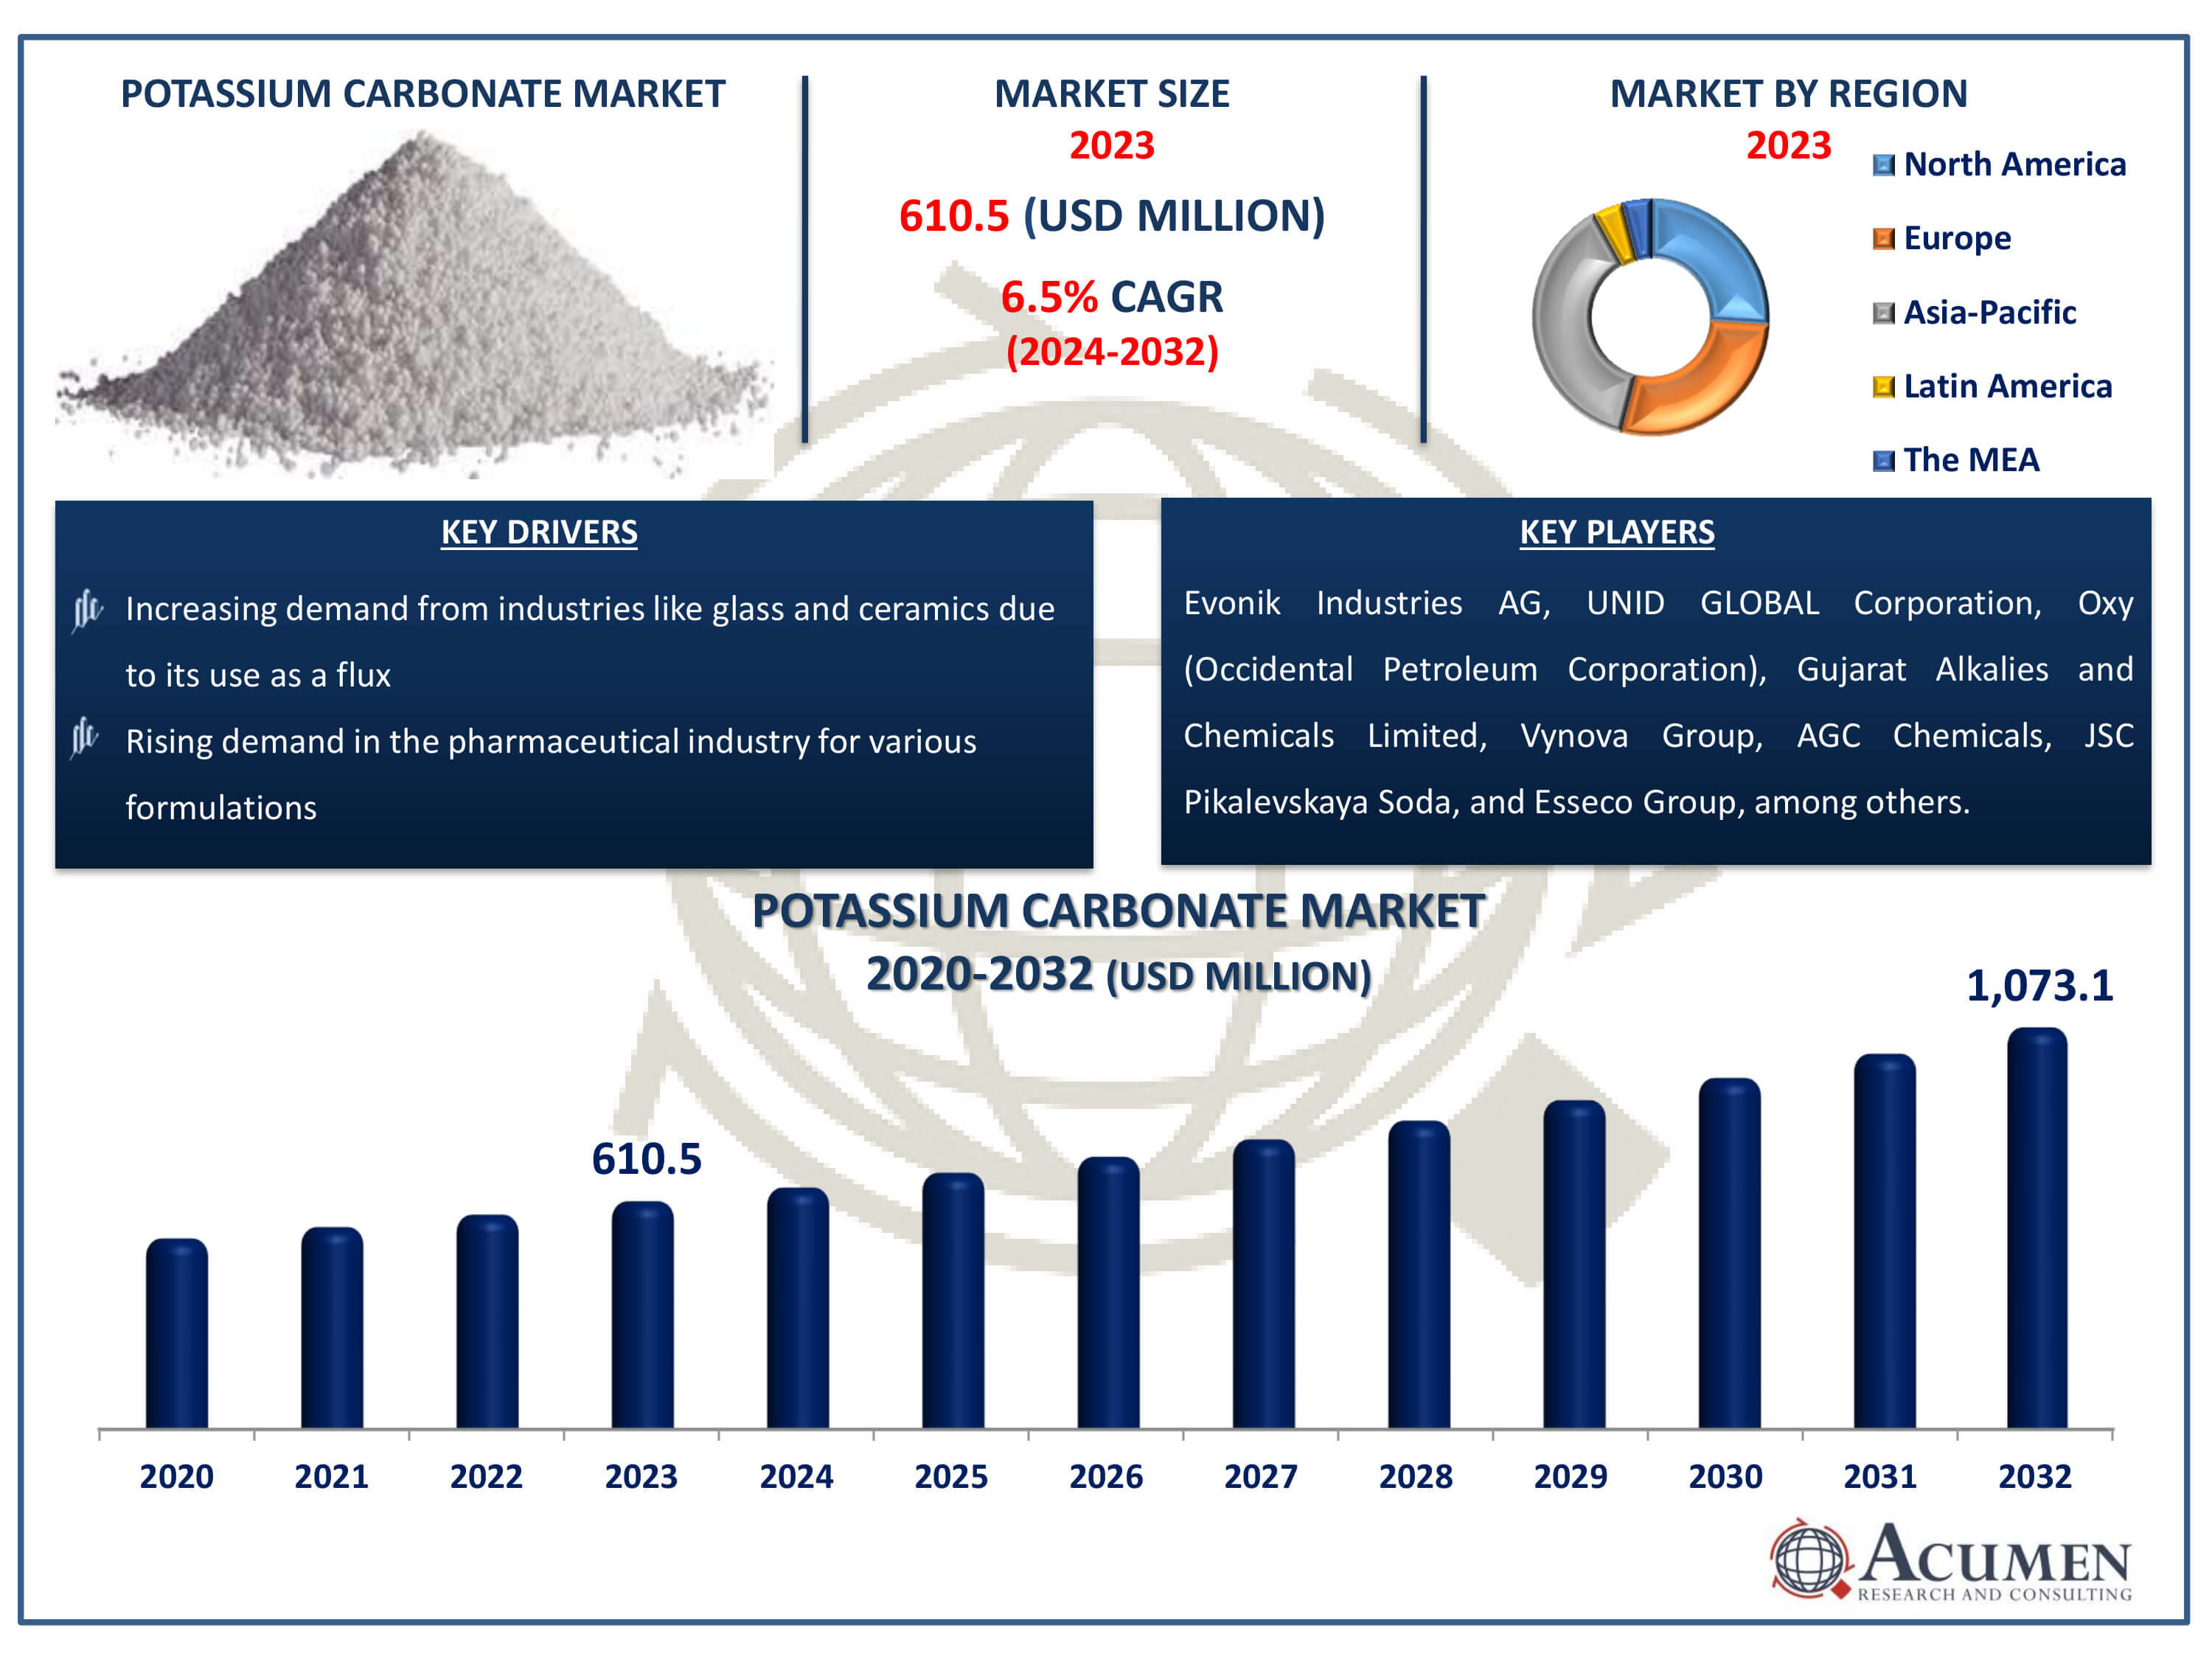
The Potassium Carbonate Market Size accounted for USD 610.5 Million in 2023 and is estimated to achieve a market size of USD 1,073.1 Million by 2032 growing at a CAGR of 6.5% from 2024 to 2032.
Potassium Carbonate Market Highlights
- Global potassium carbonate market revenue is poised to garner USD 1,073.1 million by 2032 with a CAGR of 6.5% from 2024 to 2032
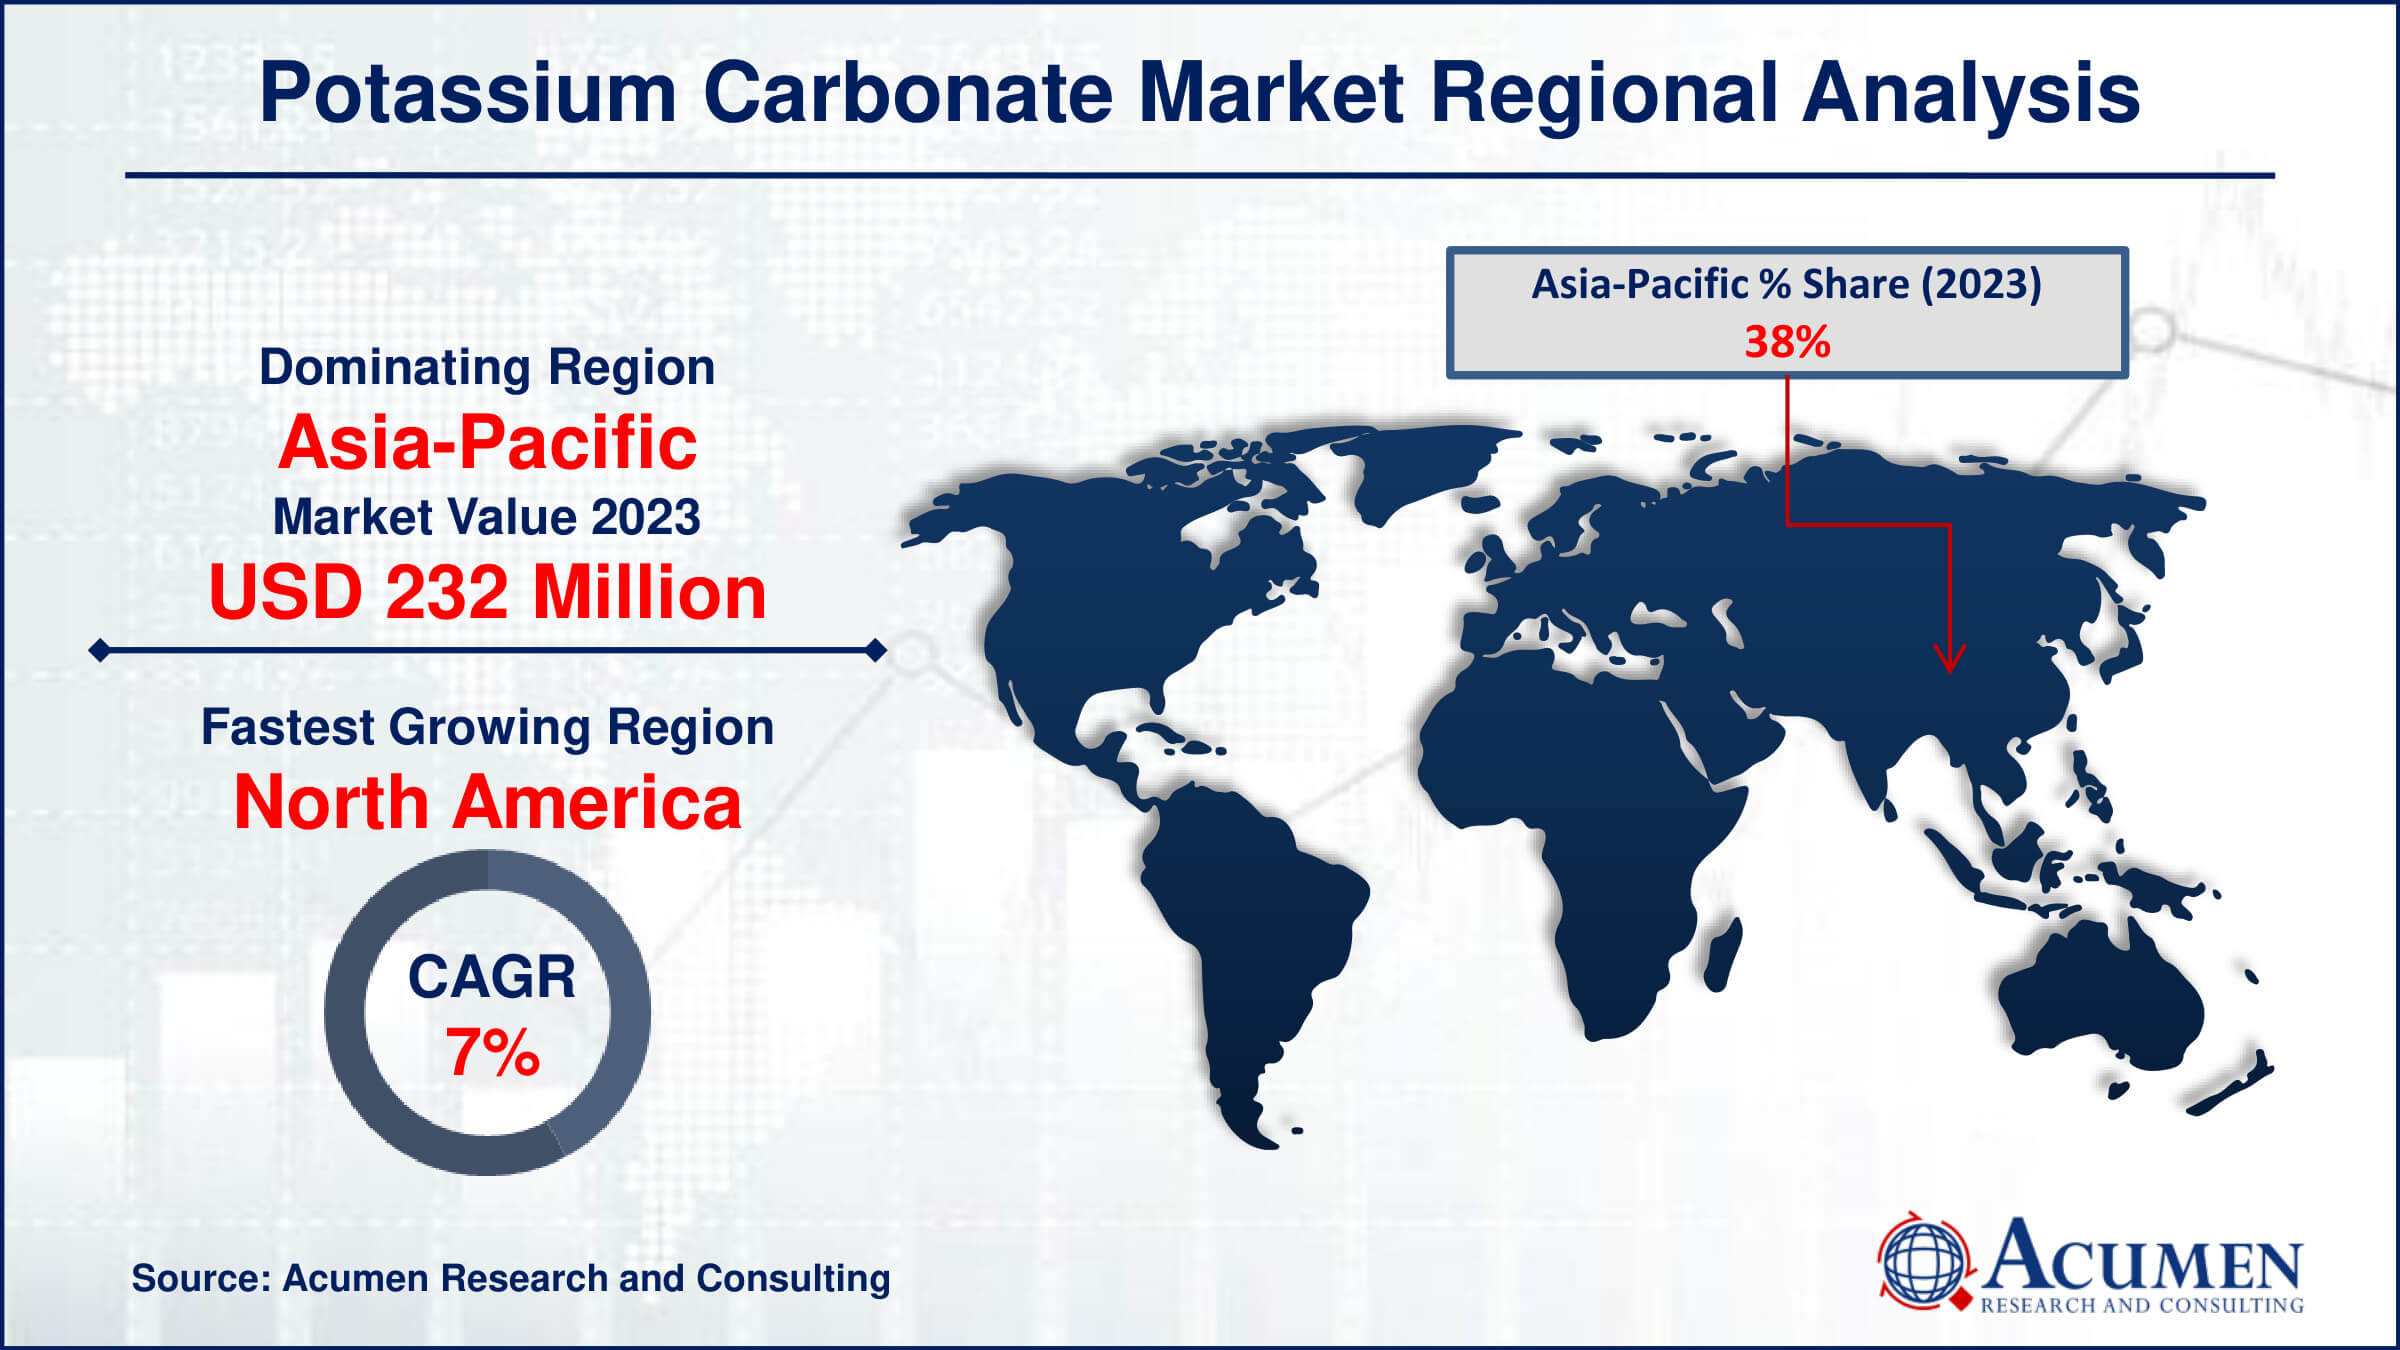
- Asia-Pacific potassium carbonate market value occupied around USD 232 million in 2023
- North America potassium carbonate market growth will record a CAGR of more than 7% from 2024 to 2032
- Among type, electrolysis method sub-segment generated noteworthy revenue in 2023
- Based on application, the glass/TVs/ceramic sub-segment generated around 20% market share in 2023
- Increasing applications in the production of specialty chemicals is a popular potassium carbonate market trend that fuels the industry demand

Potassium carbonate appears as a white powder or granules that are soluble in water. When mixed with water, it forms a strong alkaline solution. It is an aqueous solution of potassium ions and carbonate ions. Potassium carbonate is a major constituent of potash and is found in refined pearl ash or tartar. It is also known by several names including pearl ash, carbonate of potash, salt of wormwood, salt of tartar, and dipotassium carbonate. Potassium carbonate is produced through the electrolysis of potassium chloride, followed by carbonation with carbon dioxide to produce the final product, potassium carbonate.
Global Potassium Carbonate Market Dynamics
Market Drivers
- Increasing demand from industries like glass and ceramics due to its use as a flux
- Growth in agriculture for fertilizer applications
- Rising demand in the pharmaceutical industry for various formulations
- Expansion of the soap and detergent industry
Market Restraints
- Environmental regulations impacting mining and production
- Fluctuating raw material costs affecting profitability
- Challenges in handling and storing due to its caustic nature
Market Opportunities
- Innovations in battery technology driving demand for potassium carbonate
- Growth in the food and beverage industry for food additives
- Expansion of renewable energy sectors boosting demand for potassium carbonate
Potassium Carbonate Market Report Coverage
| Market | Potassium Carbonate Market |
| Potassium Carbonate Market Size 2022 | USD 610.5 Million |
| Potassium Carbonate Market Forecast 2032 | USD 1,073.1 Million |
| Potassium Carbonate Market CAGR During 2023 - 2032 | 6.5% |
| Potassium Carbonate Market Analysis Period | 2020 - 2032 |
| Potassium Carbonate Market Base Year |
2022 |
| Potassium Carbonate Market Forecast Data | 2023 - 2032 |
| Segments Covered | By Type, By Technology, By Application, And By Geography |
| Regional Scope | North America, Europe, Asia Pacific, Latin America, and Middle East & Africa |
| Key Companies Profiled | Evonik Industries AG, UNID GLOBAL Corporation, Oxy (Occidental Petroleum Corporation), Gujarat Alkalies and Chemicals Limited, Vynova Group, AGC Chemicals, JSC Pikalevskaya Soda, Esseco Group, Shanghai Wentong Chemicals Co., Ltd., Foodchem International Corporation, Shanxi Guangyuan Fertilizer Co., Ltd., and Armand Products. |
| Report Coverage |
Market Trends, Drivers, Restraints, Competitive Analysis, Player Profiling, Covid-19 Analysis, Regulation Analysis |
Potassium Carbonate Market Insights
One major driver of the potassium carbonate market is rising demand from sectors such as glass and ceramics. Potassium carbonate is an important flux in various industries, helping to reduce the melting point of materials during manufacture. This quality makes it critical for increasing the melting properties of raw materials such as silica, resulting in smoother glass and ceramic creation. As worldwide building activity grows, particularly in emerging countries, the demand for glass and ceramic products is predicted to rise, increasing the requirement for potassium carbonate. The unpredictability in raw material pricing is a significant limitation on the potassium carbonate industry. Potassium carbonate is generally generated from potassium chloride using chemical methods, and changes in potassium chloride availability and pricing can have a substantial impact on potassium carbonate manufacturing costs. Economic concerns, geopolitical issues that affect mining operations, and environmental laws can all contribute to volatile raw material pricing. These uncertainties make it difficult for market actors to successfully manage their production costs and price strategies.
An important opportunity in the potassium carbonate market is its growing use in renewable energy sectors, notably in energy storage devices such as batteries. Potassium carbonate is utilized in certain types of batteries, such as potassium-ion batteries, since it stabilizes electrode materials and improves battery performance. With increased global investment and innovation in renewable energy sources, there is a growing demand for efficient energy storage solutions. This trend represents a good opportunity for potassium carbonate manufacturers to increase their market share by catering to the needs of the renewable energy sector. To summarize, while the potassium carbonate market benefits from strong demand in industrial applications such as glass and ceramics, it also confronts obstacles such as instability in raw material prices. Opportunities in emerging areas, such as renewable energy storage systems, highlight the potential for future growth and innovation.
Potassium Carbonate Market Segmentation
The worldwide market for potassium carbonate is split based on type, technology application, and geography.
Potassium Carbonate Types
- Electrolysis Method
- Ion Exchange Method
- Ash Method
- Other Method
According to potassium carbonate industry analysis, the electrolysis method dominates production. The electrolysis of potassium chloride (KCl), a common salt, produces potassium hydroxide (KOH). Potassium hydroxide combines with carbon dioxide (CO2) to generate potassium carbonate (K2CO3). This technique is popular because it is efficient in large-scale production and produces high purity potassium carbonate appropriate for a wide range of industrial applications. Industries such as glass manufacture, which employ potassium carbonate as a flux to lower melting points and enhance product consistency, place a high demand on electrolytically produced potassium carbonate. The method's dependability, scalability, and ability to achieve rigorous quality standards let it dominate the industry.
Potassium Carbonate Products
- Food Grade
- Industrial Grade
The industrial grade category is projected to be the most significant throughout the potassium carbonate market forecast period. This supremacy stems from its widespread use in a variety of industries, including glass making, soaps and detergents, and chemical production. Potassium carbonate's characteristics, including high solubility and strong alkalinity, make it an important component in these processes. Furthermore, its application in agricultural fertilizers to manage soil pH and supply critical potassium minerals drives up demand. Rising industrial activity and the growing demand for efficient and cost-effective chemical agents contribute to a higher consumption of industrial grade potassium carbonate than food grade potassium carbonate, which is primarily utilized as a food additive and in specialty food applications.
Potassium Carbonate Applications
- Pharmaceutical
- Potassium Salts
- Glass/TVs/Ceramic
- Agrochemicals
- Dyes & Inks
- Rubber Chemicals
The glass/TVs/ceramic segment accounts for the majority of potassium carbonate applications. Potassium carbonate is widely utilized in the production of glass, particularly specialty and optical glass, because of its ability to lower melting temperatures while improving final product clarity and strength. In the ceramics industry, it works as a flux, decreasing silica's melting point and promoting the creation of smooth, durable ceramic products. The strong demand for flat panel displays, such as those used in televisions and monitors, adds to the segment's growth. The expansion of the construction and electronics sectors, particularly in emerging countries, boosts demand for glass and ceramic products, making this industry the major consumer of potassium carbonate.
Potassium Carbonate Market Regional Outlook
North America
- U.S.
- Canada
Europe
- U.K.
- Germany
- France
- Spain
- Rest of Europe
Asia-Pacific
- India
- Japan
- China
- Australia
- South Korea
- Rest of Asia-Pacific
Latin America
- Brazil
- Mexico
- Rest of Latin America
The Middle East & Africa
- South Africa
- GCC Countries
- Rest of the Middle East & Africa (ME&A)

Potassium Carbonate Market Regional Analysis
In terms of potassium carbonate market analysis, the Asia-Pacific region accounts for the majority of the industry, owing to China, India, and Japan's huge industrial base and rapid economic expansion. APAC's supremacy is partly due to increased demand from the glass manufacturing industry, which employs potassium carbonate to improve transparency and strength. Furthermore, the region's expanding agriculture industry uses potassium carbonate as a fertilizer component to boost soil health and crop yields. The rising use in the production of personal care items and pharmaceuticals contributes to APAC's large market share.
North America is the fastest-growing region and it is expected to grow in the potassium carbonate market forecast period. This rapid expansion is being driven by advances in industrial technology and rising demand for high-quality glass and ceramic products. The region's emphasis on sustainable agriculture techniques encourages the usage of potassium carbonate fertilizers. Furthermore, the rising pharmaceutical and personal care industries, which use potassium carbonate in a variety of formulations, help to drive market expansion. North America's strong emphasis on R&D, combined with the adoption of novel industrial processes, drives increasing demand for potassium carbonate, establishing it as the market's fastest-growing region.
Potassium Carbonate Market Players
Some of the top potassium carbonate companies offered in our report includes Evonik Industries AG, UNID GLOBAL Corporation, Oxy (Occidental Petroleum Corporation), Gujarat Alkalies and Chemicals Limited, Vynova Group, AGC Chemicals, JSC Pikalevskaya Soda, Esseco Group, Shanghai Wentong Chemicals Co., Ltd., Foodchem International Corporation, Shanxi Guangyuan Fertilizer Co., Ltd., and Armand Products.
Frequently Asked Questions
How big is the potassium carbonate market?
The potassium carbonate market size was valued at USD 610.5 million in 2023.
What is the CAGR of the global potassium carbonate market from 2024 to 2032?
The CAGR of potassium carbonate is 6.5% during the analysis period of 2024 to 2032.
Which are the key players in the potassium carbonate market?
The key players operating in the global market are including Evonik Industries AG, UNID GLOBAL Corporation, Oxy (Occidental Petroleum Corporation), Gujarat Alkalies and Chemicals Limited, Vynova Group, AGC Chemicals, JSC Pikalevskaya Soda, Esseco Group, Shanghai Wentong Chemicals Co., Ltd., Foodchem International Corporation, Shanxi Guangyuan Fertilizer Co., Ltd., and Armand Products.
Which region dominated the global potassium carbonate market share?
Asia-Pacific held the dominating position in potassium carbonate industry during the analysis period of 2024 to 2032.
Which region registered fastest CAGR from 2024 to 2032?
North America region exhibited fastest growing CAGR for market of potassium carbonate during the analysis period of 2024 to 2032.
What are the current trends and dynamics in the global potassium carbonate industry?
The current trends and dynamics in the potassium carbonate industry include increasing demand from industries like glass and ceramics due to its use as a flux, growth in agriculture for fertilizer applications, rising demand in the pharmaceutical industry for various formulations, and expansion of the soap and detergent industry.
Which applications held the maximum share in 2023?
The glass/TVs/ceramic application held the maximum share of the potassium carbonate industry.


