Polylactic Acid Market Size - Global Industry, Share, Analysis, Trends and Forecast 2024 - 2032
Published :
Report ID:
Pages :
Format :
Polylactic Acid Market Size - Global Industry, Share, Analysis, Trends and Forecast 2024 - 2032
Report Coverage
- Industry Dynamics
- Market Size and Forecast Data
- Segment Analysis
- Competitive Landscape
- Regional Analysis with a Niche Focus on Country-Level Data
- High Level Analysis - Porter's, PESTEL, Value Chain, etc.
- Company Profiles of Key Players
- Option to Customize the Report As Per Your Specific Need
Request Sample Report
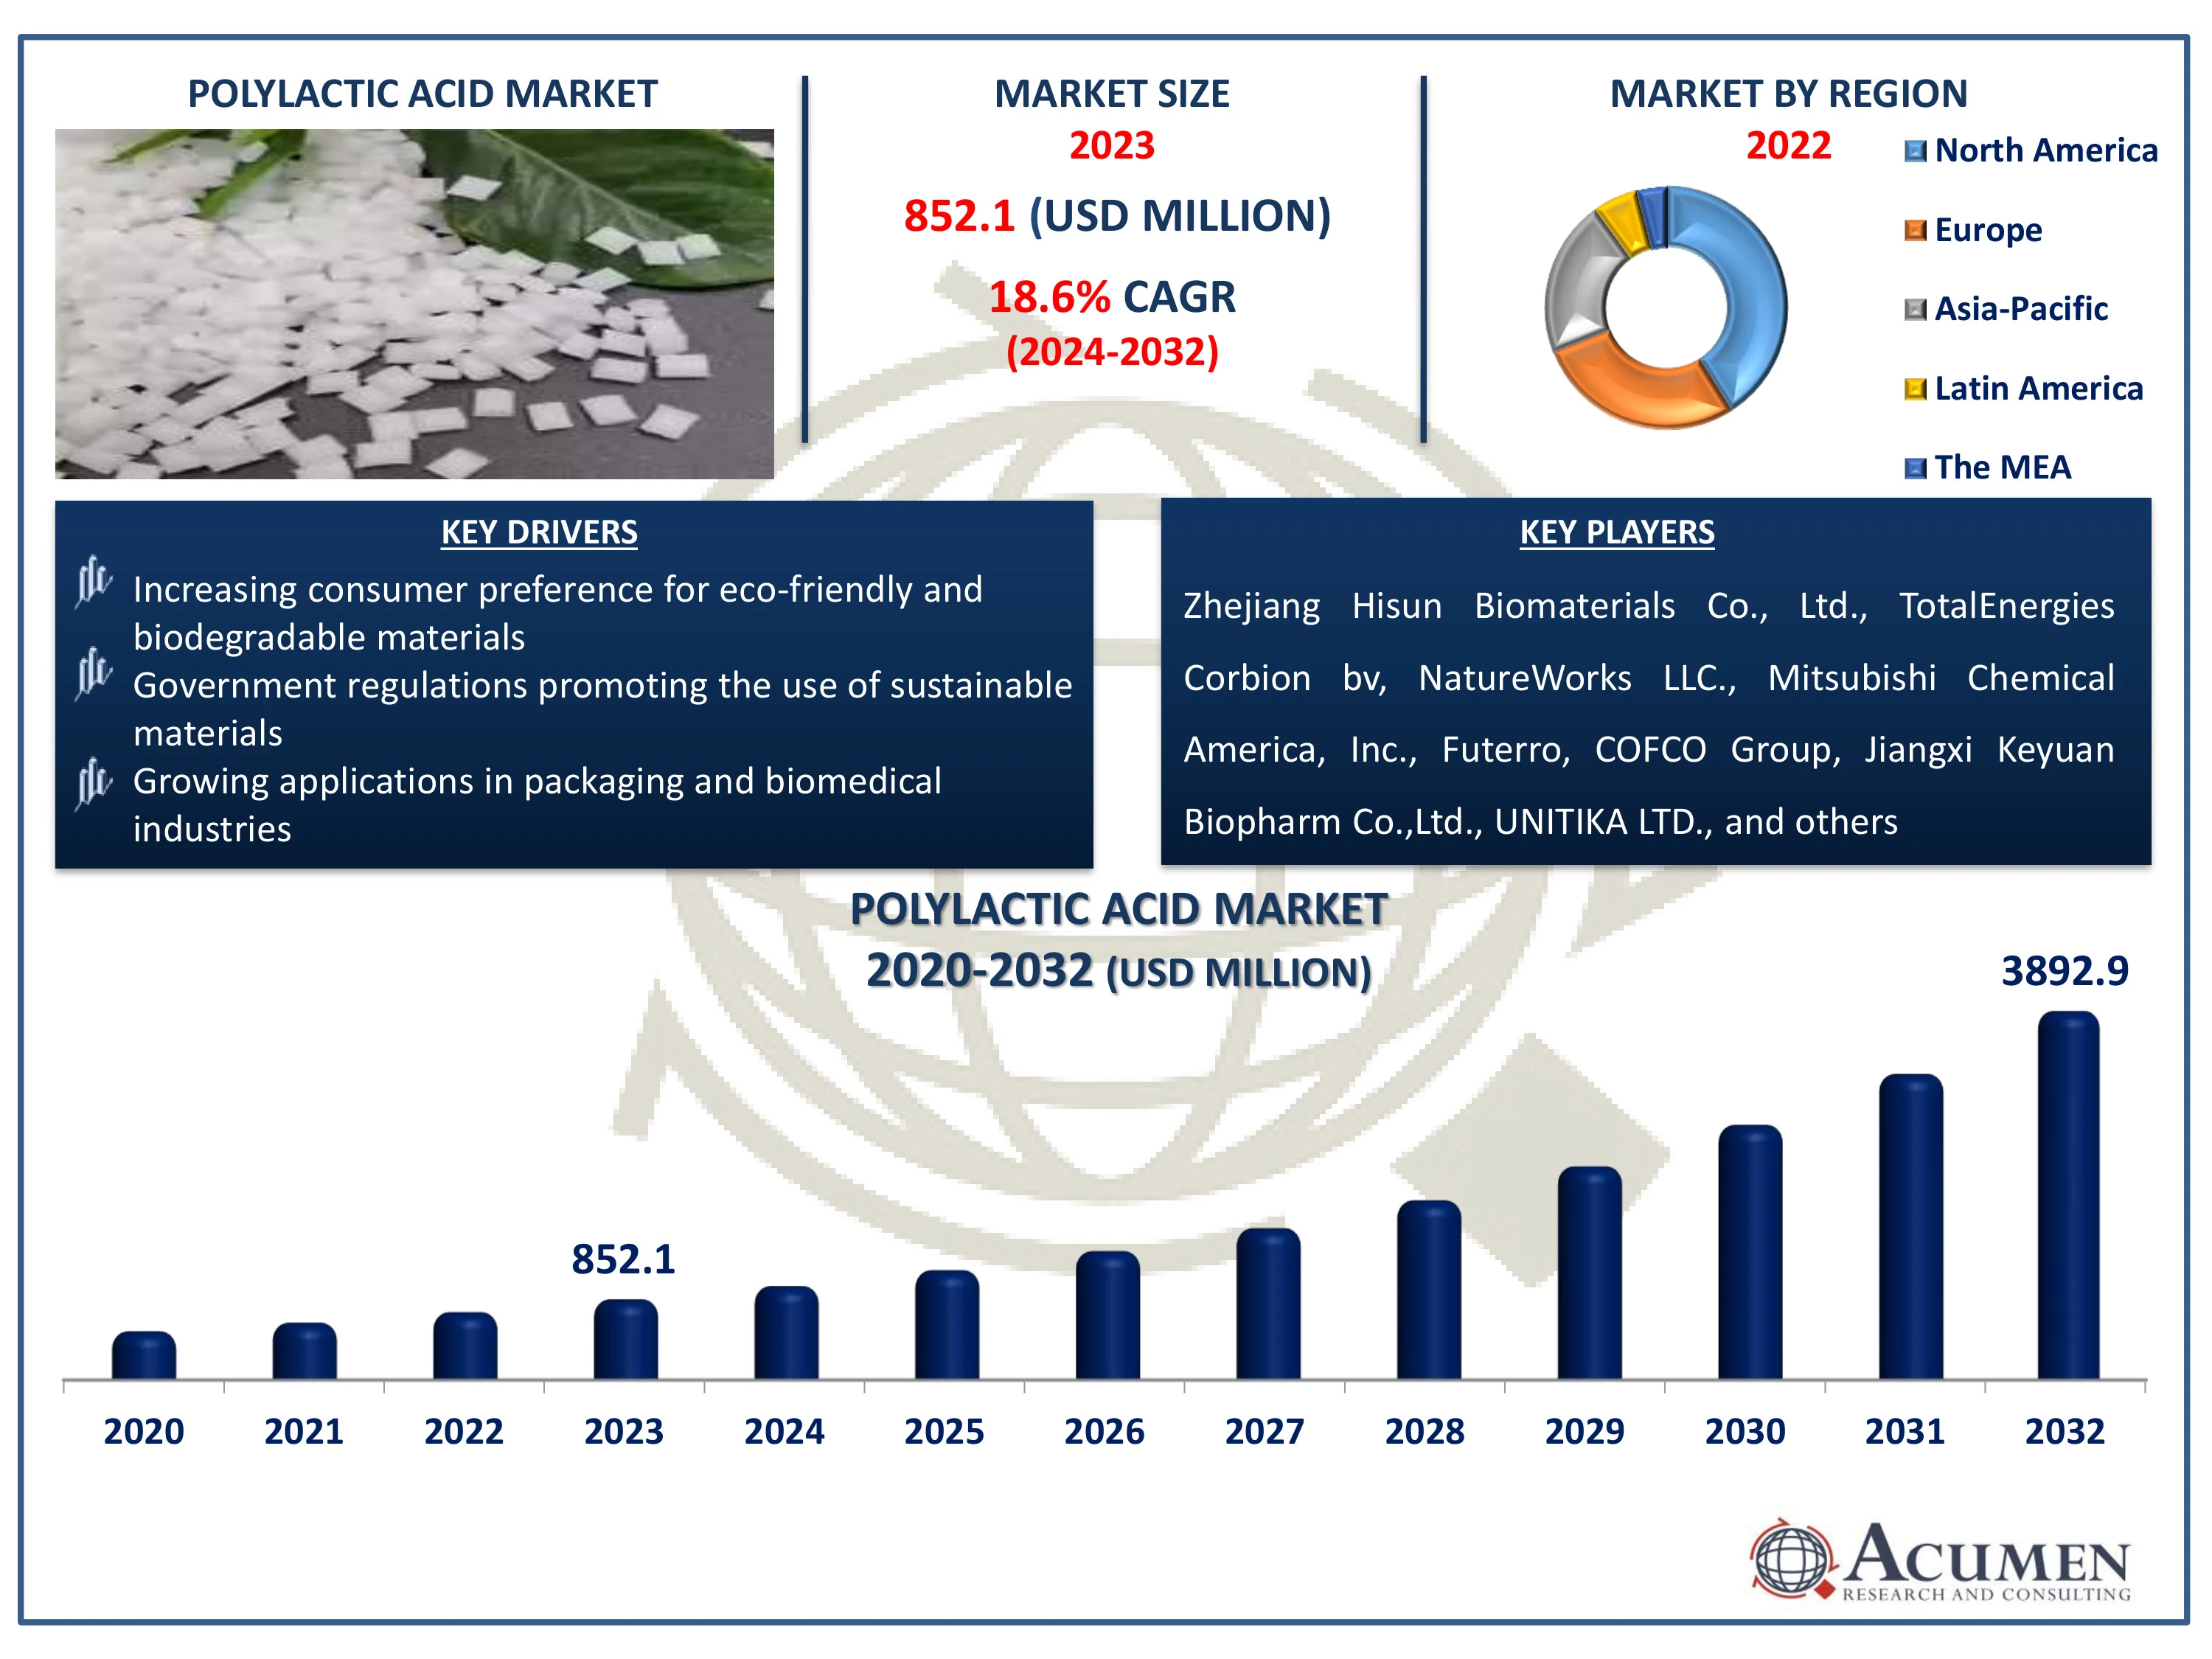
The Polylactic Acid Market Size accounted for USD 852.1 Million in 2023 and is estimated to achieve a market size of USD 3,892.9 Million by 2032 growing at a CAGR of 18.6% from 2024 to 2032.
Polylactic Acid Market Highlights
- Global polylactic acid market revenue is poised to garner USD 3,892.9 million by 2032 with a CAGR of 18.6% from 2024 to 2032
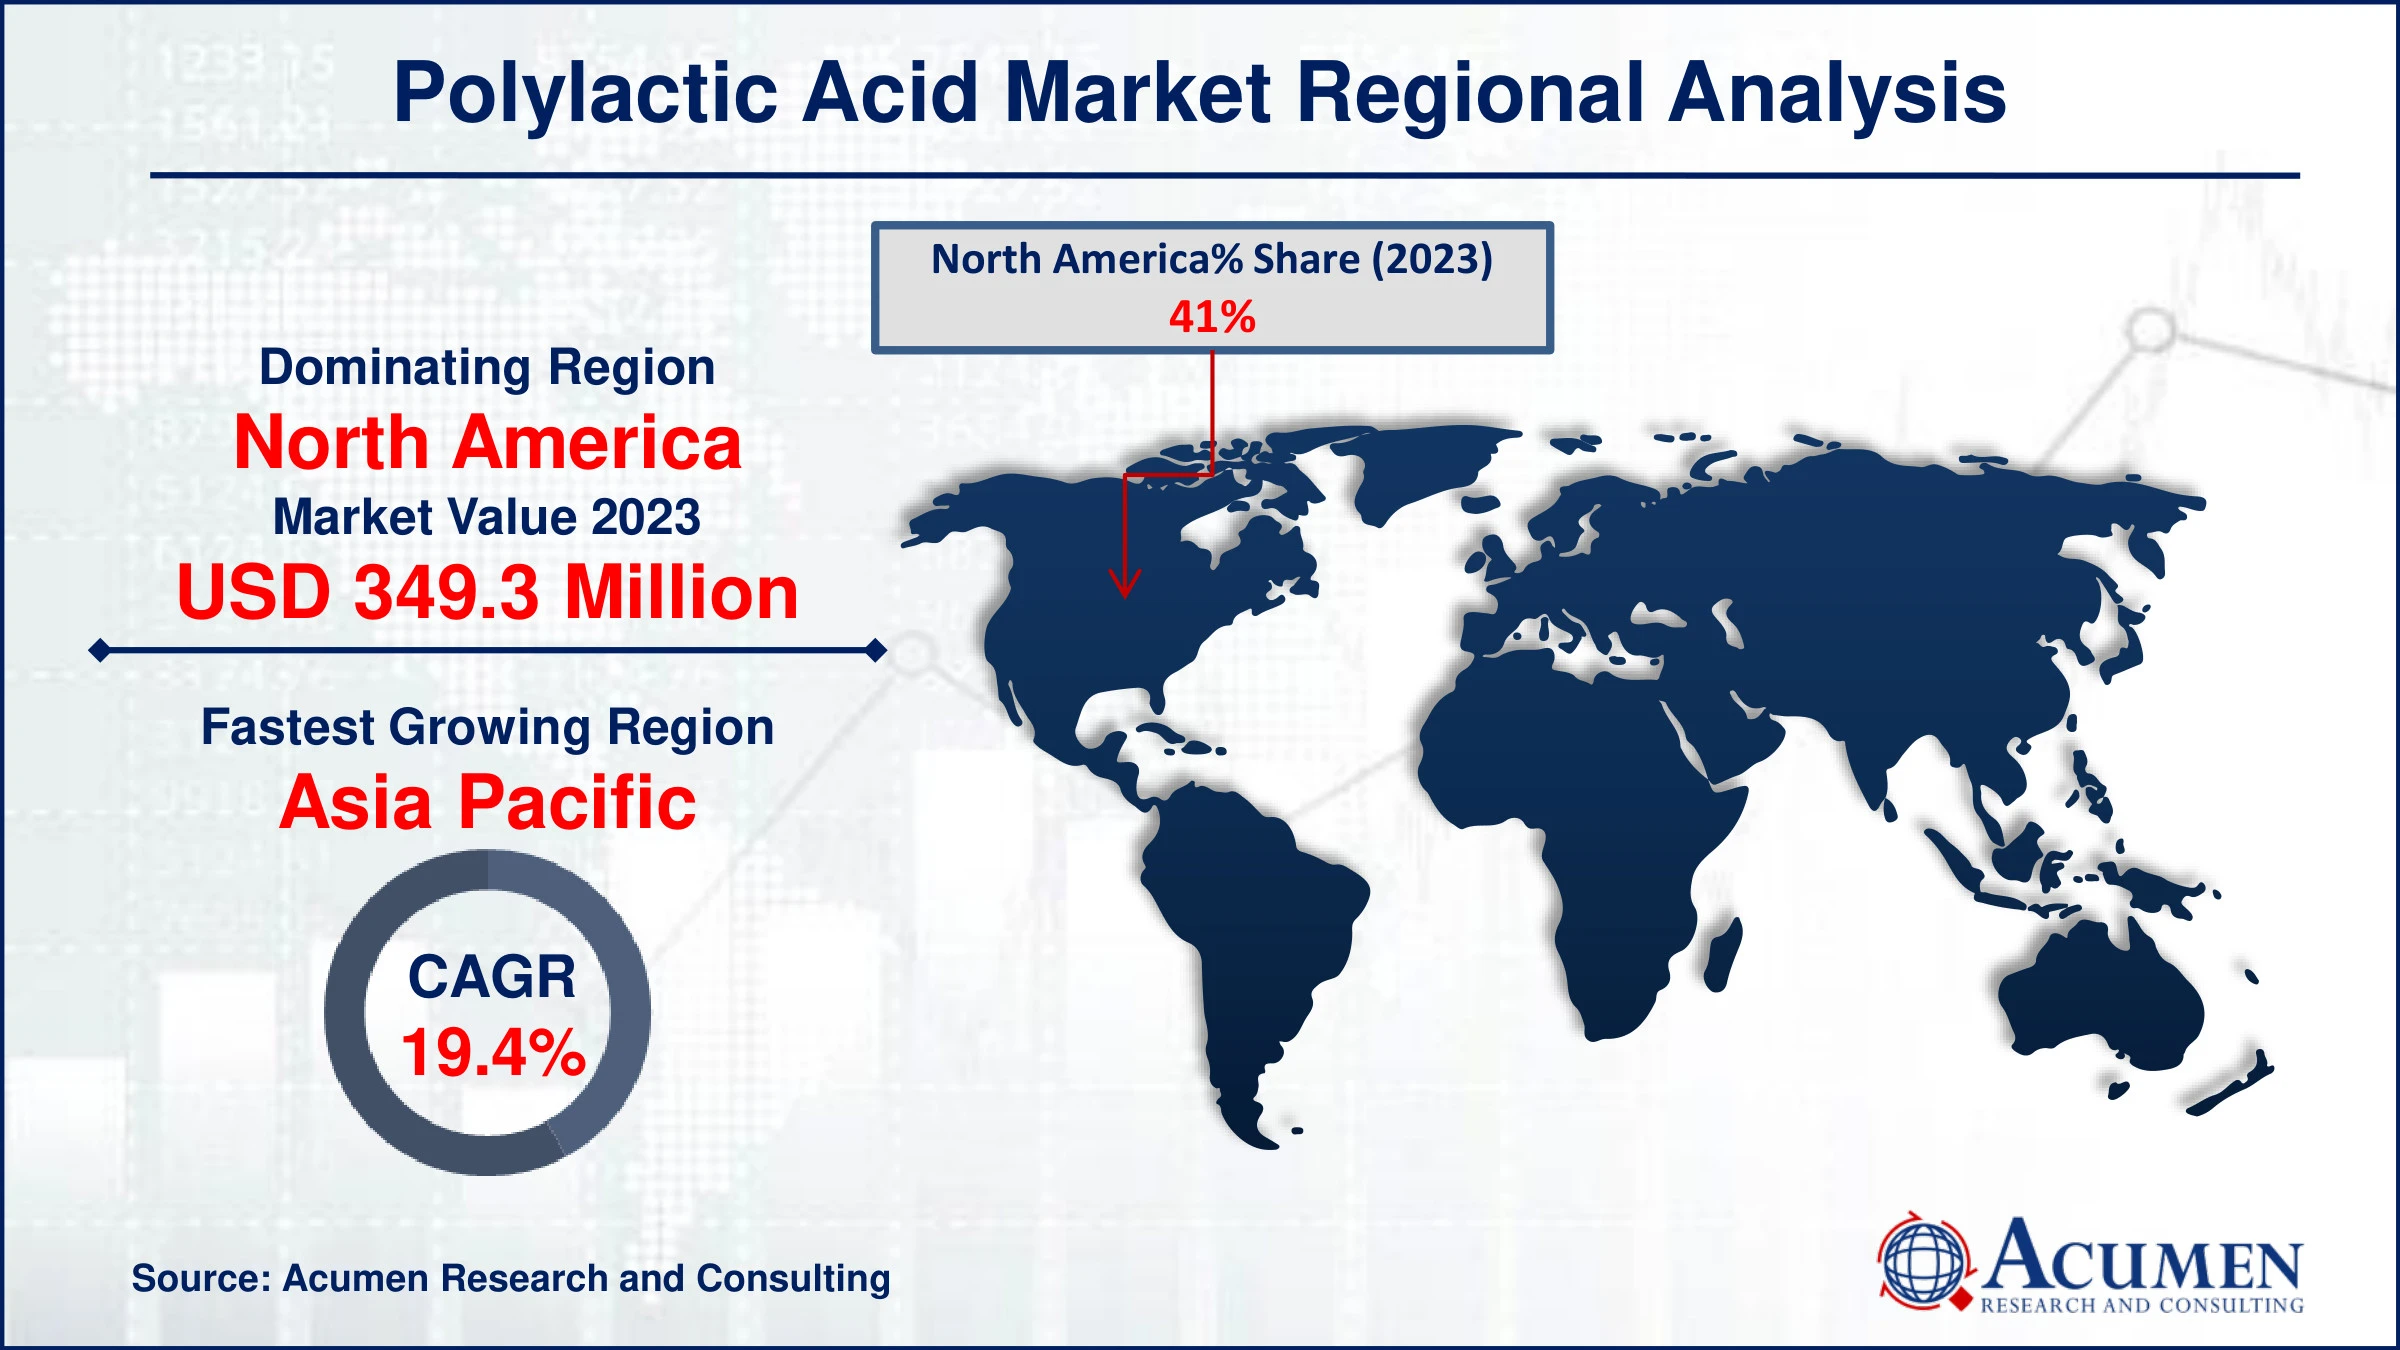
- North America polylactic acid market value occupied around USD 349.3 million in 2023
- Asia Pacific polylactic acid market growth will record a CAGR of more than 19.4% from 2024 to 2032
- Among raw material, the corn starch sub-segment generated 64% of the market share in 2023
- Based on application, the rigid thermoform sub-segment generated 44% of market share in 2023
- Growing demand for environmentally friendly packaging and products is the polylactic acid market trend that fuels the industry demand

Polylactic acid (PLA) is biodegradable polyester derived from renewable resources like corn starch or sugarcane. It's known for its environmental benefits, as it decomposes into non-toxic components under certain conditions, reducing plastic waste. PLA exhibits versatility in applications, ranging from packaging materials, disposable tableware, and textiles to medical implants and 3D printing filaments. Its biocompatibility makes it suitable for medical use, such as sutures and drug delivery systems. Despite its biodegradability, PLA also faces challenges such as brittleness and sensitivity to high temperatures, limiting its applications in certain industries. Nonetheless, ongoing research aims to enhance PLA's properties for broader industrial and commercial use.
Global Polylactic Acid Market Dynamics
Market Drivers
- Increasing consumer preference for eco-friendly and biodegradable materials
- Government regulations promoting the use of sustainable materials
- Growing applications in packaging and biomedical industries
Market Restraints
- Higher production costs compared to traditional plastics
- Limited heat resistance and mechanical properties for some applications
- Competition from other biodegradable polymers like PHA and starch blends
Market Opportunities
- Expansion in automotive and electronics sectors for lightweight components
- Technological advancements enhancing PLA's properties and processing capabilities
- Rising demand for compostable packaging materials in the food and beverage industry
Polylactic Acid Market Report Coverage
| Market | Polylactic Acid Market |
| Polylactic Acid Market Size 2022 | USD 852.1 Million |
| Polylactic Acid Market Forecast 2032 | USD 3,892.9 Million |
| Polylactic Acid Market CAGR During 2023 - 2032 | 18.6% |
| Polylactic Acid Market Analysis Period | 2020 - 2032 |
| Polylactic Acid Market Base Year |
2022 |
| Polylactic Acid Market Forecast Data | 2023 - 2032 |
| Segments Covered | By Raw Material, By Application, By End Use, And By Geography |
| Regional Scope | North America, Europe, Asia Pacific, Latin America, and Middle East & Africa |
| Key Companies Profiled | Zhejiang Hisun Biomaterials Co., Ltd., TotalEnergies Corbion, NatureWorks LLC., Mitsubishi Chemical America, Inc., Futerro, COFCO Group, Jiangxi Keyuan Biopharm Co., Ltd., UNITIKA LTD., Shanghai Tong-jie-liang Biomaterials Co., LTD., BASF SE, and Danimer Scientific. |
| Report Coverage |
Market Trends, Drivers, Restraints, Competitive Analysis, Player Profiling, Covid-19 Analysis, Regulation Analysis |
Polylactic Acid Market Insights
The polylactic acid (PLA) market is experiencing growth driven by rising consumer preference for eco-friendly and biodegradable materials. PLA, derived from renewable resources like corn starch or sugarcane, offers a sustainable alternative to traditional plastics. Its versatility in applications ranging from packaging to textiles and biomedical uses further enhances its appeal. As regulatory pressures and consumer awareness increase regarding environmental impact, PLA's market expansion is set to continue, fueled by its biodegradability and reduced carbon footprint compared to conventional plastics.
The PLA market faces challenges due to higher production costs compared to traditional plastics like polyethylene and polypropylene. PLA is derived from renewable resources such as corn starch or sugarcane, which can be more expensive than petrochemical-derived materials. This cost disparity often limits PLA's competitiveness, particularly in price-sensitive applications. Despite its eco-friendly profile and biodegradability, the economic feasibility of PLA hangs on achieving economies of scale and technological advancements to reduce production costs and enhance market penetration.
The increasing demand for compostable packaging materials within the food and beverage industry presents a significant opportunity for the PLA industry. For instance, established in 2022, Full Cycle Bioplastics is a startup specializing in the development and manufacture of compostable plastics derived from organic waste materials. Their pioneering technology transforms organic waste into premium bioplastics, aiming to diminish dependence on fossil fuels and provide a sustainable solution for managing plastic waste in a circular economy. PLA, derived from renewable resources such as corn starch or sugarcane, offers biodegradability and environmental sustainability. Its versatility in forming films, coatings, and rigid containers makes it attractive for eco-conscious consumers and businesses aiming to reduce their carbon footprint. As regulatory pressures and consumer preferences shift towards sustainable packaging solutions, PLA stands poised to capture a larger share of the market due to its compostability and renewable sourcing.
Polylactic Acid Market Segmentation
The worldwide market for polylactic acid is split based on raw material, application, end use, and geography.
Polylactic Acid (PLA) Market By Raw Material
- Corn starch
- Sugarcane
- Cassava
- Others
According to the polylactic acid industry analysis, corn starch plays a dominant role in the market due to its abundance, renewability, and ability to be fermented into lactic acid. PLA, a biodegradable and compostable polymer, derives its sustainability appeal from corn starch, which serves as the primary source for producing lactic acid through fermentation. This process aligns with growing environmental concerns, driving demand for PLA in various applications, including packaging, textiles, and biomedical uses. As industries seek greener alternatives to traditional plastics, corn starch's pivotal role in PLA production underscores its importance in sustainable material development.
Polylactic Acid (PLA) Market By Application
- Rigid Thermoform
- Film & Sheets
- Bottles
- Others
The rigid thermoform segment is the largest application category in the polylactic acid market and it is expected to increase over the industry,due to its versatility and cost-effectiveness in packaging and consumer goods. PLA, a biodegradable and renewable polymer, is favored for its environmental benefits and suitability for thermoforming processes. In rigid thermoforming, heated PLA sheets are molded into various shapes and sizes, ideal for food containers, trays, and other packaging applications. This dominance stems from PLA's ability to balance eco-friendliness with performance, meeting both consumer demand for sustainable materials and industry requirements for efficient manufacturing processes.
Polylactic Acid (PLA) Market By End Use
- Packaging
- Agriculture
- Automotive & Transportation
- Electronics
- Textile
- Consumer goods
- Bio-medical
- Others
According to the polylactic acid industry analysis, the packaging segment holds a dominant position as an end-use application. This is primarily due to PLA's biodegradability and compost ability, making it attractive for eco-friendly packaging solutions. PLA's versatility in forming transparent films, trays, bottles, and other packaging materials further enhances its appeal across various industries. Its ability to replace traditional petroleum-based plastics in food packaging, consumer goods, and medical packaging sectors underscores its growing significance in sustainable packaging solutions.
Polylactic Acid Market Regional Outlook
North America
- U.S.
- Canada
Europe
- U.K.
- Germany
- France
- Spain
- Rest of Europe
Asia-Pacific
- India
- Japan
- China
- Australia
- South Korea
- Rest of Asia-Pacific
Latin America
- Brazil
- Mexico
- Rest of Latin America
The Middle East & Africa
- South Africa
- GCC Countries
- Rest of the Middle East & Africa (ME&A)

Polylactic Acid Market Regional Analysis
For several reasons, North America holds a dominant position due to several key factors. First, the region benefits from robust demand across various industries such as packaging, textiles, and biomedical applications, driven by a strong emphasis on sustainability and biodegradability. Second, advancements in technology and manufacturing processes have bolstered production capacities, making North America a major producer of PLA. For instance, in April 2023, NatureWorks LLC announced a partnership with Jabil Inc. to offer new polylactic acid-based powder designed for specific laser sintering 3D printing platforms. Third, supportive regulatory frameworks and increasing consumer awareness of environmental issues further encourage the adoption of PLA-based products, solidifying North America's leadership in the global PLA market. These factors collectively position the region as a pivotal player in shaping the future growth of PLA.
The Asia-Pacific region has emerged as the fastest-growing area due to increasing demand for sustainable and biodegradable plastics. For instance, in May 2023, TotalEnergies Corbion partnered with Bluepha Co. Ltd to develop advanced sustainable biomaterial solutions in China. This collaboration combines Bluepha®'s polyhydroxyalkanoates (PHA) with TotalEnergies Corbion's Luminy® polylactic acid technology. Factors driving this growth include stringent environmental regulations, rising consumer awareness about eco-friendly products, and investments in bioplastic technologies by regional manufacturers. This trend is bolstered by a shift towards renewable resources and a growing emphasis on reducing carbon footprints across various industries in the Asia-Pacific region.
Polylactic Acid Market Players
Some of the top polylactic acid companies offered in our report include Zhejiang Hisun Biomaterials Co., Ltd., TotalEnergies Corbion, NatureWorks LLC., Mitsubishi Chemical America, Inc., Futerro, COFCO Group, Jiangxi Keyuan Biopharm Co.,Ltd., UNITIKA LTD., Shanghai Tong-jie-liang Biomaterials Co.,LTD., BASF SE, and Danimer Scientific.
Frequently Asked Questions
How big is the polylactic acid market?
The polylactic acid market size was valued at USD 852.1 million in 2023.
What is the CAGR of the global polylactic acid market from 2024 to 2032?
The CAGR of polylactic acid is 18.6% during the analysis period of 2024 to 2032.
Which are the key players in the polylactic acid market?
The key players operating in the global market are including Zhejiang Hisun Biomaterials Co., Ltd., TotalEnergies Corbion, NatureWorks LLC., Mitsubishi Chemical America, Inc., Futerro, COFCO Group, Jiangxi Keyuan Biopharm Co.,Ltd., UNITIKA LTD., Shanghai Tong-jie-liang Biomaterials Co.,LTD., BASF SE, and Danimer Scientific.
Which region dominated the global polylactic acid market share?
North America held the dominating position in polylactic acid industry during the analysis period of 2024 to 2032.
Which region registered fastest CAGR from 2024 to 2032?
Asia-Pacific region exhibited fastest growing CAGR for market of polylactic acid during the analysis period of 2024 to 2032.
What are the current trends and dynamics in the global polylactic acid industry?
The current trends and dynamics in the polylactic acid industry include increasing consumer preference for eco-friendly and biodegradable materials, government regulations promoting the use of sustainable materials, and growing applications in packaging and biomedical industries.
Which raw material held the maximum share in 2023?
The corn starch raw material held the maximum share of the polylactic acid industry.


