Poly Aluminum Chloride Market Size - Global Industry, Share, Analysis, Trends and Forecast 2022 - 2030
Published :
Report ID:
Pages :
Format :
Poly Aluminum Chloride Market Size - Global Industry, Share, Analysis, Trends and Forecast 2022 - 2030
Report Coverage
- Industry Dynamics
- Market Size and Forecast Data
- Segment Analysis
- Competitive Landscape
- Regional Analysis with a Niche Focus on Country-Level Data
- High Level Analysis - Porter's, PESTEL, Value Chain, etc.
- Company Profiles of Key Players
- Option to Customize the Report As Per Your Specific Need
Request Sample Report
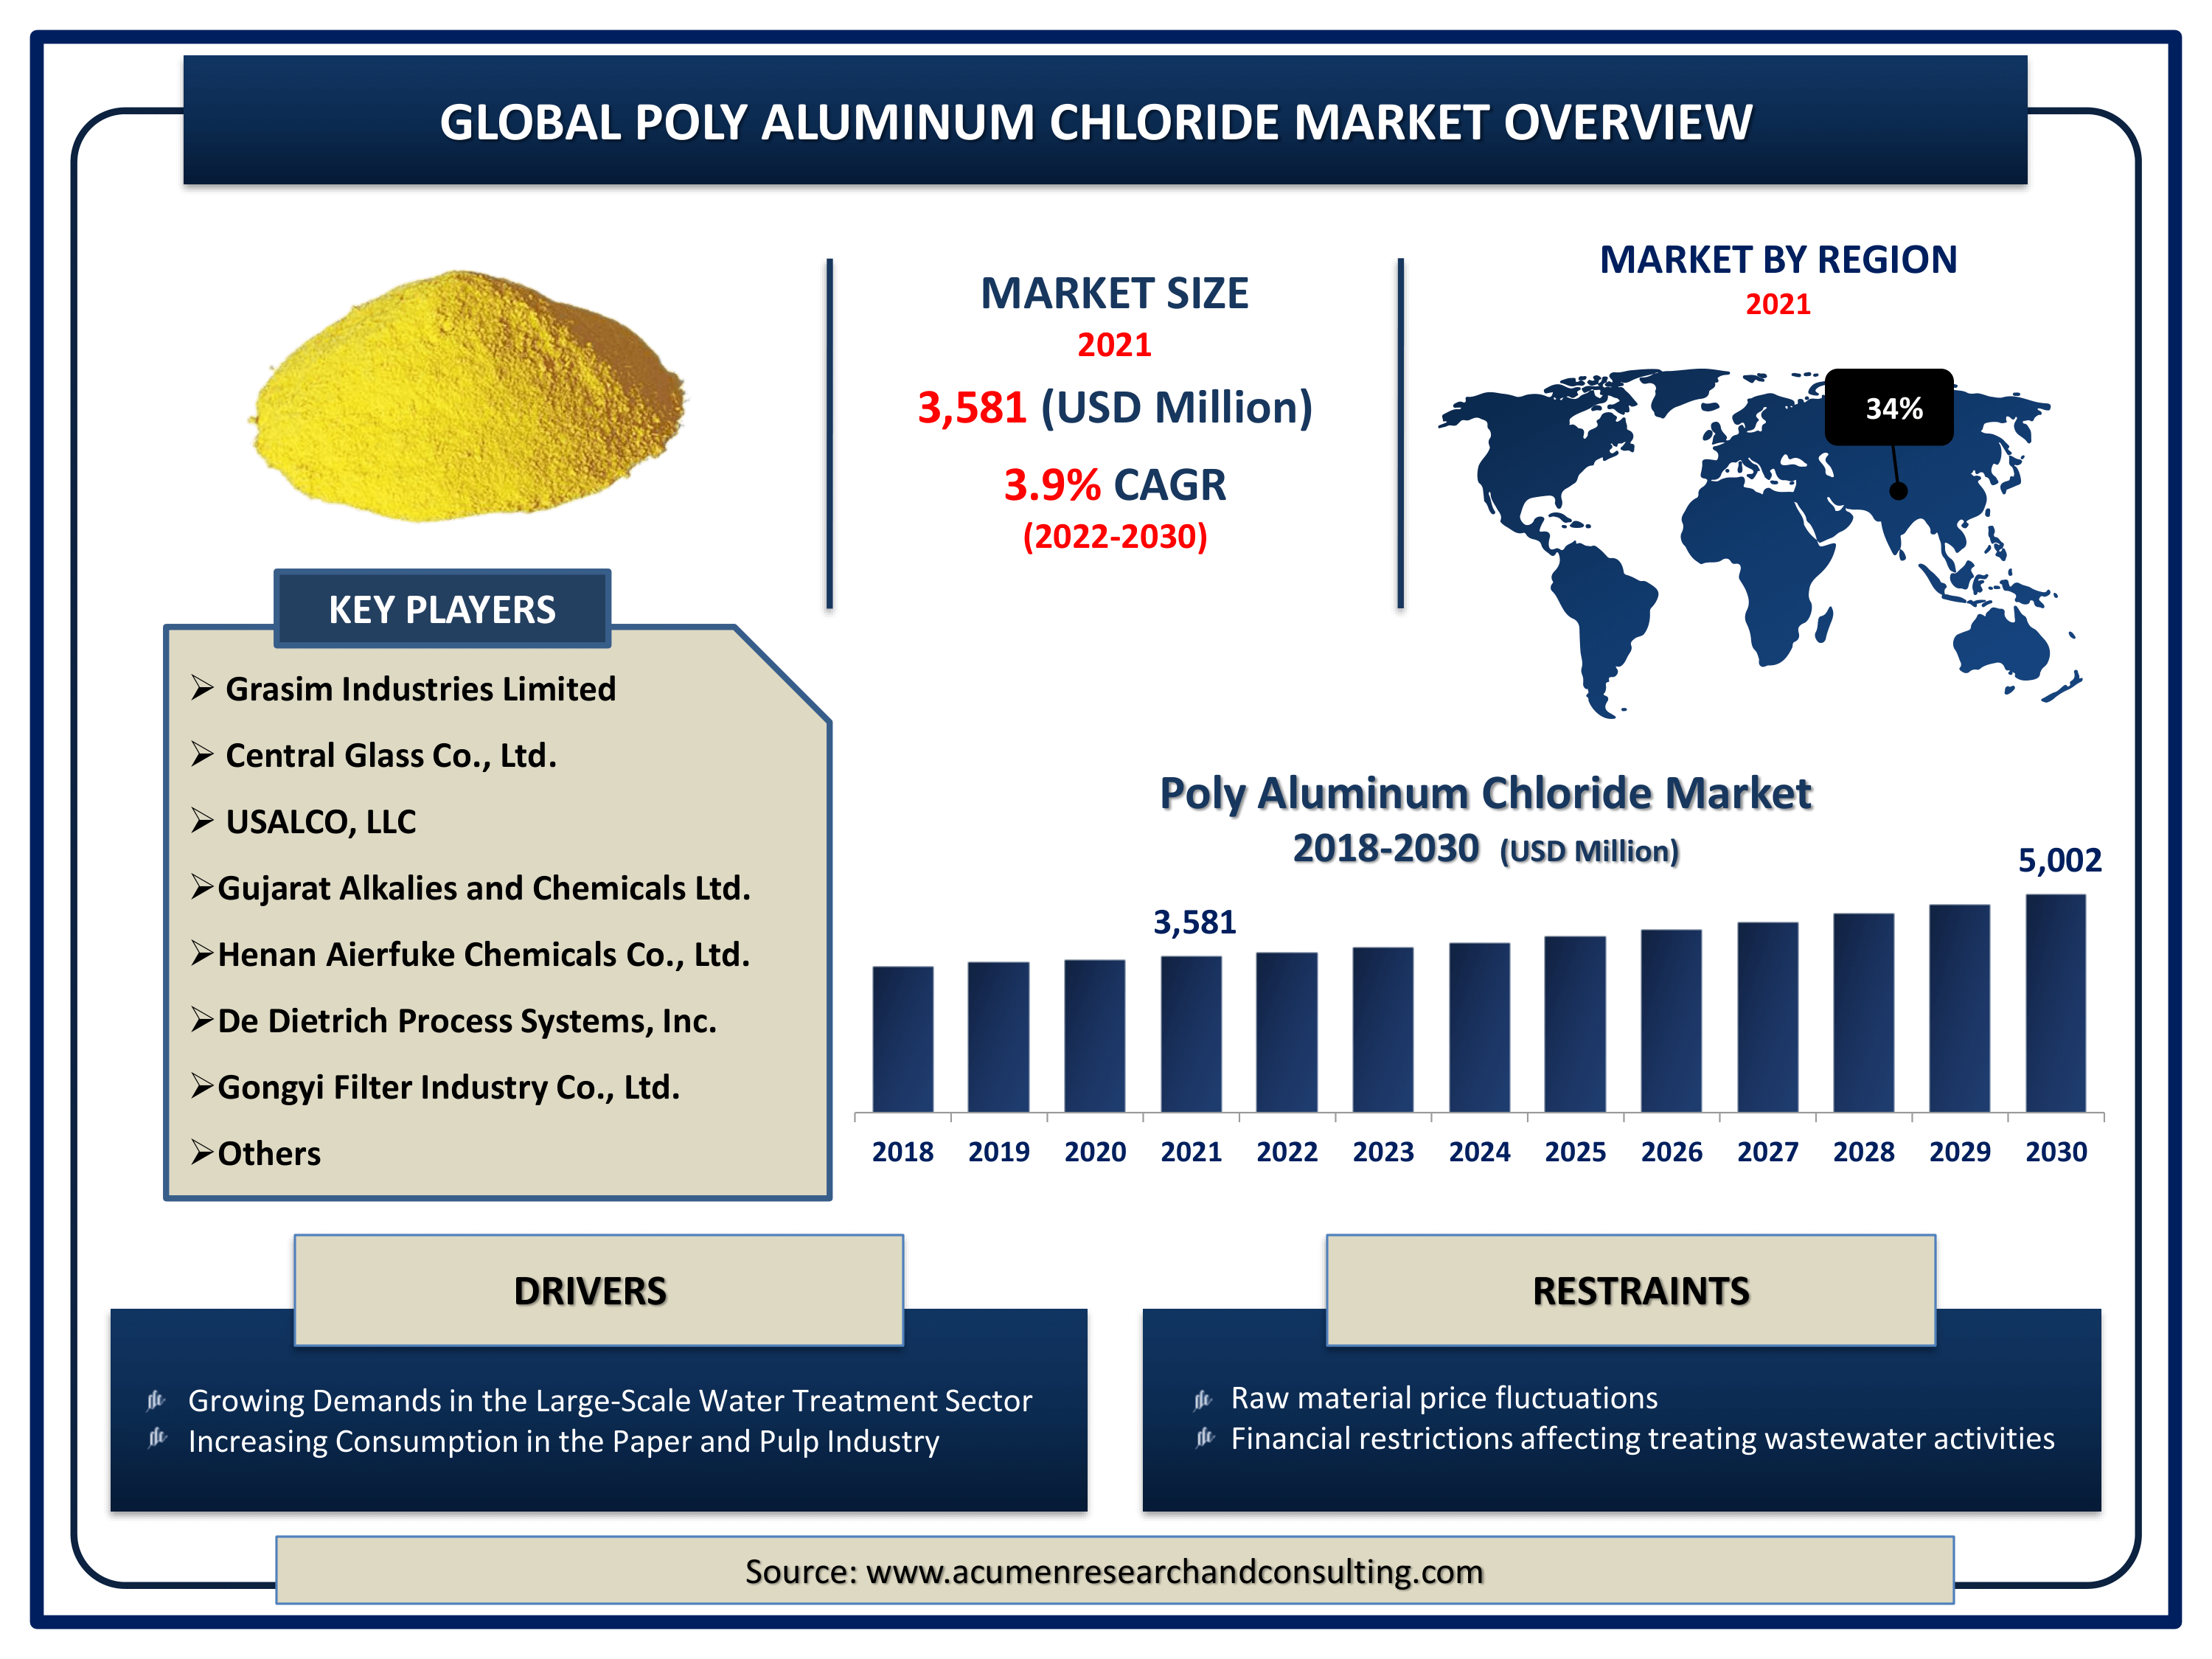
The Global Poly Aluminum Chloride Market Size accounted for USD 3,581 Million in 2021 and is estimated to achieve a market size of USD 5,002 Million by 2030 growing at a CAGR of 3.9% from 2022 to 2030. The widespread use for the treatment of industrial wastewater and drinking water is the key driver fueling the poly aluminum chloride market growth. Furthermore, increased demand for paper and paper-based products will drive the poly aluminum chloride market value in the coming years.

Poly Aluminum Chloride Market Report Key Highlights
- Global poly aluminum chloride market revenue is expected to increase by USD 5,002 million by 2030, with a 3.9% CAGR from 2022 to 2030.
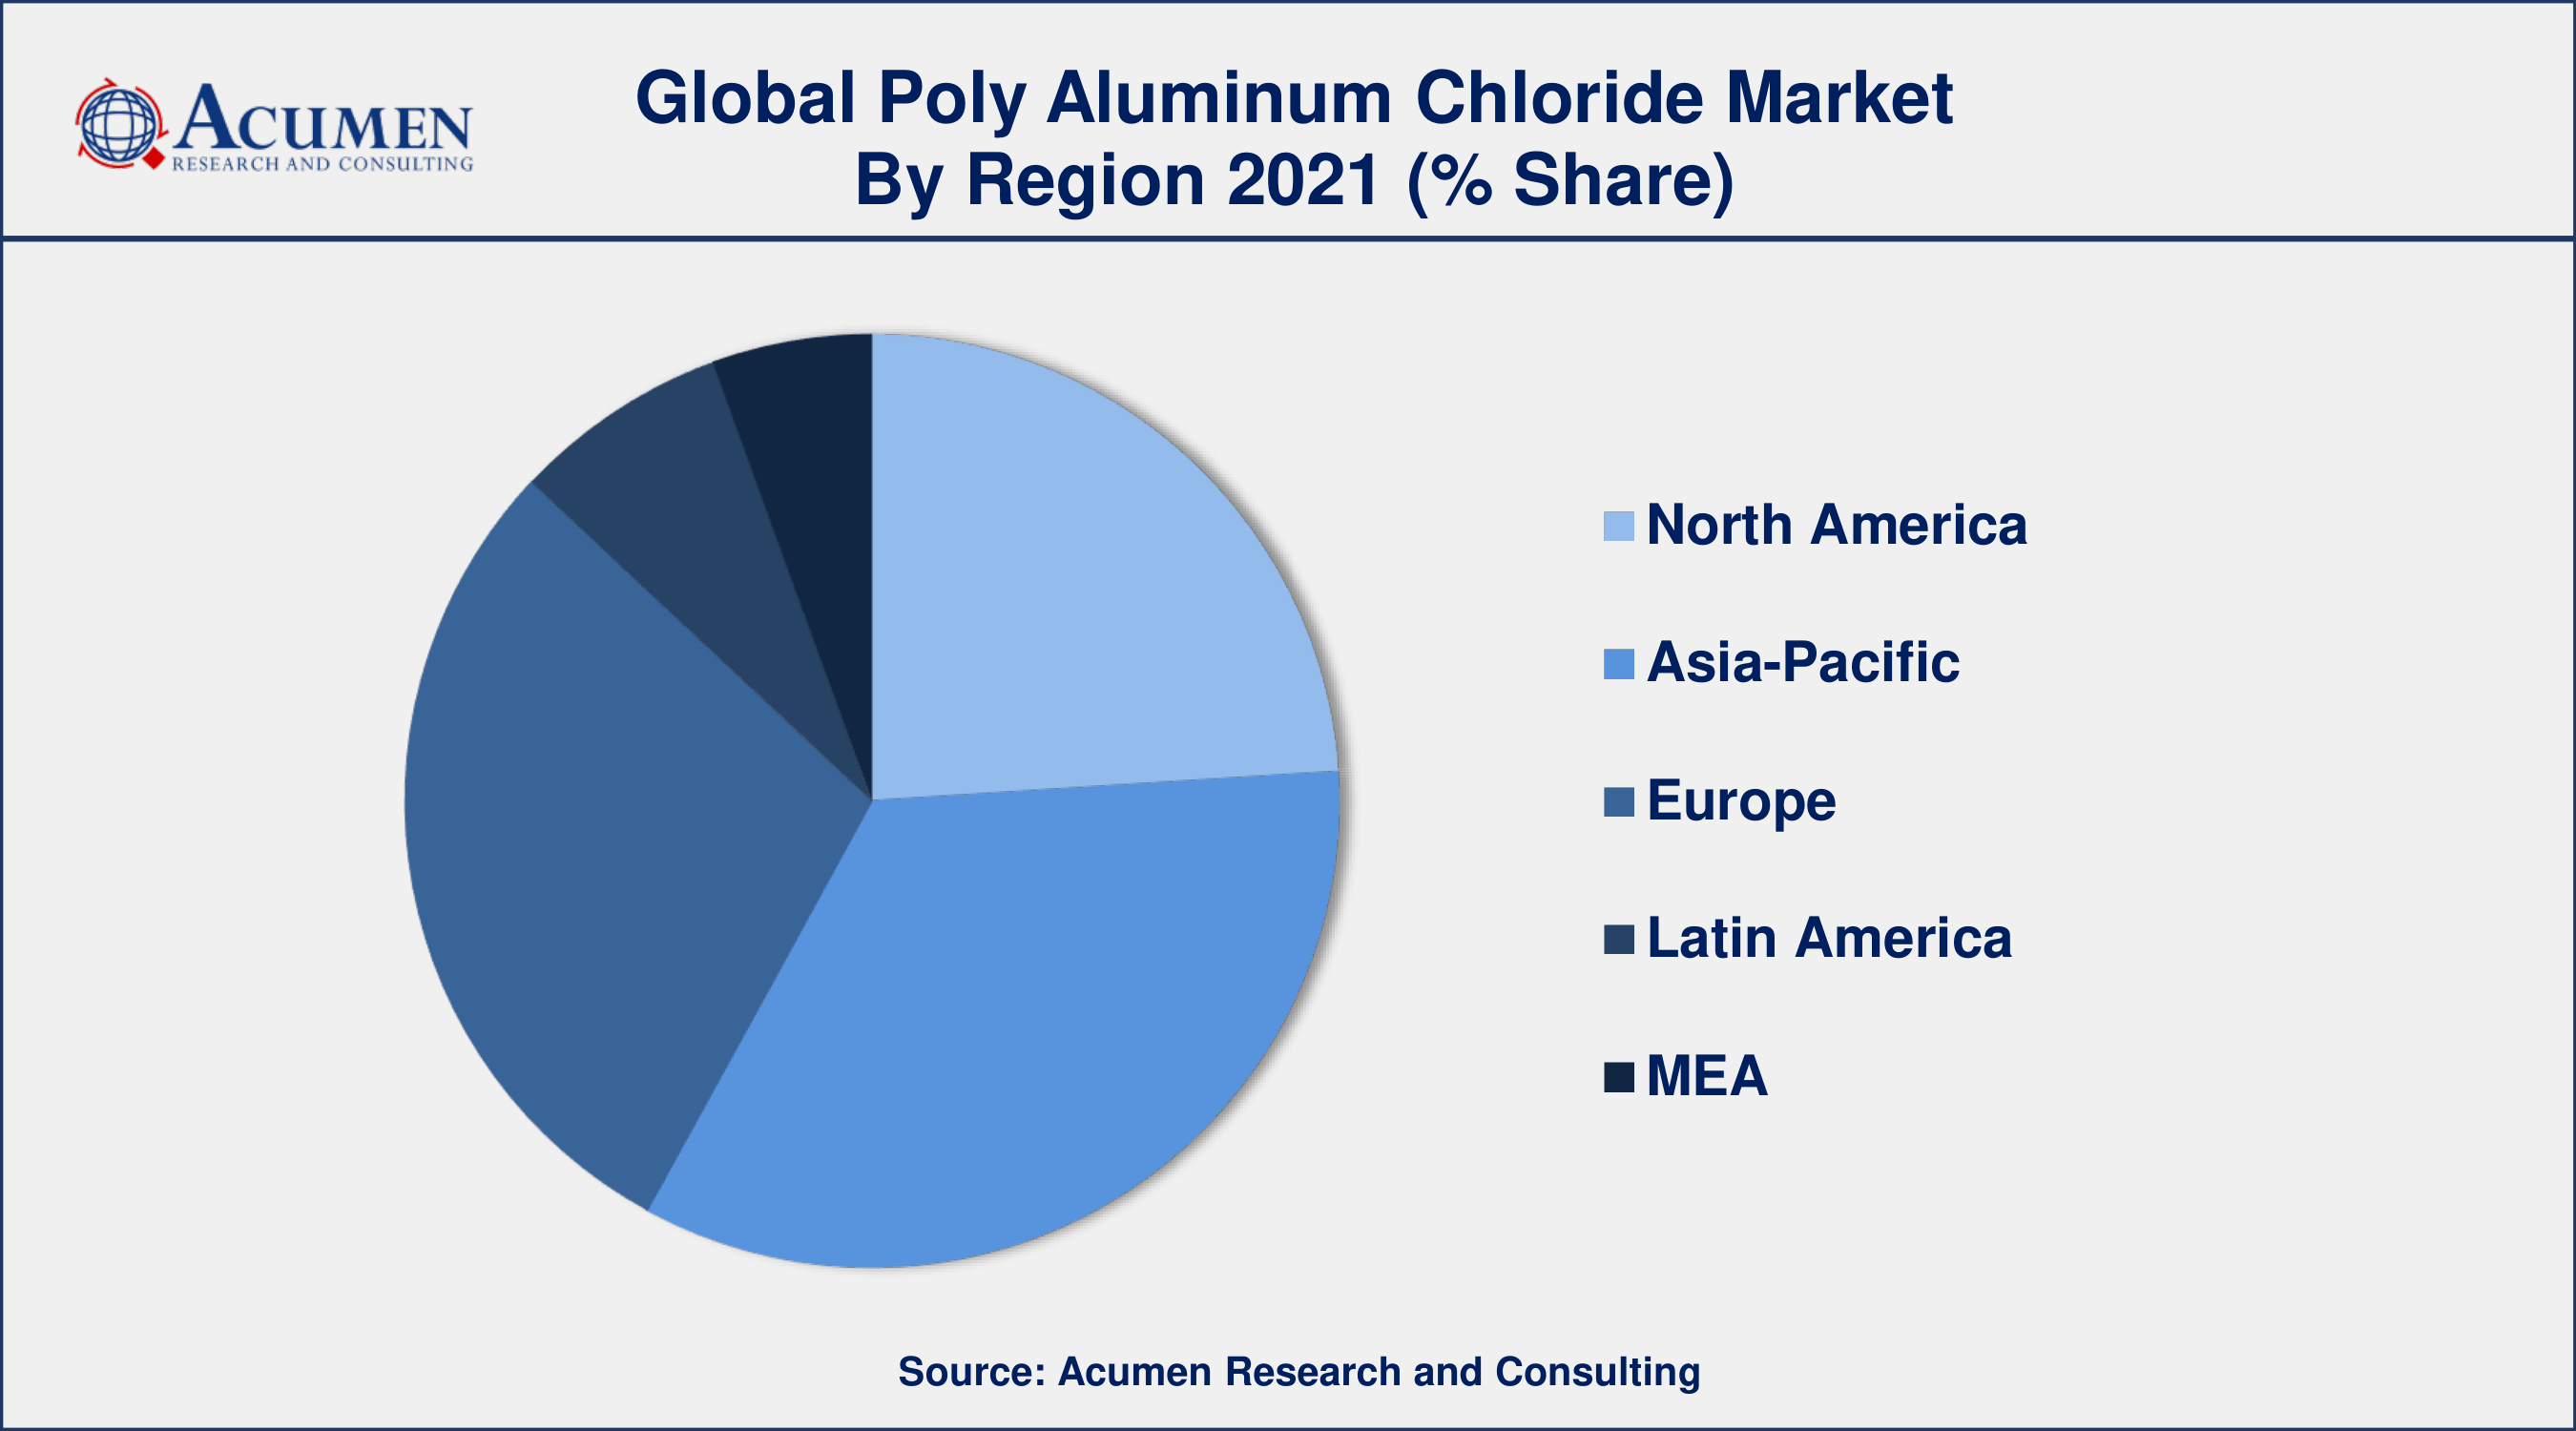
- Asia-Pacific poly aluminum chloride market share accounted for over 34% shares in 2021
- North America poly aluminum chloride market growth will record fastest CAGR from 2022 to 2030
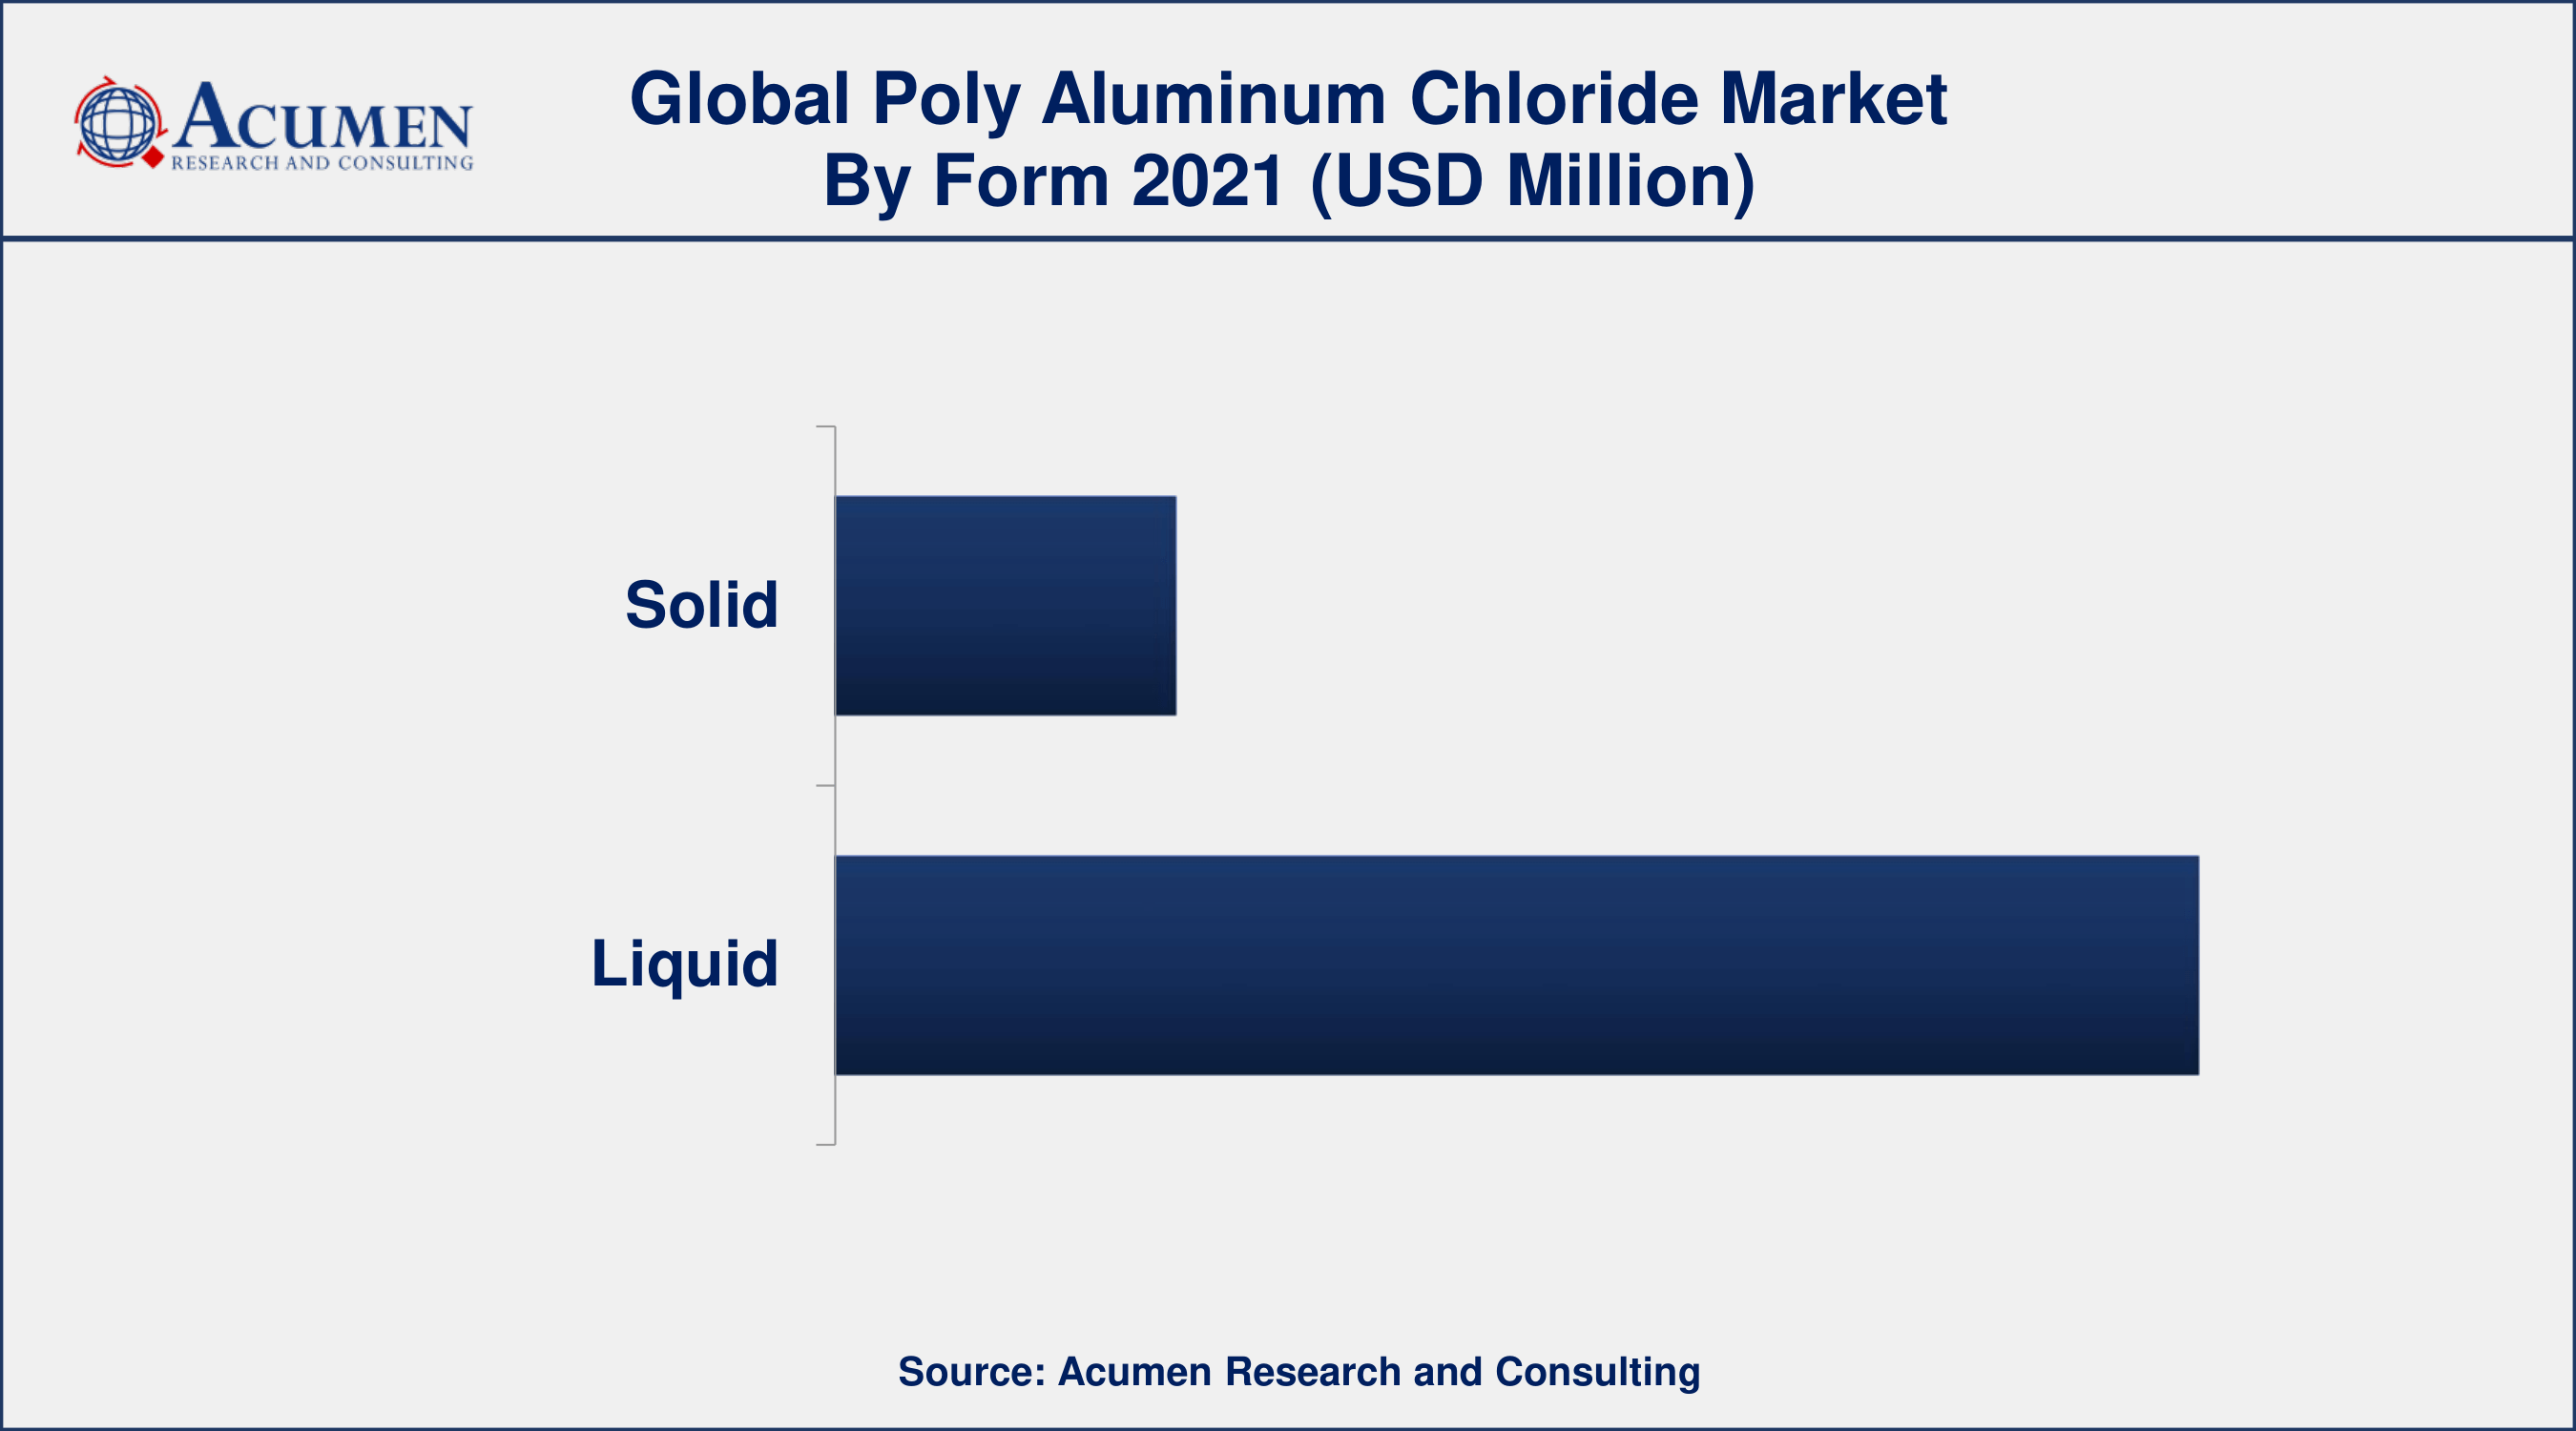
- By form, the liquid segment has accounted market share of over 81% in 2021
- By basicity, medium (50%-70%) segment engaged more than 52% of the total market share in 2021
- Growing demands in the large-scale water treatment sector, drives the poly aluminum chloride market value
Poly aluminum chloride (PAC) is a yellow-colored acidic solution that is classified as corrosive at higher concentrations. Furthermore, it is miscible with water at all concentrations, though dilute solutions hydrolyze to form aluminum hydroxide. Furthermore, poly aluminum chloride is not a single product, but a group of polymers distinguished by their strength and basicity, which provides an indication of the polymeric composition of PAC.
Global Poly Aluminum Chloride Market Dynamics
Market Drivers
- Growing demands in the large-scale water treatment sector
- Increasing consumption in the paper and pulp industry
- Tightening environmental regulations
- Rising demand for the personal care and cosmetic industry
Market Restraints
- Raw material price fluctuations
- Financial restrictions affecting treating wastewater activities
Market Opportunities
- Raising consciousness about the value of healthy drinking water
- Increasing demand from the pharmaceutical industry
Poly Aluminum Chloride Market Report Coverage
| Market | Poly Aluminum Chloride Market |
| Poly Aluminum Chloride Market Size 2021 | USD 3,581 Million |
| Poly Aluminum Chloride Market Forecast 2030 | USD 5,002 Million |
| Poly Aluminum Chloride Market CAGR During 2022 - 2030 | 3.9% |
| Poly Aluminum Chloride Market Analysis Period | 2018 - 2030 |
| Poly Aluminum Chloride Market Base Year | 2021 |
| Poly Aluminum Chloride Market Forecast Data | 2022 - 2030 |
| Segments Covered | By Form, By Basicity, By End-User, And By Geography |
| Regional Scope | North America, Europe, Asia Pacific, Latin America, and Middle East & Africa |
| Key Companies Profiled | Kemira Oyj, Grasim Industries Limited, Central Glass Co., Ltd., USALCO, LLC, Gujarat Alkalies and Chemicals Limited, Henan Aierfuke Chemicals Co., Ltd., De Dietrich Process Systems, Inc., Gongyi Filter Industry Co., Ltd., and Chemical Company of Malaysia Bhd. |
| Report Coverage |
Market Trends, Drivers, Restraints, Competitive Analysis, Player Profiling, Regulation Analysis |
Poly Aluminum Chloride (PAC) For Water Treatment Plant Bolsters The Growth Of The Global Market
Pool Water Treatment Advisory Group (PWTAG) has largely recommended consistent coagulation with poly aluminum chloride against the threat of Cryptosporidium, according to a report released by Swimming.org. PAC, like other coagulants, extracts and then clumps together dissolved, colloidal, and suspended matter. The basicity of PAC is an important property. The basicity of PAC products can range between 5% and 65%. In general, the higher the basicity, the higher content of the polymer, and the greater the cationic charge density and efficiency. Higher basicity products contain less aluminum but are more efficient in water clarification (specifically turbidity/suspended solids removal). Such factors have a positive impact on the growth of the global poly aluminum chloride market.
Poly Aluminum Chloride (PAC) In Pulp And Paper Industry Gained Significant Attention In The Worldwide Market Thereby Stimulating Overall Growth Worldwide
According to a World Academy of Science, Engineering, and Technology report, pulp and paper mill effluent is one of the most polluting effluents obtained from polluting industries. All of the treatment options available for the treatment of pulp and paper mill effluent have drawbacks. Coagulation is one of the cheapest methods for treating various organic effluents. Under the coagulation process, the removal of chemical oxygen demand (COD) and the color of paper mill effluent are studied. For the record, extensive research concluded that poly aluminum chloride (PAC) as a coagulant reduces COD to 84% and color removal to 92% at an optimum pH of 5. Such factors will help the global PAC market grow in the coming years.
Poly Aluminum Chloride Market Segmentation
The global poly aluminum chloride market segmentation is based on form, basicity, end-user, and geography.
Poly Aluminum Chloride Market By Form
- Solid
- Liquid

According to a poly aluminum chloride industry analysis, the liquid segment will dominate the global market during the forecast period. Poly aluminum chloride solution is a colorless and odorless liquid that functions as a powerful coagulant. The product is well suited for a wide range of industrial applications, including use as a flocculent in water purification and treatment of potable and wastewater. Furthermore, liquid poly aluminum chloride has a wide range of applications in the paper and pulp industries. Such factors are responsible for segmental growth, which in turn contributes to the overall growth of the global poly aluminum chloride market.
Poly Aluminum Chloride Market By Basicity
- Low (below 10%)
- Medium (50%-70%)
- High (above 83%)
According to basicity, the high (above 83%) basicity poly aluminum chloride segment will experience attributable CAGR in the coming years. Because poly aluminum chloride has high basicity of more than or equal to 83%, it reduces the residual aluminum content of drinking water. Furthermore, high-basicity PAC products have been optimized for particle removal by controlling AI species formation in the coagulant. Such factors have a positive impact on segmental growth, which in turn contributes to the overall market growth of the poly aluminum chloride market.
Poly Aluminum Chloride Market By End-User
- Water treatment
- Textiles
- Pulp & paper
- Oil & gas
- Others
According to the poly aluminum chloride market forecast, the water treatment segment has held the dominating share of the end-user market in the past and is expected to do so again during the forecast period. According to the Programme Solidarité-Eau (PSEAU) report, the vast majority of PAC produced is used in portable water applications, with some also used in industrial waste treatment and very little used in sewage treatment. Aluminum sulfate is also replacing PACS for the following reasons: lower dosage requirement, no need for any neutralizing agent (soda, lime), shorter flocculation time, a small amount of sludge required, and reduced number of backwashing steps. Furthermore, because the product is much less acidic than aluminum sulfate, it has little or no effect on the pH of the water to which it is added. Such factors strongly support segmental growth, which in turn contributes to global market growth.
Poly Aluminum Chloride Market Regional Outlook
North America
- U.S.
- Canada
Europe
- U.K.
- Germany
- France
- Spain
- Rest of Europe
Asia-Pacific
- India
- Japan
- China
- Australia
- South Korea
- Rest of Asia-Pacific
Latin America
- Brazil
- Mexico
- Rest of Latin America
The Middle East & Africa
- South Africa
- GCC Countries
- Rest of the Middle East & Africa (ME&A)

Asia-Pacific Dominates The Poly Aluminum Chloride Market By Recording The Highest Revenue Share
Asia-Pacific dominated the market in 2021 and is expected to maintain this dominance throughout the forecast period. The presence of major players in this region is one of the key factors that contribute to the eventual growth of poly aluminum chloride in Asia-Pacific provinces, thereby stimulating the overall market. Kanoria Chemicals & Industries Limited (KCI), one of the leading Indian manufacturers of chemical intermediates, recently announced the commissioning of a poly aluminum chloride plant in India. The unit will be able to produce approximately 60,000 tonnes of poly aluminum chloride for water treatment each year.
Europe, on the other hand, has experienced consistent growth in terms of CAGR for the poly aluminum chloride market and is expected to continue at this rate throughout the forecast period. New eco-innovative drinking water treatment required in the EU necessitates the production of poly aluminum chloride, which is one of the key factors driving the overall market growth. According to a report released by the EUROPEAN COMMISSION - CINEA - D2, Europe currently produces 44,000 million m3/year of drinking water. Inorganic poly aluminum coagulants (PAC) are required for purification in drinking water treatment plants.
Poly Aluminum Chloride Market Players
Some of the top poly aluminum chloride market companies offered in the professional report include Kemira Oyj, Grasim Industries Limited, Central Glass Co., Ltd., USALCO, LLC, Gujarat Alkalies and Chemicals Limited, Henan Aierfuke Chemicals Co., Ltd., De Dietrich Process Systems, Inc., Gongyi Filter Industry Co., Ltd., and Chemical Company of Malaysia Bhd.
Frequently Asked Questions
What is the size of global poly aluminum chloride market in 2021?
The estimated value of global poly aluminum chloride market in 2021 was accounted to be USD 3,581 Million.
What is the CAGR of global poly aluminum chloride market during forecast period of 2022 to 2030?
The projected CAGR poly aluminum chloride market during the analysis period of 2022 to 2030 is 3.9%.
Which are the key players operating in the market?
The prominent players of the global poly aluminum chloride market are Kemira Oyj, Grasim Industries Limited, Central Glass Co., Ltd., USALCO, LLC, Gujarat Alkalies and Chemicals Limited, Henan Aierfuke Chemicals Co., Ltd., De Dietrich Process Systems, Inc., Gongyi Filter Industry Co., Ltd., and Chemical Company of Malaysia Bhd.
Which region held the dominating position in the global poly aluminum chloride market?
North America held the dominating poly aluminum chloride during the analysis period of 2022 to 2030.
Which region registered the fastest growing CAGR for the forecast period of 2022 to 2030?
Asia-Pacific region exhibited fastest growing CAGR for poly aluminum chloride during the analysis period of 2022 to 2030.
What are the current trends and dynamics in the global poly aluminum chloride market?
Growing demands in the large-scale water treatment sector, and increasing consumption in the paper and pulp industry drives the growth of global poly aluminum chloride market.
By form segment, which sub-segment held the maximum share?
Based on form, liquid segment is expected to hold the maximum share of the poly aluminum chloride market.


