Point Of Sale (POS) Market | Acumen Research and Consulting
Point Of Sale (POS) Market Size - Global Industry, Share, Analysis, Trends and Forecast 2024 - 2032
Published :
Report ID:
Pages :
Format :
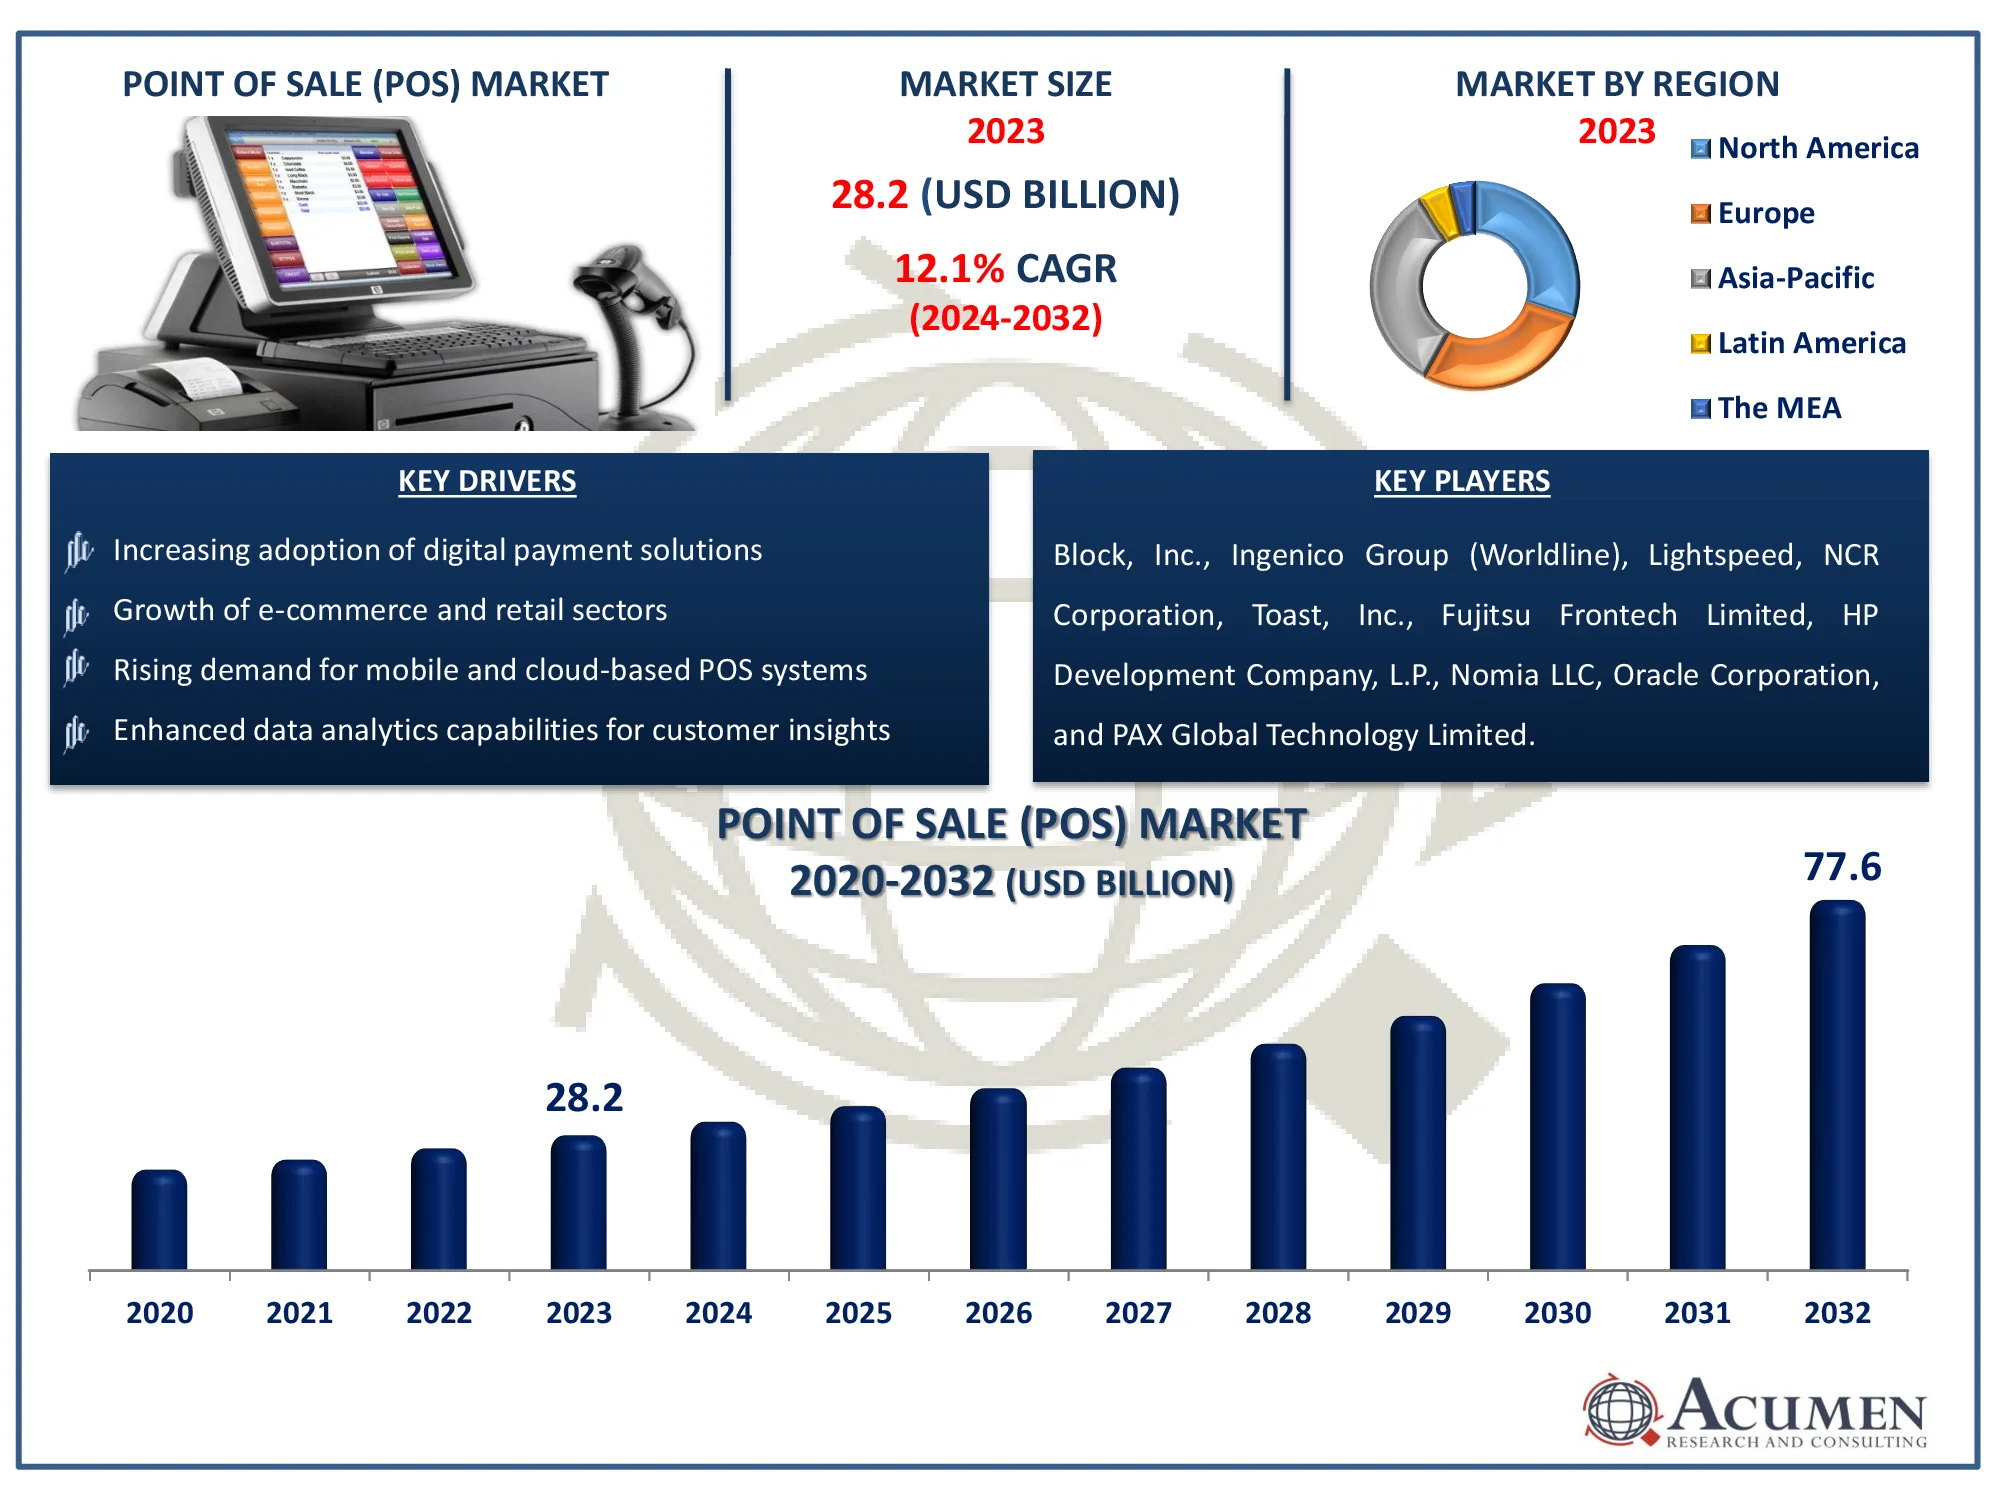
The Global Point of Sale (POS) Market Size accounted for USD 28.2 Billion in 2023 and is estimated to achieve a market size of USD 77.6 Billion by 2032 growing at a CAGR of 12.1% from 2024 to 2032.
Point Of Sale (POS) Market Highlights
- Global point of sale (POS) market revenue is poised to garner USD 77.6 billion by 2032 with a CAGR of 12.1% from 2024 to 2032
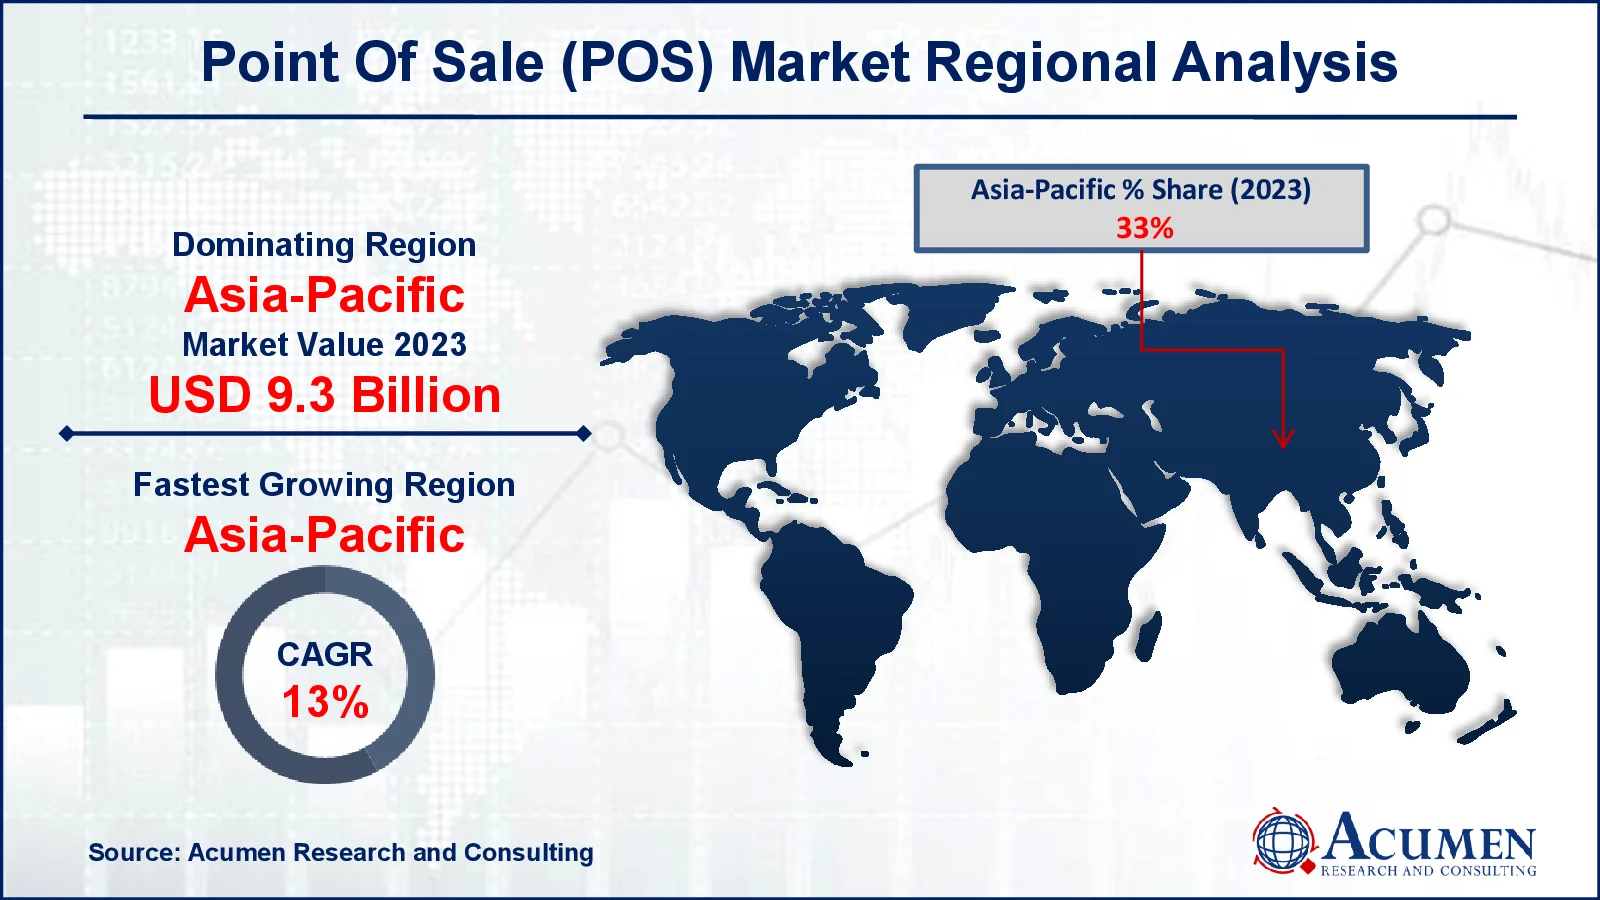
- Asia-Pacific point of sale (POS) market value occupied around USD 9.3 billion in 2023
- Asia-Pacific point of sale (POS) market growth will record a CAGR of more than 13% from 2024 to 2032
- Among product, the fixed sub-segment generated noteworthy revenue in point of sale market in 2023
- Based on deployment, the cloud sub-segment generated significant point of sale (POS) market share in 2023
- Development of POS solutions for omnichannel retailing is a popular point of sale (POS) market trend that fuels the industry demand

A point of sale (POS) system is the area where customers finalize their purchases, which is commonly found in retail settings. It uses both hardware and software to conduct transactions, track sales, and manage inventories. A POS terminal typically consists of a cash register, barcode scanner, card reader, and receipt printer. Modern point-of-sale systems interface with cloud-based software, enabling firms to analyze sales data, manage customer loyalty programs, and track inventories in real time. They also accept a variety of methods, including credit cards, digital wallets, and contactless payments. POS systems improve efficiency, give vital company insights, and enhance the entire consumer experience by streamlining the checkout process.
Global Point Of Sale (POS) Market Dynamics
Market Drivers
- Increasing adoption of digital payment solutions
- Growth of e-commerce and retail sectors
- Rising demand for mobile and cloud-based POS systems
- Enhanced data analytics capabilities for customer insights
Market Restraints
- High implementation and maintenance costs
- Data security and privacy concerns
- Dependence on stable internet connectivity
Market Opportunities
- Expansion in emerging markets with growing retail infrastructure
- Integration of AI and machine learning in POS systems
- Rising demand for contactless and mobile payments
Point Of Sale (POS) Market Report Coverage
| Market | Point Of Sale (POS) Market |
| Point Of Sale (POS) Market Size 2022 |
USD 28.2 Billion |
| Point Of Sale (POS) Market Forecast 2032 | USD 77.6 Billion |
| Point Of Sale (POS) Market CAGR During 2023 - 2032 | 12.1% |
| Point Of Sale (POS) Market Analysis Period | 2020 - 2032 |
| Point Of Sale (POS) Market Base Year |
2023 |
| Point Of Sale (POS) Market Forecast Data | 2024 - 2032 |
| Segments Covered | By Product, By Component, By Deployment, By Operating System, By Application, And By Geography |
| Regional Scope | North America, Europe, Asia Pacific, Latin America, and Middle East & Africa |
| Key Companies Profiled | Block, Inc., Ingenico Group (Worldline), Lightspeed, NCR Corporation, Toast, Inc., Fujitsu Frontech Limited, HP Development Company, L.P., Nomia LLC, Oracle Corporation, and PAX Global Technology Limited. |
| Report Coverage |
Market Trends, Drivers, Restraints, Competitive Analysis, Player Profiling, Covid-19 Analysis, Regulation Analysis |
Point Of Sale (POS) Market Insights
Expanded needs in advances, for example, end-to-end encryption for giving verified payment solutions and accommodation to clients, are required to enlarge the need for such terminals throughout the following couple of years. Significant organizations in the business are concentrating more on programming inferable from expanded penetration of cell phones. Contactless payment is viewed as the most recent pattern in POS.
Such payment strategy works through NFC innovation, wherein the issued card has a special symbol, novel to contactless payments, and must be filtered utilizing a contactless reader. This renders the whole exchange secure and is done inside seconds. This innovation lessens the general exchange time as well as enhances accommodation of procurement of small goods. Nonetheless, requirement for government affirmations, strict tenets and directions, and rising information security concerns are relied upon to go about as limitations to market development.
The business has seen a huge turnaround, owing to considerable and quick innovative improvements in POS terminal solutions. Developing need for contactless payments, alongside multiplication of Near Field Communication (NFC) gadgets in the industrial ecosystem, has prompted an increase in reception of coordinated POS terminals.
Resistance to the Payment Card Industry Data Security Standards (PCI DSS) expands the likelihood of card data breaches, which could adversely affect client trust and notoriety of the delegates. Be that as it may, solutions, for example, Omni shield Assure, are being created to secure card data through Point-to-Point Encryption (P2PE). This diminishes the risk of money related break and limits the weight of PCI consistence.
South-East Asia is one of the fastest growing smartphones markets. This leaves a plenty of room for the low-cost mPOS devices which allow merchants to access the telecom networks without requiring the need of fixed-line connection. Using mPOS, any phone or a tablet can become a POS terminal and the only other requirements are an application and an account with the acquirer or a payment facilitator.
Point Of Sale (POS) Market Segmentation
The worldwide market for point of sale (POS) is split based on product, component, deployment, operating system, applications, and geography.
Point-Of-Sale (POS) Market By Products
- Fixed
- Mobile
According to point of sale industry analysis, the fixed segment holds prominence due to its widespread use in brick-and-mortar establishments such as restaurants, retail stores, and supermarkets. These systems offer robust features, including comprehensive inventory management, advanced payment processing, and integration with other business operations like accounting and customer relationship management (CRM). Their reliability, ease of use, and capacity to handle large transaction volumes make them ideal for businesses with high traffic and complex needs. While mobile POS systems are gaining popularity, the fixed POS remains a trusted and efficient solution for larger enterprises requiring stability and durability.
Point-Of-Sale (POS) Market By Components
- Hardware
- Software
- Services
The point of sale market is primarily driven by the hardware component, which includes devices like barcode scanners, cash drawers, printers, and terminals. These devices are crucial for capturing sales data, processing payments, and managing inventory. Hardware advancements, such as the integration of touchscreen technology and wireless connectivity, have significantly enhanced the efficiency and user-friendliness of POS systems. Additionally, the growing demand for mobile POS solutions, which enable businesses to accept payments on the go, has further fueled the growth of the hardware segment.
Point-Of-Sale (POS) Market By Deployments
- On-Premise
- Cloud
The deployment of point of sale (POS) systems is increasingly shifting towards cloud-based solutions. This trend is driven by several factors, including lower upfront costs, enhanced scalability, and improved accessibility. Cloud-based POS systems offer businesses the flexibility to access their data and manage operations from anywhere with an internet connection. Additionally, cloud providers often handle software updates and maintenance, reducing the administrative burden on businesses. The growing adoption of cloud-based POS solutions has made it a notable revenue-generating segment within the overall POS market.
Point-Of-Sale (POS) Market By Operating Systems
- Android
- Windows/Linux
- iOS
The operating system used in POS market plays a crucial role in determining their functionality and compatibility. While Android and iOS have gained traction in recent years, Windows and Linux remain the dominant operating systems in the POS market. Windows and Linux offer a wider range of POS software options and provide greater flexibility for customization and integration with other business systems. Their stability and reliability have made them the preferred choice for many businesses, especially those with complex operations or specific software requirements. The continued dominance of Windows and Linux in the POS market has made them a notable revenue-generating segment.
Point-Of-Sale (POS) Market By Applications
- Restaurant
- Hospitality
- Retail
- Warehouse
- Entertainment
- Others
The point of sale (POS) market is used across various industries, including restaurants, hospitality, retail, warehouse, entertainment, and others. Among these segments, retail is anticipated to be the largest, driven by the increasing number of brick-and-mortar stores and the growing demand for efficient point-of-sale solutions to manage sales, inventory, and customer data. Retailers of all sizes, from small boutiques to large department stores, rely on POS systems to streamline their operations and enhance customer satisfaction. The ability to process payments quickly, track sales data, and integrate with other business systems has made POS solutions an essential tool for retailers.
Point Of Sale (POS) Market Regional Outlook
North America
- U.S.
- Canada
Europe
- U.K.
- Germany
- France
- Spain
- Rest of Europe
Asia-Pacific
- India
- Japan
- China
- Australia
- South Korea
- Rest of Asia-Pacific
Latin America
- Brazil
- Mexico
- Rest of Latin America
The Middle East & Africa
- South Africa
- GCC Countries
- Rest of the Middle East & Africa (ME&A)

Point Of Sale (POS) Market Regional Analysis
Asia-Pacific is relied upon to rise as a rewarding business sector enlisting the most elevated CAGR of 13% over the point of sale (POS) Market forecast period. Expanding income levels and better expectations for everyday comforts in creating nations, for example, India, are bringing about prospering retail showcases, accordingly boosting the interest product demand. Government activities in India to help a cashless economy are driving the market in this region. Low entrance and extensive unbanked populace in creating nations in APAC are likewise expected to give worthwhile development openings the market.
North America was the second-biggest region market in 2023. Expanding number of payment advances, for example, chip transaction, Near-field Communication (NFC), and contact less payments, has positively affected the region market. Furthermore, upgraded security, with the assistance of consistence necessities including directions from MasterCard, and Visa (EMV), Europay, has driven the product demand.
Point Of Sale (POS) Market Players
Some of the top point of sale (POS) companies offered in our report includes Block, Inc., Ingenico Group (Worldline), Lightspeed, NCR Corporation, Toast, Inc., Fujitsu Frontech Limited, HP Development Company, L.P., Nomia LLC, Oracle Corporation, and PAX Global Technology Limited.
Frequently Asked Questions
How big is the point of sale (POS) market?
The point of sale (POS) market size was valued at USD 28.2 Billion in 2023.
What is the CAGR of the global point of sale (POS) market from 2024 to 2032?
The CAGR of point of sale (POS) is 12.1% during the analysis period of 2024 to 2032.
Which are the key players in the point of sale (POS) market?
The key players operating in the global market are including Block, Inc., Ingenico Group (Worldline), Lightspeed, NCR Corporation, Toast, Inc., Fujitsu Frontech Limited, HP Development Company, L.P., Nomia LLC, Oracle Corporation, and PAX Global Technology Limited.
Which region dominated the global point of sale (POS) market share?
Asia-Pacific held the dominating position in point of sale (POS) industry during the analysis period of 2024 to 2032.
Which region registered fastest CAGR from 2024 to 2032?
Asia-Pacific region exhibited fastest growing CAGR for market of point of sale (POS) during the analysis period of 2024 to 2032.
What are the current trends and dynamics in the global point of sale (POS) industry?
The current trends and dynamics in the point of sale (POS) industry include increasing adoption of digital payment solutions, growth of e-commerce and retail sectors, rising demand for mobile and cloud-based POS systems, and enhanced data analytics capabilities for customer insights.
Which product held the maximum share in 2023?
The fixed held the notable share of the point of sale (POS) industry.


