Pharmaceutical Intermediates Market | Acumen Research and Consulting
Pharmaceutical Intermediates Market Size - Global Industry, Share, Analysis, Trends and Forecast 2023 - 2032
Published :
Report ID:
Pages :
Format :
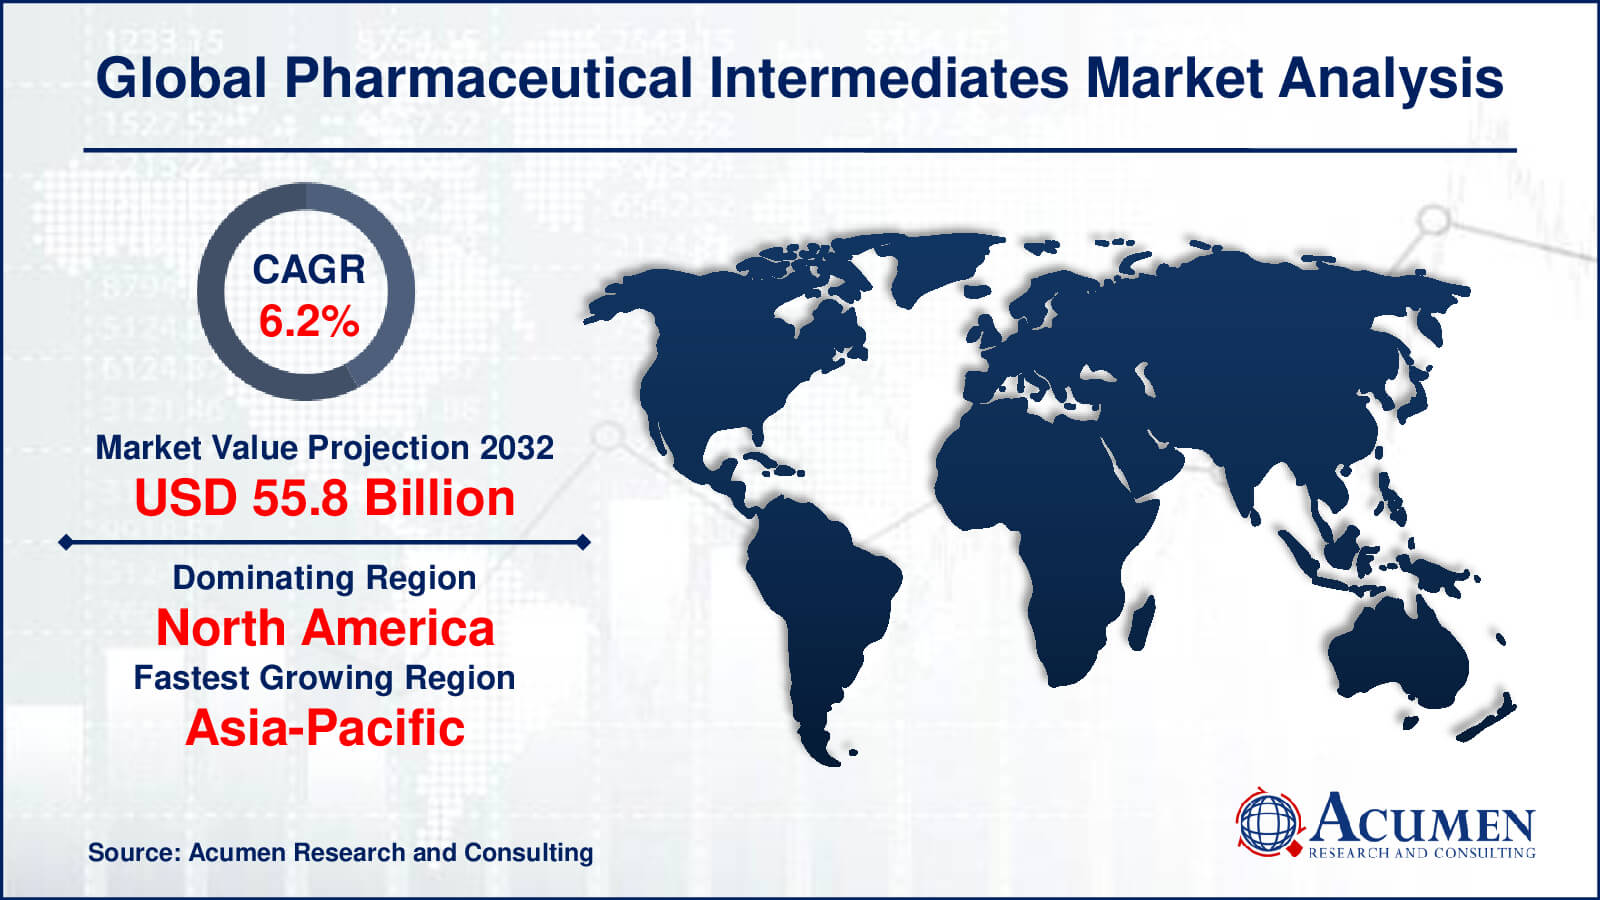
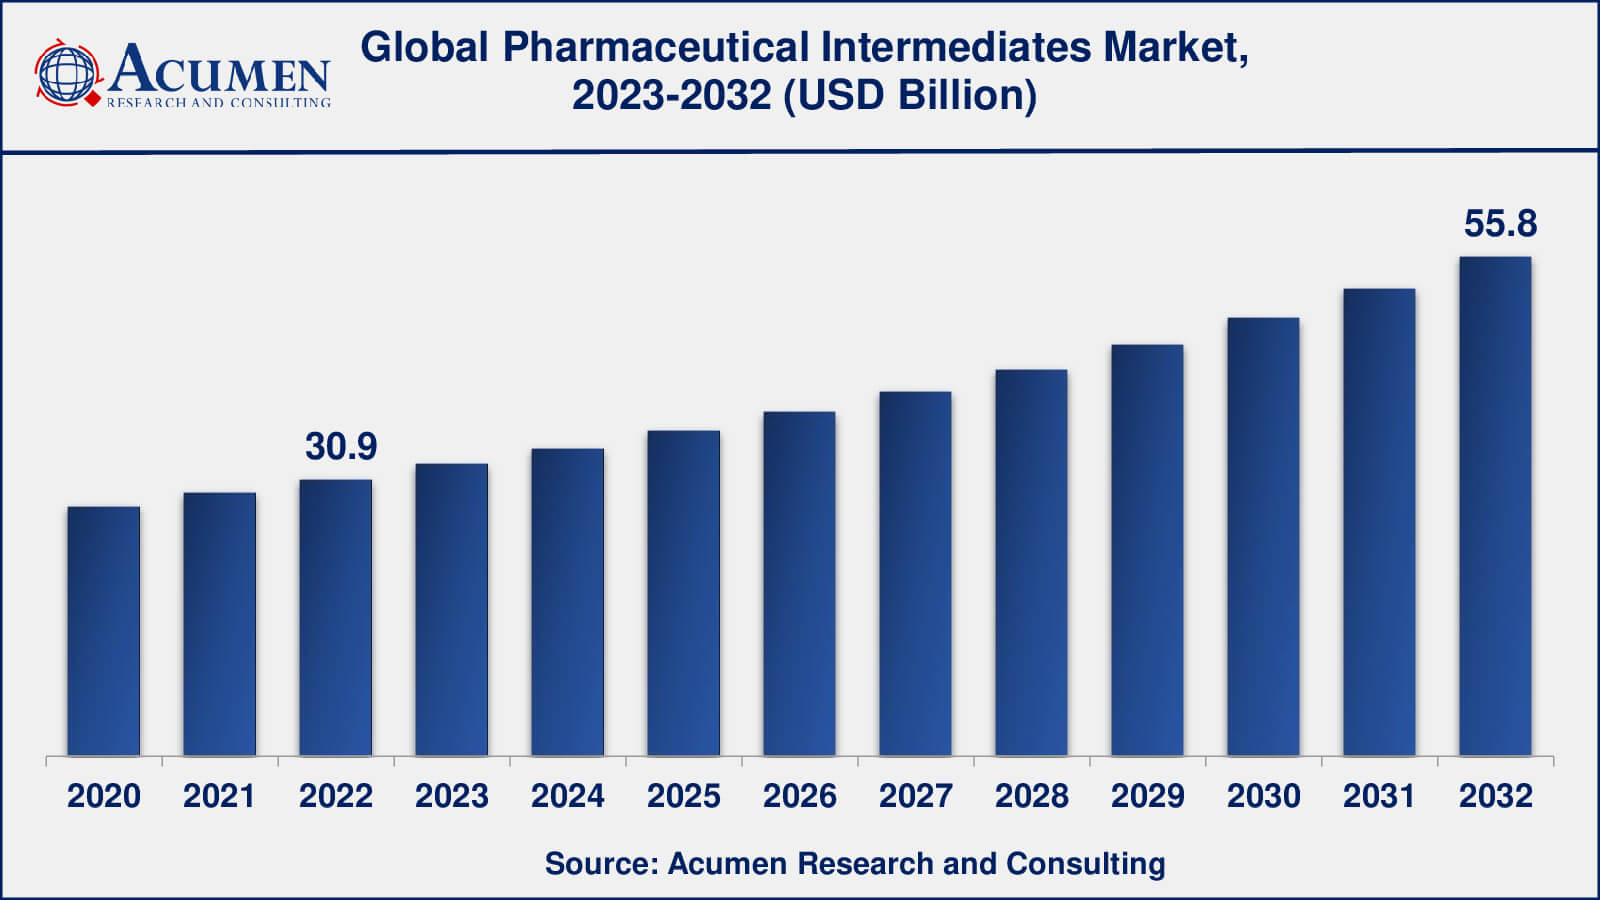
The Global Pharmaceutical Intermediates Market Size accounted for USD 30.9 Billion in 2022 and is estimated to achieve a market size of USD 55.8 Billion by 2032 growing at a CAGR of 6.2% from 2023 to 2032.
Pharmaceutical Intermediates Market Highlights
- Global pharmaceutical intermediates market revenue is poised to garner USD 55.8 billion by 2032 with a CAGR of 6.2% from 2023 to 2032
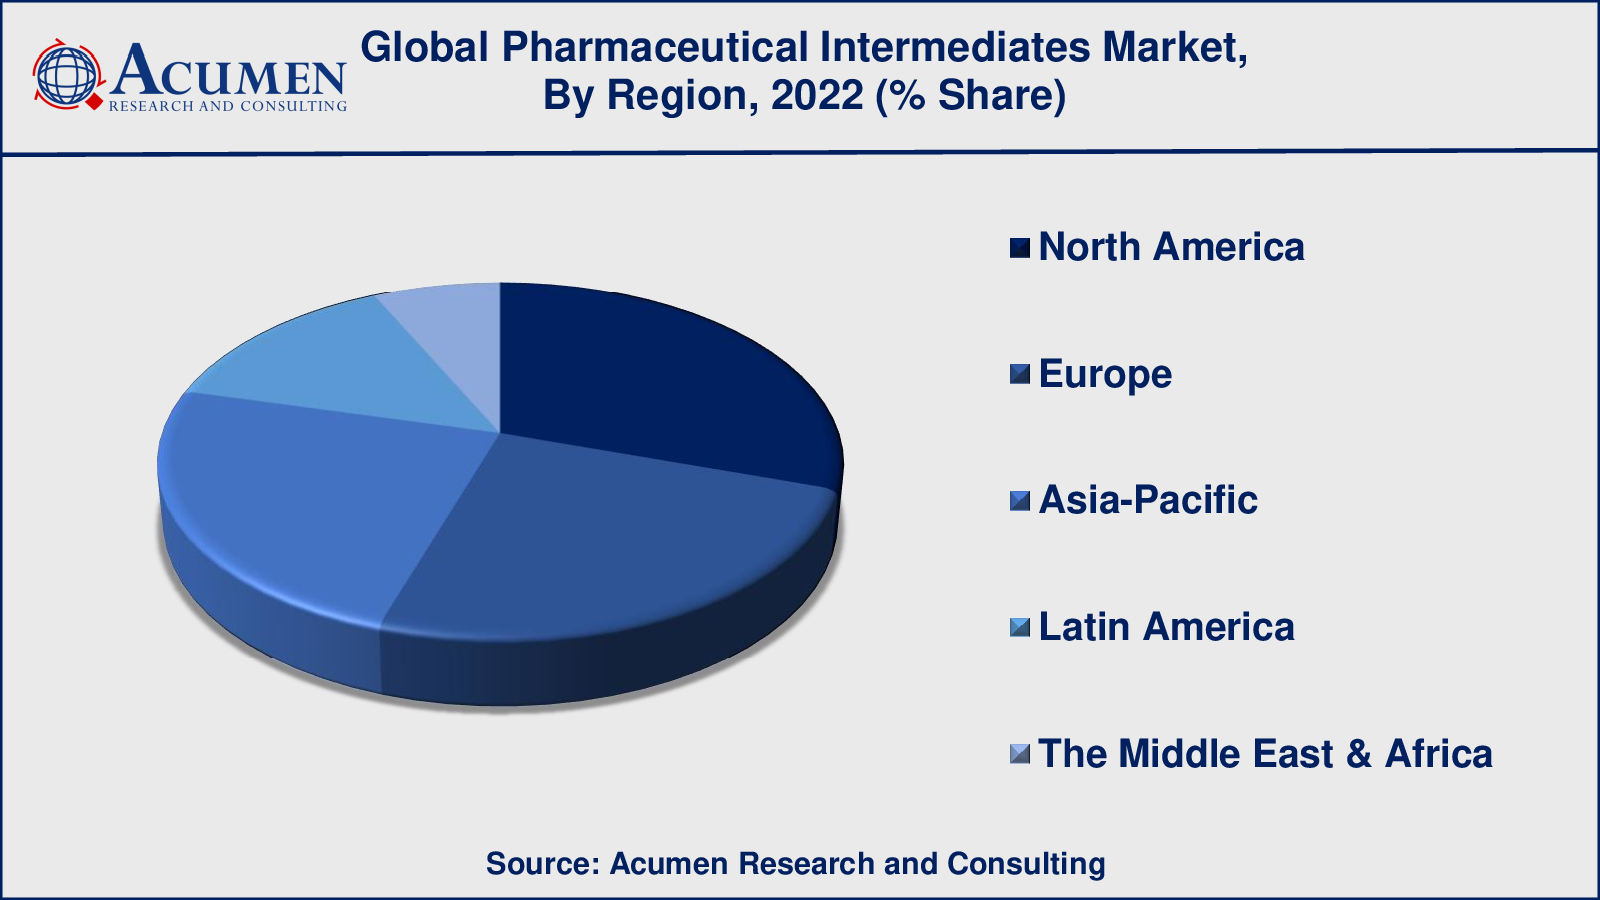
- North America pharmaceutical intermediates market value occupied more than USD 9.3 billion in 2022
- Asia-Pacific pharmaceutical intermediates market growth will record a CAGR of around 7% from 2023 to 2032
- Among type, the GMP sub-segment generated over US$ 18.5 billion revenue in 2022
- Based end-user, the packaging sub-segment generated around 40% share in 2022
- Growing popularity of personalized medicine is a popular pharmaceutical intermediates market trend that fuels the industry demand
Pharmaceutical intermediates are the chemical composites that are major ingredients exploited in the manufacturing of active pharmaceutical ingredients. Pharmaceutical intermediates are formed at the time of the process of production or synthesis of active pharmaceutical ingredients. These pharmaceutical intermediates later endure molecular changes and processing before becoming vigorous pharmaceutical ingredients.
Global Pharmaceutical Intermediates Market Dynamics
Market Drivers
- Increasing demand for generic drugs
- Growth in the pharmaceutical industry
- Surging investment in research and development
- Rising healthcare expenditure
Market Restraints
- Stringent regulations
- High capital investment
- Competition from low-cost countries
Market Opportunities
- Outsourcing of manufacturing
- Increasing demand for biotech-based intermediates
- Focus on innovation and research
Pharmaceutical Intermediates Market Report Coverage
| Market | Pharmaceutical Intermediates Market |
| Pharmaceutical Intermediates Market Size 2022 | USD 30.9 Billion |
| Pharmaceutical Intermediates Market Forecast 2032 | USD 55.8 Billion |
| Pharmaceutical Intermediates Market CAGR During 2023 - 2032 | 6.2% |
| Pharmaceutical Intermediates Market Analysis Period | 2020 - 2032 |
| Pharmaceutical Intermediates Market Base Year | 2022 |
| Pharmaceutical Intermediates Market Forecast Data | 2023 - 2032 |
| Segments Covered | By Type, By Structure Building Blocks, By End-User, And By Geography |
| Regional Scope | North America, Europe, Asia Pacific, Latin America, and Middle East & Africa |
| Key Companies Profiled | Aceto Corporation, A.R. Life Sciences Private Limited, BASF SE, Chemcon Speciality Chemicals Ltd. Midas Pharma GmbH, Codexis, Inc., Cycle Pharmaceuticals, Dextra Laboratories Ltd, Dishman Group, Easter Chemical Corporation, Pvt. Ltd., Lianhe Chemical Technology Co., Ltd., Sanofi Winthrop Industries, Vertellus Holdings LLC, and ZCL Chemical Ltd. |
| Report Coverage |
Market Trends, Drivers, Restraints, Competitive Analysis, Player Profiling, Covid-19 Analysis, Regulation Analysis |
Pharmaceutical Intermediates Market Insights
The pharmaceutical industry is one of the rapidly nurturing industries, globally. As pharmaceutical intermediates are the fundamental base part of active pharmaceutical ingredients (APIs), the market for API is also expected to witness an upsurge in demand in the foreseeable years. API market is very vigorous and in the last few years, there has been a drastic inclination in the direction of research and development activities. Owing to the growth in the R&D sector, the pharmaceutical intermediates market is projected to reflect drastic growth. However, rising monetary pressure as well as the regulatory obstruction is expected to freeze the growth of the pharmaceutical intermediates market.
Pharmaceutical Intermediates Market, By Segmentation
The worldwide market for pharmaceutical intermediates is split based on type, structure building blocks, end-user, and geography.
Pharmaceutical Intermediates Market, By Type
- GMP
- Non-GMP
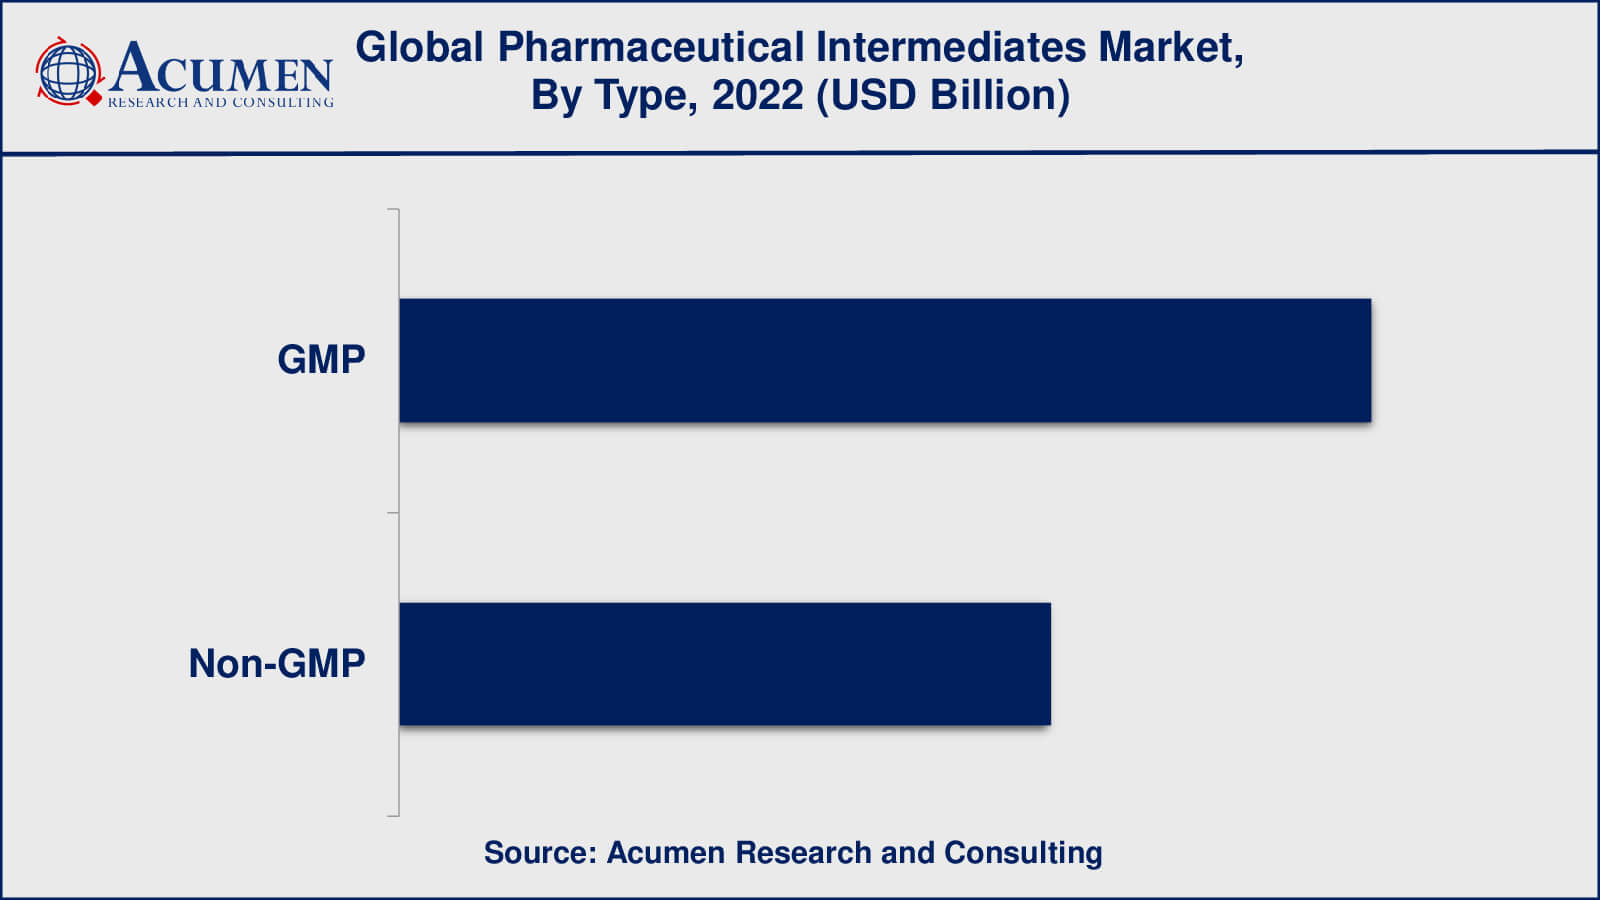
According to pharmaceutical intermediates industry analysis, GMP (good manufacturing practice) intermediates dominate the market. Before they are used in the production of final drug products, GMP intermediates are subjected to rigorous testing and inspection in accordance with strict quality standards. GMP intermediates ensure the final drug product's safety, efficacy, and quality and are required by regulatory agencies such as the FDA (Food and Drug Administration) in the United States.
Non-GMP (non-good manufacturing practise) intermediates, on the other hand, are produced without adhering to the same stringent quality standards and may not be subjected to the same level of testing and inspection as GMP intermediates. Non-GMP intermediates are frequently used in early-stage research and development and are not intended for use in the production of finished pharmaceutical products.
Pharmaceutical Intermediates Market, By Structure Building Blocks
- Achiral Building Blocks
- Chiral Building Blocks
Chiral building blocks will have a higher demand and a larger market share in 2022 than achiral building blocks. Chiral building blocks are organic compounds with an asymmetric carbon centre that exist in two mirror image enantiomeric forms. They are essential in the synthesis of chiral drugs, which have a specific 3D structure and are only active in one of the enantiomeric forms. Chiral building blocks are important in drug development because they are used to create the desired stereochemistry in the final drug molecule.
Achiral building blocks, on the other hand, are organic compounds that do not have an asymmetric carbon centre and exist as a single entity. They are used in the synthesis of a variety of medications and are typically used in the early stages of drug development. Achiral building blocks are used to construct the basic skeleton of the drug molecule and thus play an important role in the drug synthesis process.
Pharmaceutical Intermediates Market, By End-User
- Pharmaceutical Companies
- Contract Manufacturing Organizations (CMOs)
- Research Organizations
Pharmaceutical companies are expected to dominate the pharmaceutical intermediates market from 2023 to 2032, according to market forecasts. Pharmaceutical companies develop, manufacture, and market drugs, and they require a steady supply of pharmaceutical intermediates to support their operations. These intermediates are crucial for the synthesis of other chemical compounds, such as active pharmaceutical ingredients (APIs), which serve as the building blocks for pharmaceutical products.
Contract manufacturing organisations (CMOs) are important users of pharmaceutical intermediates. CMOs are third-party companies that provide pharmaceutical companies with manufacturing services and are in charge of producing APIs, pharmaceutical intermediates, and finished drug products,. Another end-user of pharmaceutical intermediates is research organisations.
These organisations work in drug discovery and development, and they require pharmaceutical intermediates for early-stage research and development. Pharmaceutical intermediates are typically required in small quantities by research organisations, and larger quantities may be contracted out to CMOs or pharmaceutical companies.
Pharmaceutical Intermediates Market Regional Outlook
North America
- U.S.
- Canada
Europe
- U.K.
- Germany
- France
- Spain
- Rest of Europe
Asia-Pacific
- India
- Japan
- China
- Australia
- South Korea
- Rest of Asia-Pacific
Latin America
- Brazil
- Mexico
- Rest of Latin America
The Middle East & Africa
- South Africa
- GCC Countries
- Rest of the Middle East & Africa (ME&A)
Pharmaceutical Intermediates Market Regional Analysis
A large number of pharmaceutical companies are present in North America, and there is a high demand for drugs, making it one of the largest markets for pharmaceutical intermediates. The United States is the largest market in North America, with growth fueled by a well-established pharmaceutical industry, rising demand for specialty drugs, and increased R&D investments.
Europe is another significant market for pharmaceutical intermediates, with the United Kingdom, Germany, and France leading the way. Increased demand for innovative drugs, increased awareness of personalized medicine, and increased investments in research and development are driving growth in Europe.
The Asia-Pacific region has the fastest-growing market for pharmaceutical intermediates, led by China, India, and Japan. The presence of a large number of contract manufacturing organizations, low labor costs, and increasing investments in research and development are driving growth in the region.
Pharmaceutical Intermediates Market Players
Some of the top pharmaceutical intermediates companies offered in the professional report include Aceto Corporation, A.R. Life Sciences Private Limited, BASF SE, Chemcon Speciality Chemicals Ltd. Midas Pharma GmbH, Codexis, Inc., Cycle Pharmaceuticals, Dextra Laboratories Ltd, Dishman Group, Easter Chemical Corporation, Pvt. Ltd., Lianhe Chemical Technology Co., Ltd., Sanofi Winthrop Industries, Vertellus Holdings LLC, and ZCL Chemical Ltd.
Frequently Asked Questions
What was the market size of the global pharmaceutical intermediates in 2022?
The market size of pharmaceutical intermediates was USD 30.9 Billion in 2022.
What is the CAGR of the global pharmaceutical intermediates market from 2023 to 2032?
The CAGR of pharmaceutical intermediates is 6.2% during the analysis period of 2023 to 2032.
Which are the key players in the pharmaceutical intermediates market?
The key players operating in the global market are including Aceto Corporation, A.R. Life Sciences Private Limited, BASF SE, Chemcon Speciality Chemicals Ltd. Midas Pharma GmbH, Codexis, Inc., Cycle Pharmaceuticals, Dextra Laboratories Ltd, Dishman Group, Easter Chemical Corporation, Pvt. Ltd., Lianhe Chemical Technology Co., Ltd., Sanofi Winthrop Industries, Vertellus Holdings LLC, and ZCL Chemical Ltd.
Which region dominated the global pharmaceutical intermediates market share?
North America held the dominating position in pharmaceutical intermediates industry during the analysis period of 2023 to 2032.
Which region registered fastest CAGR from 2023 to 2032?
Asia-Pacific region exhibited fastest growing CAGR for market of pharmaceutical intermediates during the analysis period of 2023 to 2032.
What are the current trends and dynamics in the global pharmaceutical intermediates industry?
The current trends and dynamics in the pharmaceutical intermediates industry include increasing demand for generic drugs, growth in the pharmaceutical industry, and surging investment in research and development.
Which type held the maximum share in 2022?
The GMP type held the maximum share of the pharmaceutical intermediates industry.?


