Pea Protein Market Size - Global Industry, Share, Analysis, Trends and Forecast 2024 - 2032
Published :
Report ID:
Pages :
Format :
Pea Protein Market Size - Global Industry, Share, Analysis, Trends and Forecast 2024 - 2032
Report Coverage
- Industry Dynamics
- Market Size and Forecast Data
- Segment Analysis
- Competitive Landscape
- Regional Analysis with a Niche Focus on Country-Level Data
- High Level Analysis - Porter's, PESTEL, Value Chain, etc.
- Company Profiles of Key Players
- Option to Customize the Report As Per Your Specific Need
Request Sample Report
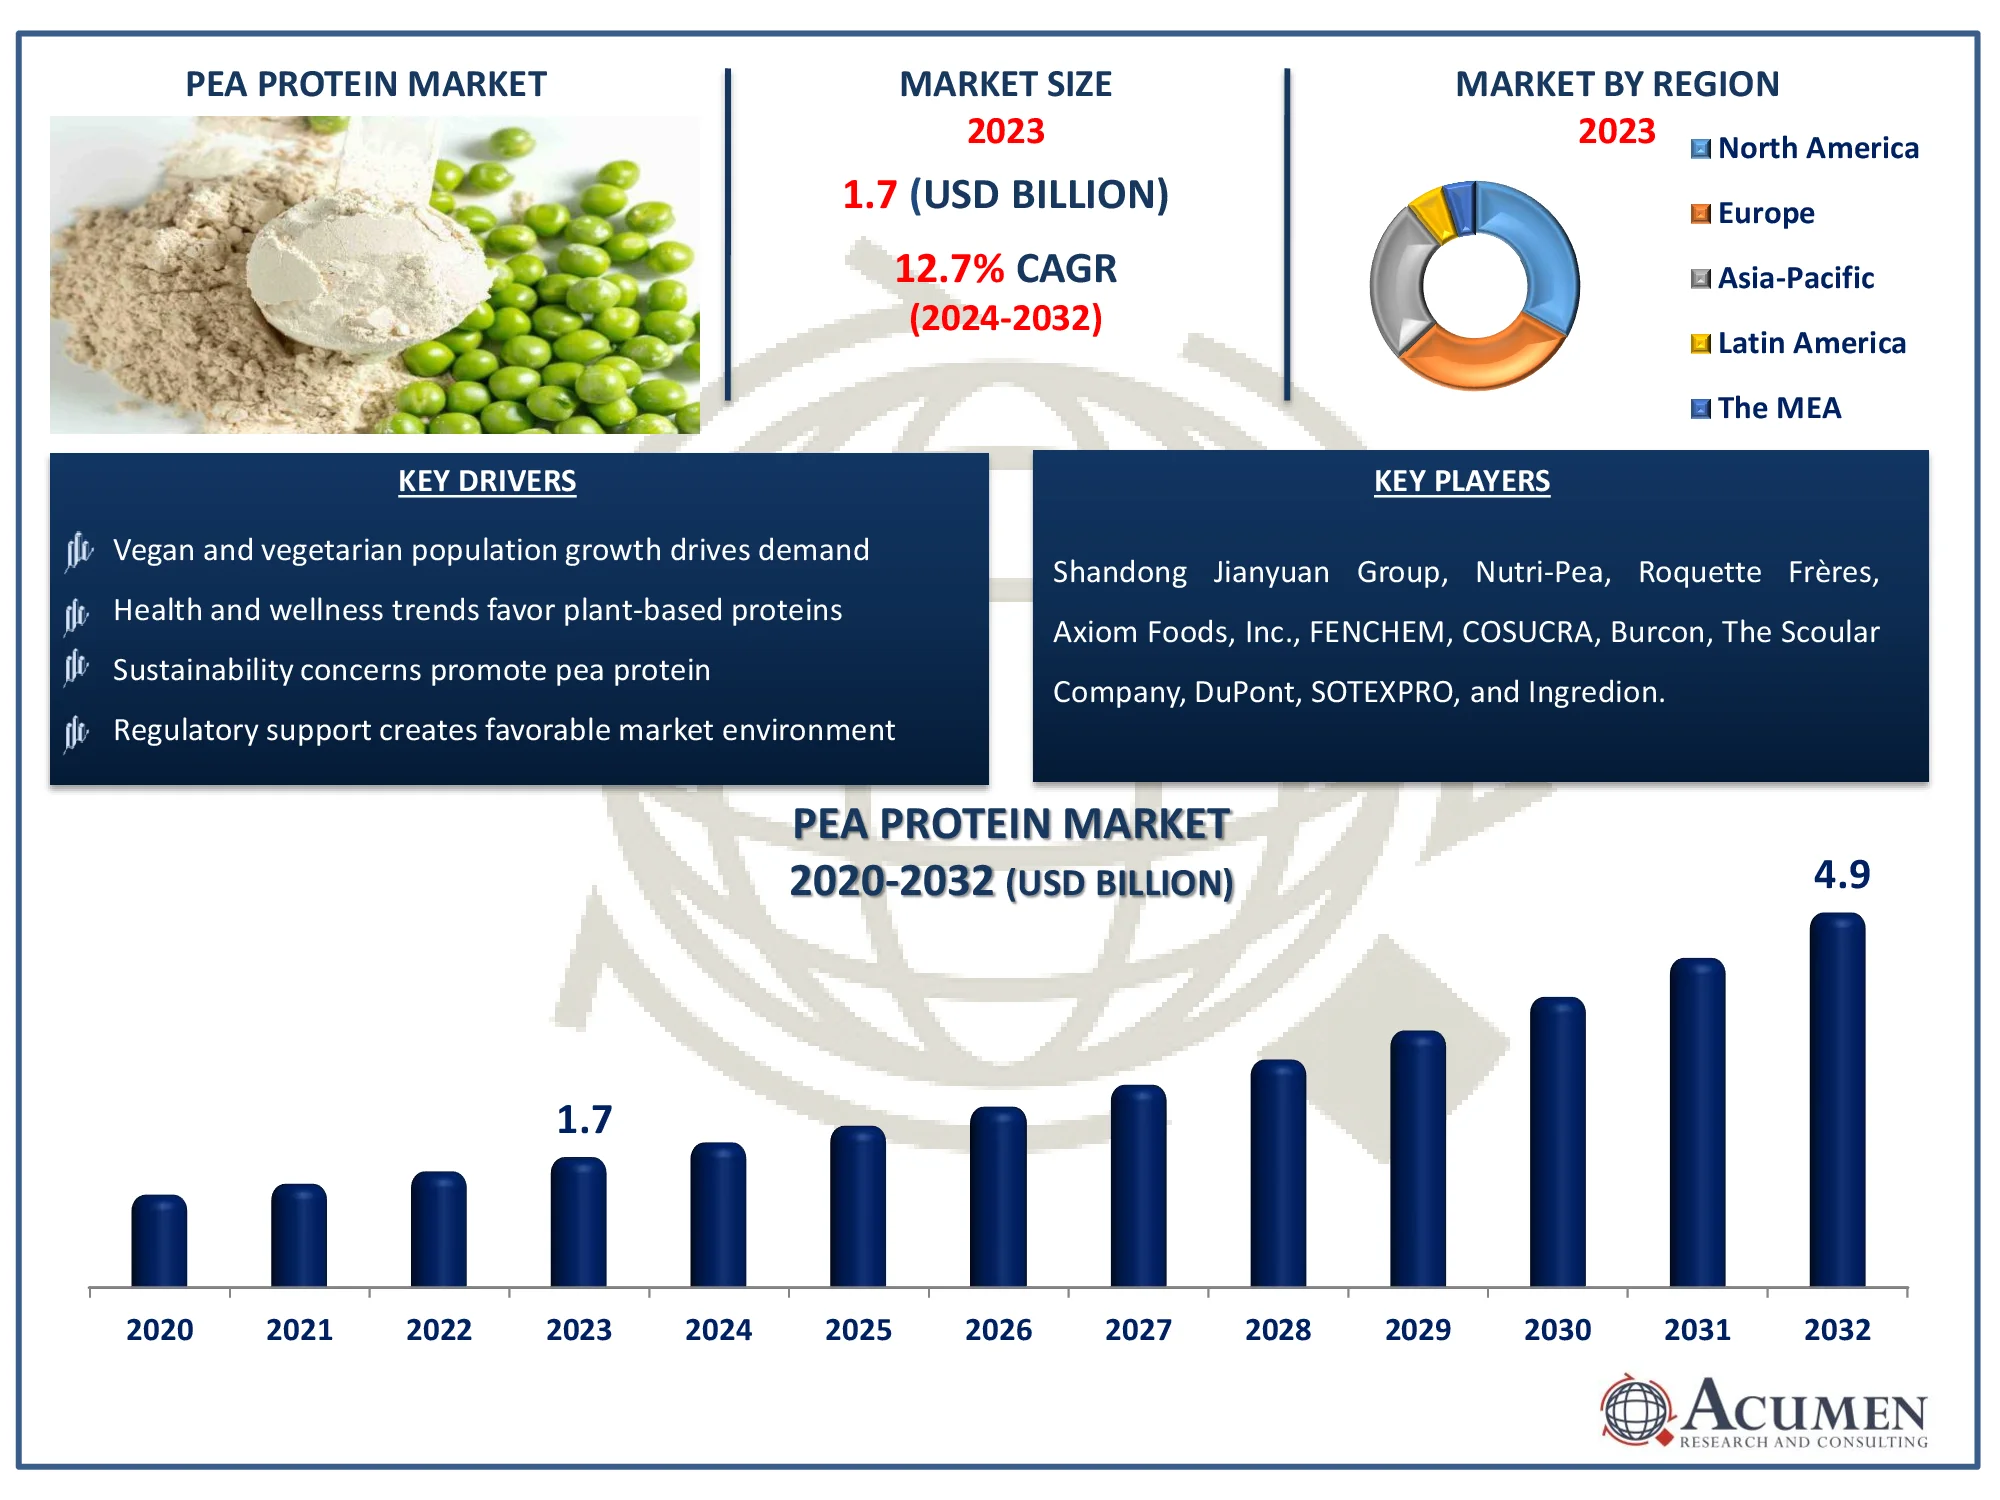
The Global Pea Protein Market Size accounted for USD 1.7 Billion in 2023 and is estimated to achieve a market size of USD 4.9 Billion by 2032 growing at a CAGR of 12.7% from 2024 to 2032.
Pea Protein Market Highlights
- Global pea protein market revenue is poised to garner USD 4.9 billion by 2032 with a CAGR of 12.7% from 2024 to 2032
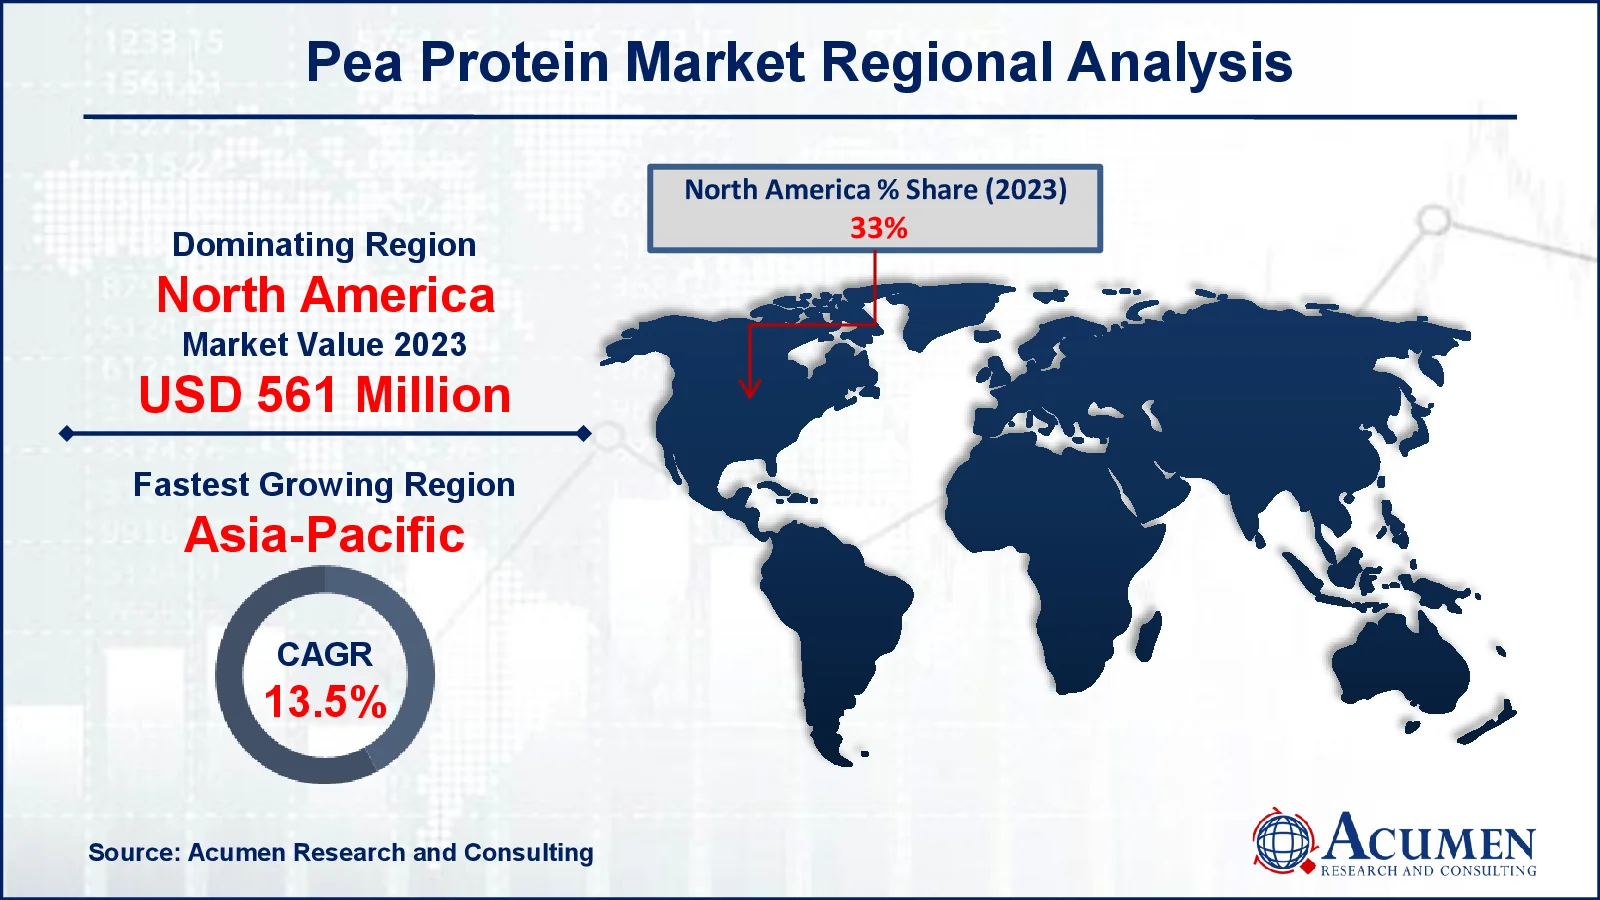
- North America pea protein market value occupied around USD 561 million in 2023
- Asia-Pacific pea protein market growth will record a CAGR of more than 13.5% from 2024 to 2032
- Among form, the dry sub-segment generated more than USD 1.02 million revenue in 2023
- Based on product, the isolates sub-segment generated around 49% pea protein market share in 2023
- Collaboration with food manufacturers fosters innovation is a popular pea protein market trend that fuels the industry demand

Pea protein is a plant-based protein made from yellow peas. It's a popular substitute for animal-based proteins like whey and casein, particularly among vegetarians and vegans. Pea protein is a complete protein, which means it contains all nine essential amino acids that the human body cannot manufacture on its own. Pea protein has become increasingly popular in recent years due to its nutritional value and adaptability. It is high in fiber, which can help with digestion and satiety. Furthermore, pea protein is low in fat and cholesterol, making it a heart-healthy option. Pea protein is commonly consumed as a dietary supplement in the form of powders, smoothies, and bars. It can also be used in a variety of food products, including plant-based meat alternatives, energy bars, and protein-packed snacks. Pea protein's neutral taste allows it to be easily included into a variety of dishes without altering the flavor.
Global Pea Protein Market Dynamics
Market Drivers
- Vegan and vegetarian population growth drives demand
- Health and wellness trends favor plant-based proteins
- Sustainability concerns promote pea protein
- Regulatory support creates favorable market environment
Market Restraints
- Allergenicity may limit consumption
- Cost can impact pricing
- Taste and texture may not be universally appealing
Market Opportunities
- Product diversification expands market reach
- Geographic expansion targets emerging markets
- Technological advancements improve product quality
Pea Protein Market Report Coverage
| Market | Pea Protein Market |
| Pea Protein Market Size 2022 |
USD 1.7 Billion |
| Pea Protein Market Forecast 2032 | USD 4.9 Billion |
| Pea Protein Market CAGR During 2023 - 2032 | 12.7% |
| Pea Protein Market Analysis Period | 2020 - 2032 |
| Pea Protein Market Base Year |
2022 |
| Pea Protein Market Forecast Data | 2023 - 2032 |
| Segments Covered | By Product, By Form, By Source, By Application, And By Geography |
| Regional Scope | North America, Europe, Asia Pacific, Latin America, and Middle East & Africa |
| Key Companies Profiled | Shandong Jianyuan Group, Nutri-Pea, Roquette Frères, Axiom Foods, Inc., FENCHEM, COSUCRA, Burcon, The Scoular Company, DuPont, SOTEXPRO, and Ingredion. |
| Report Coverage |
Market Trends, Drivers, Restraints, Competitive Analysis, Player Profiling, Covid-19 Analysis, Regulation Analysis |
Pea Protein Market Insights
Developing consumer preference towards veggie lover and vegetarian consumes less calories inferable from the high medical advantages, digestibility and anti-allergen properties of the product will impel the pea protein market development. These products are seeing expanding reception in meat substitutes, dietary supplements, beverages, bakery products, sports supplements and nutraceuticals. These products enable lower blood pressure, accomplish weight reduction, controls sugar, and limits kidney maladies, which ought to invigorate market development.
Pea protein isolates market size may observer noteworthy additions relating to its rich protein focus and adjusted amino corrosive profile. These products find broad use as texturizing operators in meat products by virtue of their astounding emulsification, high solubility and great water-restricting attributes. Developing product selection in processed meats, energy bars, beverages, and enhancements is probably going to further stimulate product demand.
Pea protein concentrates market estimate outperformed USD 1.7 billion in 2023. These products are appropriate for infant foods, ice creams, chocolates, baked products including bread, cake and oats relating to their phenomenal emulsification, oil and water maintenance and frothiness. Rising product demand for sports nutrition and weight management by virtue of their simple accessibility in powder form making its appropriate for gym freaks to benefit protein allow in their everyday lives, should support showcase development.
Pea Protein Market Segmentation
The worldwide market for pea protein is split based on product, form, source, application, and geography.
Pea Protein Products
- Isolates
- Hydrolysates
- Concentrates
- Textured pea proteins
According to pea protein industry analysis, the isolates section stood out as the top product category. Pea protein isolates are highly refined and have the highest protein concentration, typically surpassing 49%, making them an excellent choice for a variety of applications. Their neutral flavor, smooth texture, and improved solubility lead to their extensive use in protein shakes, nutritional supplements, and dairy substitutes. The increased demand for plant-based proteins, fueled by health-conscious customers and an increasing vegan population, has boosted the appeal of pea protein isolates. Their adaptability, along with a clean label appeal, makes them the preferred choice among manufacturers looking to deliver high-quality, protein-rich goods.
Pea Protein Forms
- Wet
- Dry
The dry form is prevalent. Dry pea protein, as opposed to wet pea protein, has a longer shelf life, is easier to handle, and can be easily integrated into a variety of food and beverage items. Dry pea protein's powdery form makes it a crucial ingredient in protein bars, snacks, and powdered supplements. Furthermore, its ability to integrate perfectly without affecting the texture or moisture content of the finished product makes it highly desirable to producers. Dry pea protein's versatility and convenience have helped it maintain its market leadership, catering to the growing consumer desire for plant-based protein sources.
Pea Protein Sources
- Yellow Split Peas
- Chickpeas
- Others
As per the pea protein market forecast, the yellow split peas are the most popular source throughout 2024 to 2032. Their popularity arises from their high protein content and practical advantages in processing. Yellow split peas are preferred because of their high protein concentration and low fiber level, which facilitates extraction and refining, resulting in a purer protein product. This efficiency results into lower production costs and more uniform finished ingredients. Furthermore, yellow split peas' mild flavor and light color blend smoothly into a wide range of food products, from plant-based milks to protein powders, without overpowering either taste or look. As a result of its broad use and desirable properties, yellow split peas are the most popular source of pea protein.
Pea Protein Applications
- Personal Care & Cosmetics
- Food & Beverages
- Meat Substitutes
- Bakery Goods
- Dietary Supplements
- Beverages
- Others
- Animal Feed
- Others
When it comes to applications in the pea protein market, the food & beverage industry dominates. This category leverages pea protein's adaptability and nutritional characteristics to improve a wide range of products. Pea protein is a functional component that fits the needs of health-conscious customers in a variety of applications, including protein-enriched snacks, plant-based dairy replacements, fortified beverages, and meat substitutes. Its ability to provide a clean, allergen-free protein supply complements the growing trend of plant-based diets and functional foods. As manufacturers strive to provide healthier and more sustainable options, the food & beverages industry's rising reliance on pea protein highlights its critical role in defining modern dietary habits.
Pea Protein Market Regional Outlook
North America
- U.S.
- Canada
Europe
- U.K.
- Germany
- France
- Spain
- Rest of Europe
Asia-Pacific
- India
- Japan
- China
- Australia
- South Korea
- Rest of Asia-Pacific
Latin America
- Brazil
- Mexico
- Rest of Latin America
The Middle East & Africa
- South Africa
- GCC Countries
- Rest of the Middle East & Africa (ME&A)

Pea Protein Market Regional Analysis
In terms of pea protein market analysis, the industry in North America is largest, owing to the growing popularity of plant-based diets and increased health awareness. The United States and Canada are major players, with a high demand for pea protein in protein supplements, meat replacements, and dairy substitutes. The region's well-established food and beverage industry, together with a growing preference for sustainable and allergen-free products, encourages the growth of pea protein applications.
The Asia-Pacific area has a growing interest in pea protein, owing to rising urbanization, rising disposable incomes, and a shift toward healthy eating patterns. Countries such as China and India are experiencing an increase in demand for plant-based protein, notably in the food and beverage industries. The region's rich culinary scene, as well as its growing vegetarian population, helps to drive pea protein consumption.
Pea Protein Market Players
Some of the top pea protein companies offered in our report include Shandong Jianyuan Group, Nutri-Pea, Roquette Frères, Axiom Foods, Inc., FENCHEM, COSUCRA, Burcon, The Scoular Company, DuPont, SOTEXPRO, and Ingredion.
Frequently Asked Questions
How big is the pea protein market?
The pea protein market size was valued at USD 1.7 billion in 2023.
What is the CAGR of the global pea protein market from 2024 to 2032?
The CAGR of pea protein is 12.7% during the analysis period of 2024 to 2032.
Which are the key players in the pea protein market?
The key players operating in the global market are including Shandong Jianyuan Group, Nutri-Pea, Roquette Frères, Axiom Foods, Inc., FENCHEM, COSUCRA, Burcon, The Scoular Company, DuPont, SOTEXPRO, and Ingredion.
Which region dominated the global pea protein market share?
North America held the dominating position in pea protein industry during the analysis period of 2024 to 2032.
Which region registered fastest CAGR from 2024 to 2032?
Asia-Pacific region exhibited fastest growing CAGR for market of pea protein during the analysis period of 2024 to 2032.
What are the current trends and dynamics in the global Pea Protein industry?
The current trends and dynamics in the pea protein industry include vegan and vegetarian population, health and wellness trends favor plant-based proteins, sustainability concerns promote pea protein, and regulatory support creates favorable market environment.
Which form held the maximum share in 2023?
The dry form held the maximum share of the pea protein industry.


