Oil Spill Dispersants Market | Acumen Research and Consulting
Oil Spill Dispersants Market Size - Global Industry, Share, Analysis, Trends and Forecast 2024 - 2032
Published :
Report ID:
Pages :
Format :
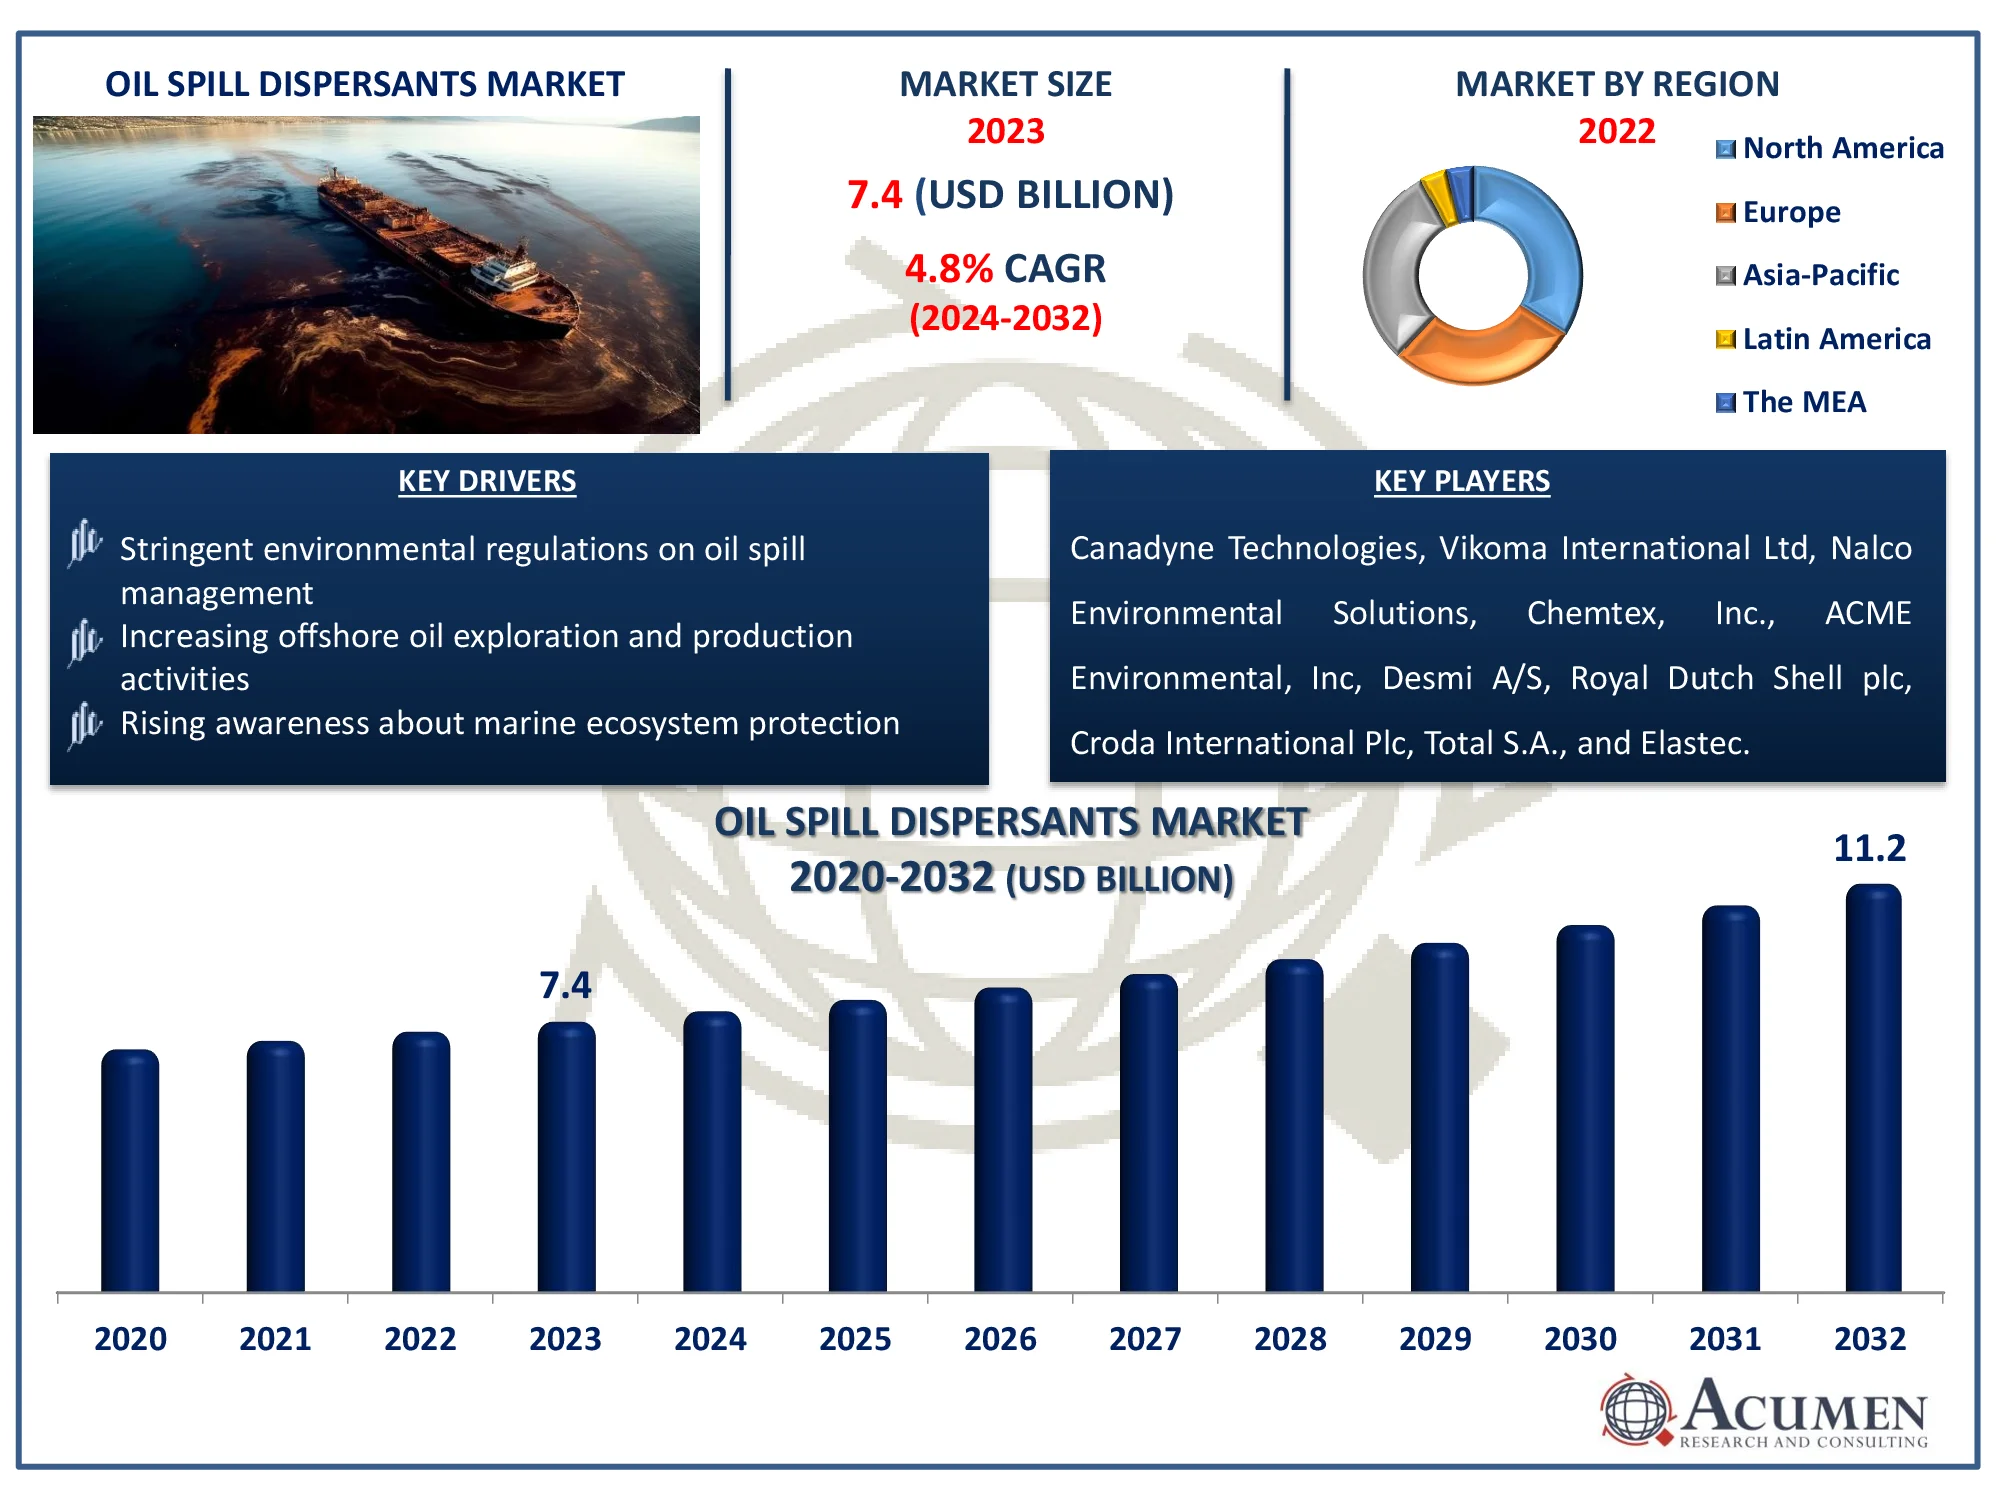
The Global Oil Spill Dispersants Market Size accounted for USD 7.4 Billion in 2023 and is estimated to achieve a market size of USD 11.2 Billion by 2032 growing at a CAGR of 4.8% from 2024 to 2032.
Oil Spill Dispersants Market (By Type: Chemical Dispersants, Biodispersant, and Others; By Application: Onshore, Offshore; By End-use Industry: Oil & Gas Industry, Marine Industry, Chemical Industry, Shipping Industry, and Others and By Region: North America, Europe, Asia-Pacific, Latin America, and MEA)
Oil Spill Dispersants Market Highlights
- The global oil spill dispersants market is anticipated to reach USD 11.2 billion by 2032, growing at a CAGR of 4.8% from 2024 to 2032
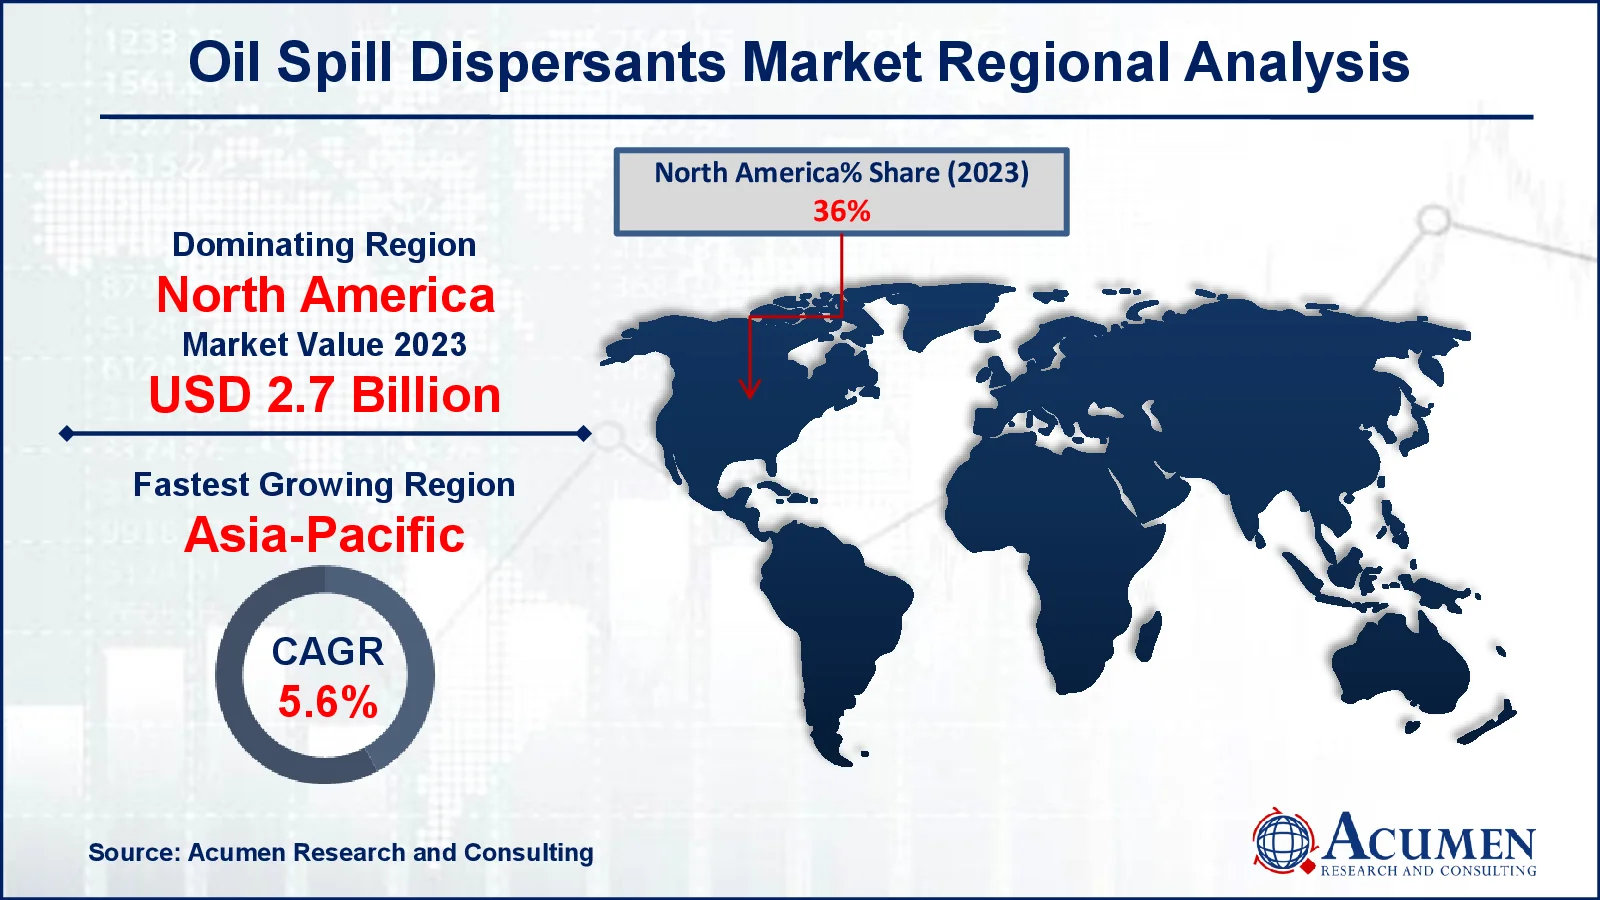
- In 2023, the North American oil spill dispersants market was valued at approximately USD 2.7 billion
- The Asia-Pacific region is projected to grow at a CAGR of over 5.6% from 2024 to 2032
- The chemical dispersants type represented notable growth in 2023
- The offshore application sub-segment captured 69% of the market share in 2023
- Increased oil drilling, shipping, and transportation activities is the oil spill dispersants market trend that fuels the industry demand

Oil spill is a general term used for oil contamination of the sea, soil, or land, as well as its accidental or deliberate release. Oil sources are located all over the world and are drilled both onshore and offshore. Oil is a significant source of energy, so it must be distributed and shipped consistently. Oil is primarily delivered via marine boats and land pipelines. The vessels are moved to ships for transit, and tankers rupture or boil on land, the majority of which occur after crashes. Small oil spills occur frequently and can be readily and quickly controlled.
Global Oil Spill Dispersants Market Dynamics
Market Drivers
- Stringent environmental regulations on oil spill management
- Increasing offshore oil exploration and production activities
- Rising awareness about marine ecosystem protection
Market Restraints
- Potential environmental toxicity of certain dispersants
- High cost of dispersant application in large-scale spills
- Public and regulatory concerns about chemical dispersant usage
Market Opportunities
- Development of eco-friendly, biodegradable dispersants
- Growth of oil exploration in emerging regions like Africa and Latin America
- Technological advancements in oil spill detection and response systems
Oil Spill Dispersants Market Report Coverage
| Market | Oil Spill Dispersants Market |
| Oil Spill Dispersants Market Size 2022 |
USD 7.4 Billion |
| Oil Spill Dispersants Market Forecast 2032 | USD 11.2 Billion |
| Oil Spill Dispersants Market CAGR During 2023 - 2032 | 4.8% |
| Oil Spill Dispersants Market Analysis Period | 2020 - 2032 |
| Oil Spill Dispersants Market Base Year |
2022 |
| Oil Spill Dispersants Market Forecast Data | 2023 - 2032 |
| Segments Covered | By Type, By Application, By End-Use Industry, And By Geography |
| Regional Scope | North America, Europe, Asia Pacific, Latin America, and Middle East & Africa |
| Key Companies Profiled | Canadyne Technologies, Vikoma International Ltd, Nalco Environmental Solutions, Desmi A/S, ACME Environmental, Inc., Royal Dutch Shell plc, Chemtex, Inc., Croda International Plc, Total S.A., and Elastec. |
| Report Coverage |
Market Trends, Drivers, Restraints, Competitive Analysis, Player Profiling, Covid-19 Analysis, Regulation Analysis |
Oil Spill Dispersants Market Insights
As governments, environmental agencies, and companies become more aware of the terrible impact oil spills have on aquatic life, the need for oil spill dispersants is increasing. This increased awareness has resulted in stronger laws and demands for faster, more effective spill response tactics, such as the use of dispersants to minimize damage. As public concern develops, companies are under pressure to use dispersants that not only mitigate the visual consequences of oil spills but also limit long-term environmental damage. This trend is driving up demand for innovative, eco-friendly dispersion solutions.
Global oil spills are expected to cost up to 11.2 billion by 2032, owing to their frequency and the critical role of decreasing the environmental consequences of oil spills. Such dispersants are successful when utilized in consistent weather; as high tides diminish disperse efficiency. The constraints of oil spill distributors are the primary issues limiting the global market for oil spills.
The development of environmentally friendly, biodegradable dispersants represents a potential opportunity for the oil spill dispersants market, as companies and regulators seek safer, more sustainable alternatives to traditional chemical dispersants. For instance, in July 2022, Evonik introduced their new sustainable dispersing additive, TEGO Dispers 658. The TEGO dispersion agent is easily biodegradable, enhancing the sustainability of pigment and colored coatings manufacturing while providing formulators with a high-performance profile equivalent to other Evonik products. These green dispersants provide excellent spill management while decreasing environmental toxicity, which appeals to environmentally sensitive stakeholders. As worldwide marine protection legislation tightens, demand for biodegradable choices grows, allowing companies that innovate in this field to gain a larger portion of the market.
Oil Spill Dispersants Market Segmentation
The worldwide market for oil spill dispersants is split based on type, application, end-use industry, and geography.
Oil Spill Dispersant Market By Type
- Chemical Dispersants
- Biodispersant
- Other
According to the oil spill dispersants industry analysis, chemical dispersants expected to seen highest growth in the industry due to their demonstrated effectiveness in breaking down oil into smaller droplets, hence promoting natural biodegradation. Their widespread use stems from the requirement for rapid reaction to large-scale oil spills, particularly in offshore environments where other approaches may be unfeasible. Despite environmental concerns, chemical dispersants remain the preferred method due to their proven effectiveness in reducing surface slicks and harm to coastal ecosystems.
Oil Spill Dispersant Market By Application
- Onshore
- Offshore
In 2023, the market share of offshore oil dispersant applications for the application sector exceeded 69%. Similarly, the onshore application industry is expected to increase steadily as new onshore oil sources are discovered and oil spills occur frequently during transportation or drilling. Onshore petroleum production is expected to expand in the next years. The demand for oil spill dispersants in onshore spill sites is expected to rise further.
Oil Spill Dispersant Market By End-use Industry
- Oil & Gas Industry
- Marine Industry
- Chemical Industry
- Shipping Industry
- Others
According to the oil spill dispersants market forecast, the oil and gas industry is predicted to have the most growth in the market, owing to increased offshore exploration and production operations, particularly in deepwater locations. As drilling develops in environmentally sensitive locations, the risk of spills increases, fueling need for effective spill management solutions. Stricter regulatory frameworks and environmental requirements also require oil and gas corporations to use dispersants as part of their emergency response plans.
Oil Spill Dispersants Market Regional Outlook
North America
- U.S.
- Canada
Europe
- U.K.
- Germany
- France
- Spain
- Rest of Europe
Asia-Pacific
- India
- Japan
- China
- Australia
- South Korea
- Rest of Asia-Pacific
Latin America
- Brazil
- Mexico
- Rest of Latin America
The Middle East & Africa
- South Africa
- GCC Countries
- Rest of the Middle East & Africa (ME&A)

Oil Spill Dispersants Market Regional Analysis
For several reasons, North America dominates oil spill dispersant industry, owing mostly to the region's considerable offshore oil exploration activity, particularly in the Gulf of Mexico. The United States has strict environmental standards and well-established spill response structures, which require the use of dispersants in spill management. For instance, according to United States Environmental Protection Agency, together with Canada and France, the United States successfully petitioned the International Maritime Organization to define the North American Emission Control Area for both fuel sulfur limitations and engine NOX emission requirements. In early 2024, the United States joined a group of like-minded countries in submitting a paper to MEPC's 81st session, expressing concern that the MARPOL Annex VI NOX emission control program, specifically the ECA NOX requirements, is failing to achieve the expected reductions in air pollution from marine diesel engines. Furthermore, the frequency of oil spills and the presence of oil firms in the region drive up demand for dispersants.
Asia Pacific expected to shows highest growth in oil spill market, owing to increased demand for oil in the region and increased pressure on oil corporations to explore existing and new offshore and onshore oil reserves. These explorations are expected to include mishaps caused by technological or equipment failures or human error.
The Middle East and Africa, like the Asia-Pacific area, account for a significant percentage of world oil demand. Global financial, corporate, and policy pressures on oil output and demand will undoubtedly drive petroleum corporations to take risks in seeking new petroleum sources.
Oil Spill Dispersants Market Players
Some of the top oil spill dispersants companies offered in our report includes Canadyne Technologies, Vikoma International Ltd, Nalco Environmental Solutions, Desmi A/S, ACME Environmental, Inc, Royal Dutch Shell plc, Chemtex, Inc., Croda International Plc, Total S.A., and Elastec.
Frequently Asked Questions
How big is the oil spill dispersants market?
The oil spill dispersants market size was valued at USD 7.4 billion in 2023.
What is the CAGR of the global oil spill dispersants market from 2024 to 2032?
The CAGR of oil spill dispersants is 4.8% during the analysis period of 2024 to 2032.
Which are the key players in the oil spill dispersants market?
The key players operating in the global market are including Canadyne Technologies, Vikoma International Ltd, Nalco Environmental Solutions, Desmi A/S, ACME Environmental, Inc, Royal Dutch Shell plc, Chemtex, Inc., Croda International Plc, Total S.A., and Elastec
Which region dominated the global oil spill dispersants market share?
North America held the dominating position in oil spill dispersants industry during the analysis period of 2024 to 2032.
Which region registered fastest CAGR from 2024 to 2032?
Asia-Pacific region exhibited fastest growing CAGR for market of oil spill dispersants during the analysis period of 2024 to 2032.
What are the current trends and dynamics in the global oil spill dispersants industry?
The current trends and dynamics in the oil spill dispersants industry include stringent environmental regulations on oil spill management, increasing offshore oil exploration and production activities, and rising awareness about marine ecosystem protection.
Which application held the maximum share in 2023?
The offshore application held the maximum share of the oil spill dispersants industry.


