Oil & Gas Catalyst Market Size - Global Industry, Share, Analysis, Trends and Forecast 2023 - 2032
Published :
Report ID:
Pages :
Format :
Oil & Gas Catalyst Market Size - Global Industry, Share, Analysis, Trends and Forecast 2023 - 2032
Report Coverage
- Industry Dynamics
- Market Size and Forecast Data
- Segment Analysis
- Competitive Landscape
- Regional Analysis with a Niche Focus on Country-Level Data
- High Level Analysis - Porter's, PESTEL, Value Chain, etc.
- Company Profiles of Key Players
- Option to Customize the Report As Per Your Specific Need
Request Sample Report
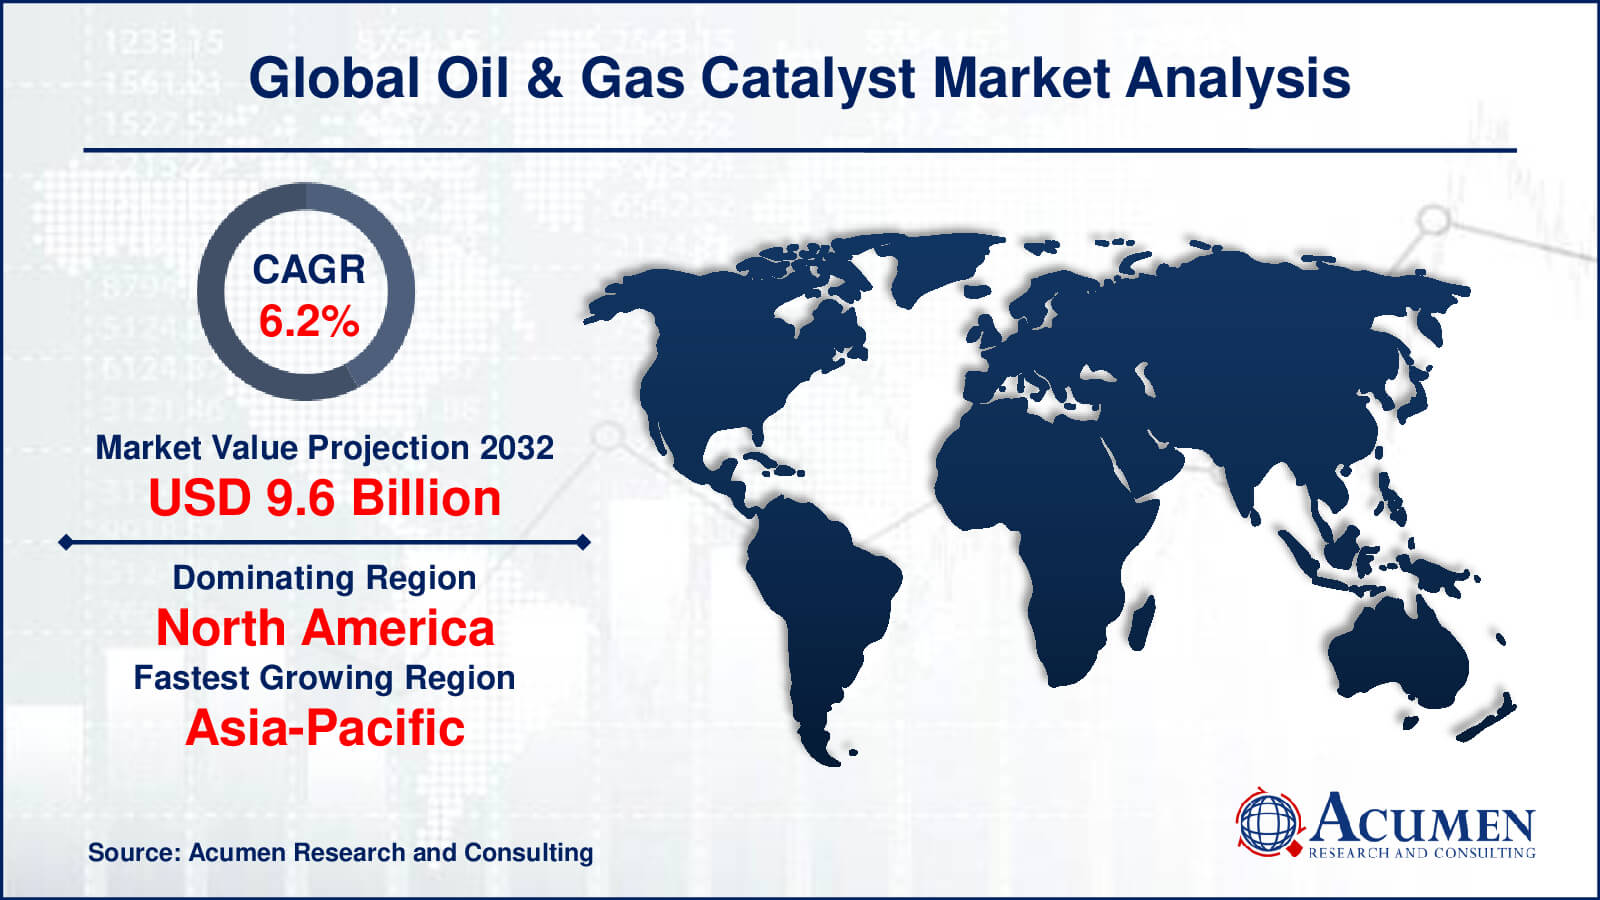
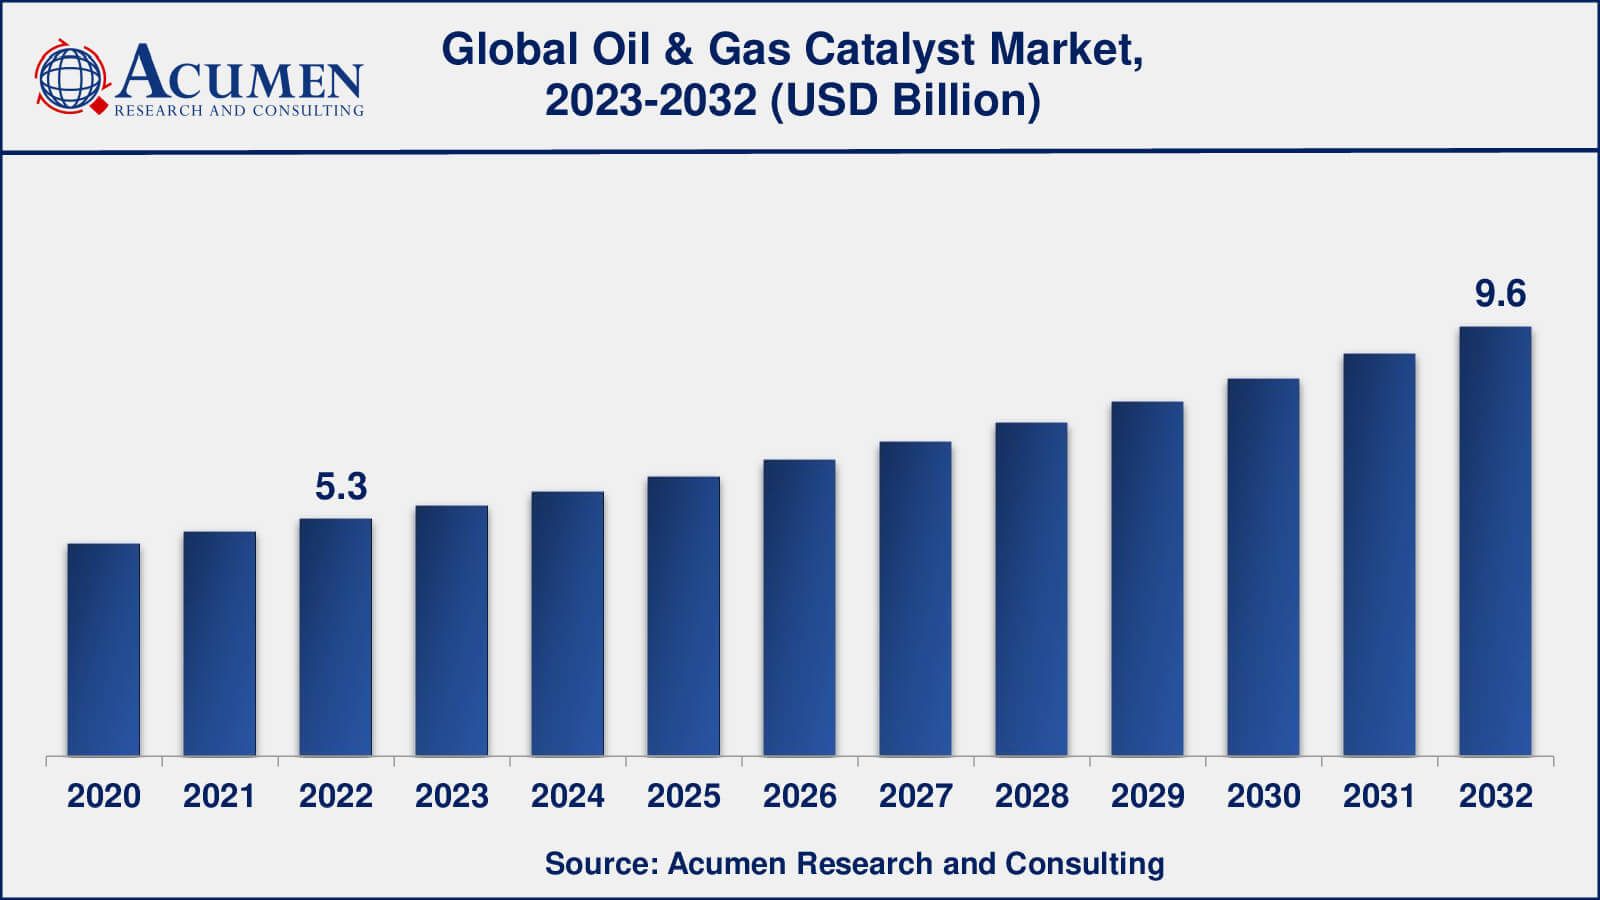
The Global Oil & Gas Catalyst Market Size accounted for USD 5.3 Billion in 2022 and is estimated to achieve a market size of USD 9.6 Billion by 2032 growing at a CAGR of 6.2% from 2023 to 2032.
Oil & Gas Catalyst Market Highlights
- Global oil & gas catalyst market revenue is poised to garner USD 9.6 billion by 2032 with a CAGR of 6.2% from 2023 to 2032
- North America oil & gas catalyst market value occupied almost USD 1.6 billion in 2022
- Asia-Pacific oil & gas catalyst market growth will record a CAGR of over 7% from 2023 to 2032
- Among type, the transition metals sub-segment generated over US$ 1.9 billion revenue in 2022
- Based on application, the hydro processing sub-segment generated around 36% share in 2022
- Advancements in catalyst technology is a popular oil & gas catalyst market trend that fuels the industry demand
Catalysts are chemicals used as additives to boost a chemical reaction. These catalysts do not undergo any transformations during the chemical reaction. They are differentiated based on their phase and the phase of reactants. Oil and gas catalysts are categorized on the basis of the processes for which they are used. Oil & gas catalysts find several applications in various end-use industries such as petrochemicals, refineries, foods, and chemicals among others. With the growth in demand for economical technologies, oil & gas catalysts play a crucial role in the refinery of petroleum and its applications. Furthermore, several major refinery procedures such as hydroprocessing, cracking, and reforming demand the presence of oil & gas catalysts.
Global Oil & Gas Catalyst Market Dynamics
Market Drivers
- Growing demand for energy
- Increasing demand for cleaner fuels
- Rising demand for petrochemicals
Market Restraints
- Volatility in oil and gas prices
- High cost of catalysts
Market Opportunities
- Investments in refinery modernization and capacity expansion
- Focus on sustainable catalyst technologies
- Expansion of oil and gas exploration and production activities
Oil & Gas Catalyst Market Report Coverage
| Market | Oil & Gas Catalyst Market |
| Oil & Gas Catalyst Market Size 2022 | USD 5.3 Billion |
| Oil & Gas Catalyst Market Forecast 2032 | USD 9.6 Billion |
| Oil & Gas Catalyst Market CAGR During 2023 - 2032 | 6.2% |
| Oil & Gas Catalyst Market Analysis Period | 2020 - 2032 |
| Oil & Gas Catalyst Market Base Year | 2022 |
| Oil & Gas Catalyst Market Forecast Data | 2023 - 2032 |
| Segments Covered | By Type, By Application, And By Geography |
| Regional Scope | North America, Europe, Asia Pacific, Latin America, and Middle East & Africa |
| Key Companies Profiled | Arkema SA, Albemarle Corporation, Exxon Mobil Chemical Corporation, The Dow Chemical Company, Evonik Industries, Clariant AG, Honeywell International, and Chevron Phillips Chemical Company among others. |
| Report Coverage |
Market Trends, Drivers, Restraints, Competitive Analysis, Player Profiling, Covid-19 Analysis, Regulation Analysis |
Oil & Gas Catalyst Market Insights
Growth in demand for energy fuels the growth of the global oil & gas catalysts market. The rapid demand for oil & gas catalysts at high temperatures in various fluid crackers to increase the octane score of gasoline is another key aspect fueling the growth of the market. In addition to this, an increase in research & development activities to enhance the quality of oil & gas catalysts also results in the rapid growth of the global oil & gas catalyst market. However, technological advancements in the synthesis of chemicals decrease the overall demand for catalysts, thus hampering market growth.
Oil & Gas Catalyst Market, By Segmentation
The worldwide market for oil & gas catalyst is split based on type, application, and geography.
Oil & Gas Catalyst Types
- Precious Metals
- Zeolites
- Transition Metals
- Rare Earth Metals
- Others
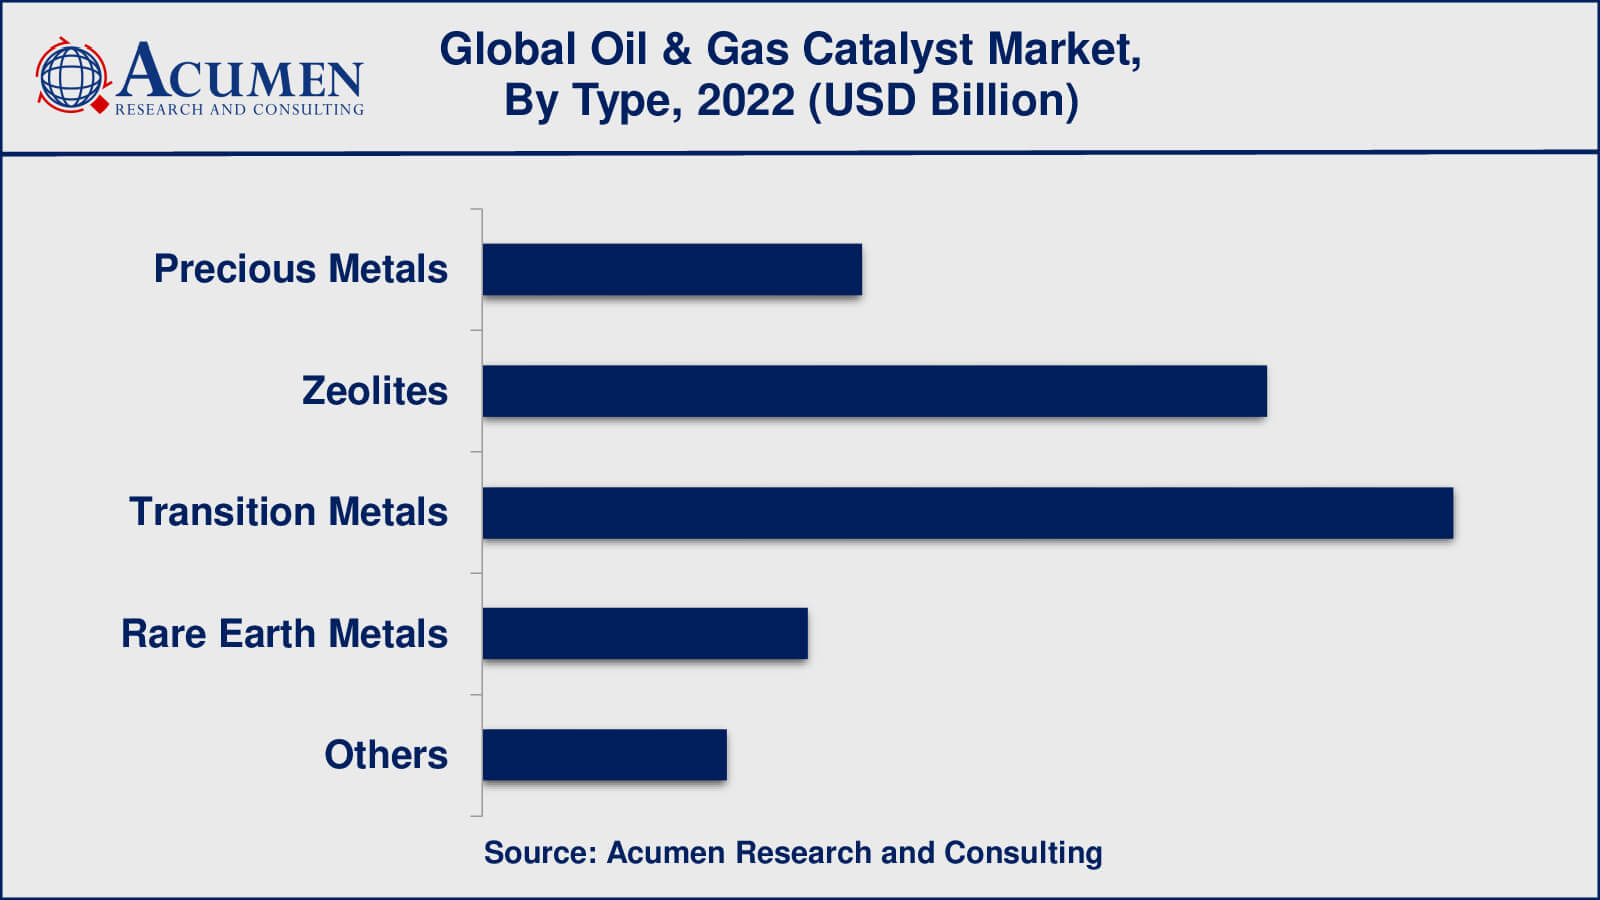
According to our oil & gas catalyst industry analysis, transition metals are likely to gain significat market share in 2022. Transition metals, such as nickel, cobalt, and iron, are known for their moderate to high catalytic activity and are widely used in various oil and gas catalyst applications. They are cost-effective and widely available, making them the most commonly used type of catalyst in the oil and gas industry.
Zeolites are crystalline aluminosilicate materials with a well-defined porous structure that provide high surface area and shape-selective properties, making them suitable for a variety of oil and gas catalyst applications. Zeolite catalysts, which are known for their high thermal stability and selectivity, are used in processes such as cracking, isomerization, and adsorption. Zeolite catalysts are less expensive than precious metal catalysts and may have a significant volume share in the oil and gas catalyst market.
Precious metals such as platinum, palladium, and gold are known for their high catalytic activity and are widely used in various oil and gas catalyst applications such as hydrocarbon conversion, hydrogenation, and oxidation processes. Because of their high selectivity, efficiency, and stability, precious metal catalysts are ideal for demanding and high-value processes. Precious metal catalysts, however, may not dominate the overall volume of catalysts used in the oil and gas industry due to their high cost and limited availability, but they may have a significant share in terms of value.
Oil & Gas Catalyst Applications
- Hydro Processing
- Hydrogen Production
- Fluid Catalytic Cracking
- Gas Processing
- Purification
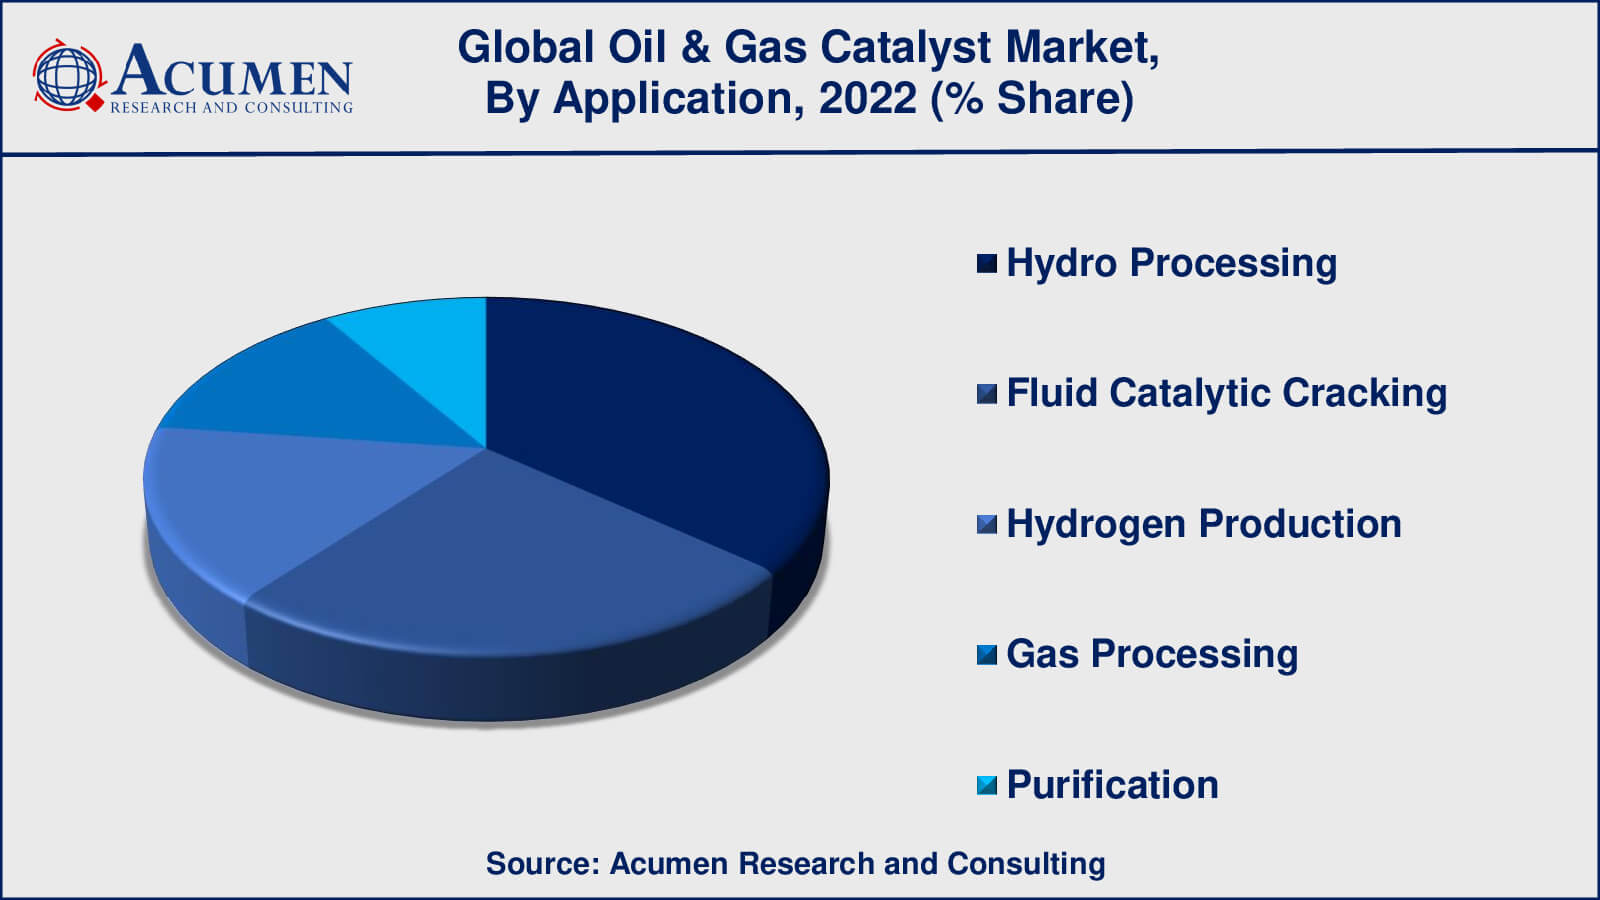
As per the oil & gas catalyst market forecast, hydro processing sub-segment is expected to occupy a noteworthy market share from 2023 to 2032. The primary application for oil and gas catalysts is hydro processing, which includes hydrocracking, hydrotreating, and hydrodesulfurization. Hydro processing catalysts are used to remove impurities such as sulphur, nitrogen, and metals from crude oil, as well as to convert heavy feedstocks into lighter and more valuable products such as petrol, diesel, and jet fuel. Hydro processing catalysts are widely used in refineries and monopolise the oil and gas catalyst market due to increased demand for cleaner fuels and stricter environmental regulations.
Fluid catalytic cracking (FCC) is a critical step in the production of petrol from crude oil, and FCC catalysts are widely used in refineries. FCC catalysts use a catalyst and a fluidized bed reactor to crack heavy hydrocarbons into lighter fractions, such as petrol. Because there is a high demand for petrol and other light fractions, FCC catalysts have a significant market share in the oil and gas catalyst market.
Oil & Gas Catalyst Market Regional Outlook
North America
- U.S.
- Canada
Europe
- U.K.
- Germany
- France
- Spain
- Rest of Europe
Asia-Pacific
- India
- Japan
- China
- Australia
- South Korea
- Rest of Asia-Pacific
Latin America
- Brazil
- Mexico
- Rest of Latin America
The Middle East & Africa
- South Africa
- GCC Countries
- Rest of the Middle East & Africa (ME&A)
Oil & Gas Catalyst Market Regional Analysis
North America, which includes the United States and Canada, is an important market for oil and gas catalysts. The region is well-known for its developed oil and gas industry, which includes a large number of refineries and petrochemical plants. The need to upgrade heavy crude oil into lighter and cleaner products, meet stringent environmental regulations, and maximize operational efficiency is driving demand for oil and gas catalysts in North America. The United States is one of the region's largest consumers of oil and gas catalysts, with a particular emphasis on hydro processing catalysts and fluid catalytic cracking catalysts.
Asia-Pacific is a rapidly expanding market for oil and gas catalysts, owing to rising energy demand in emerging economies such as China, India, and Southeast Asian countries. The region's refining and petrochemical industries are expanding, as is the demand for cleaner fuels, industrial chemicals, and plastics. The need to upgrade heavy feedstocks, adhere to environmental regulations, and improve process efficiency is driving demand for oil and gas catalysts in Asia-Pacific. China and India are the region's largest consumers of oil and gas catalysts, with high demand for hydro processing and hydrogen production catalysts.
Oil & Gas Catalyst Market Players
Some of the top oil & gas catalyst companies offered in the professional report include Arkema SA, Albemarle Corporation, Exxon Mobil Chemical Corporation, The Dow Chemical Company, Evonik Industries, Clariant AG, Honeywell International and Chevron Phillips Chemical Company.
Frequently Asked Questions
What was the market size of the global oil & gas catalyst in 2022?
The market size of oil & gas catalyst was USD 5.3 billion in 2022.
What is the CAGR of the global oil & gas catalyst market from 2023 to 2032?
The CAGR of oil & gas catalyst is 6.2% during the analysis period of 2023 to 2032.
Which are the key players in the oil & gas catalyst market?
The key players operating in the global oil & gas catalyst market is includes Arkema SA, Albemarle Corporation, Exxon Mobil Chemical Corporation, The Dow Chemical Company, Evonik Industries, Clariant AG, Honeywell International and Chevron Phillips Chemical Company.
Which region dominated the global oil & gas catalyst market share?
North America held the dominating position in oil & gas catalyst industry during the analysis period of 2023 to 2032.
Which region registered fastest CAGR from 2023 to 2032?
Asia-Pacific region exhibited fastest growing CAGR for market of oil & gas catalyst during the analysis period of 2023 to 2032.
What are the current trends and dynamics in the global oil & gas catalyst industry?
The current trends and dynamics in the oil & gas catalyst industry include growing demand for energy, increasing demand for cleaner fuels, and rising demand for petrochemicals.
Which type held the maximum share in 2022?
The transition metal types held the maximum share of the oil & gas catalyst industry.


