Non Fungible Token Market | Acumen Research and Consulting
Non-fungible Token Market
Published :
Report ID:
Pages :
Format : 
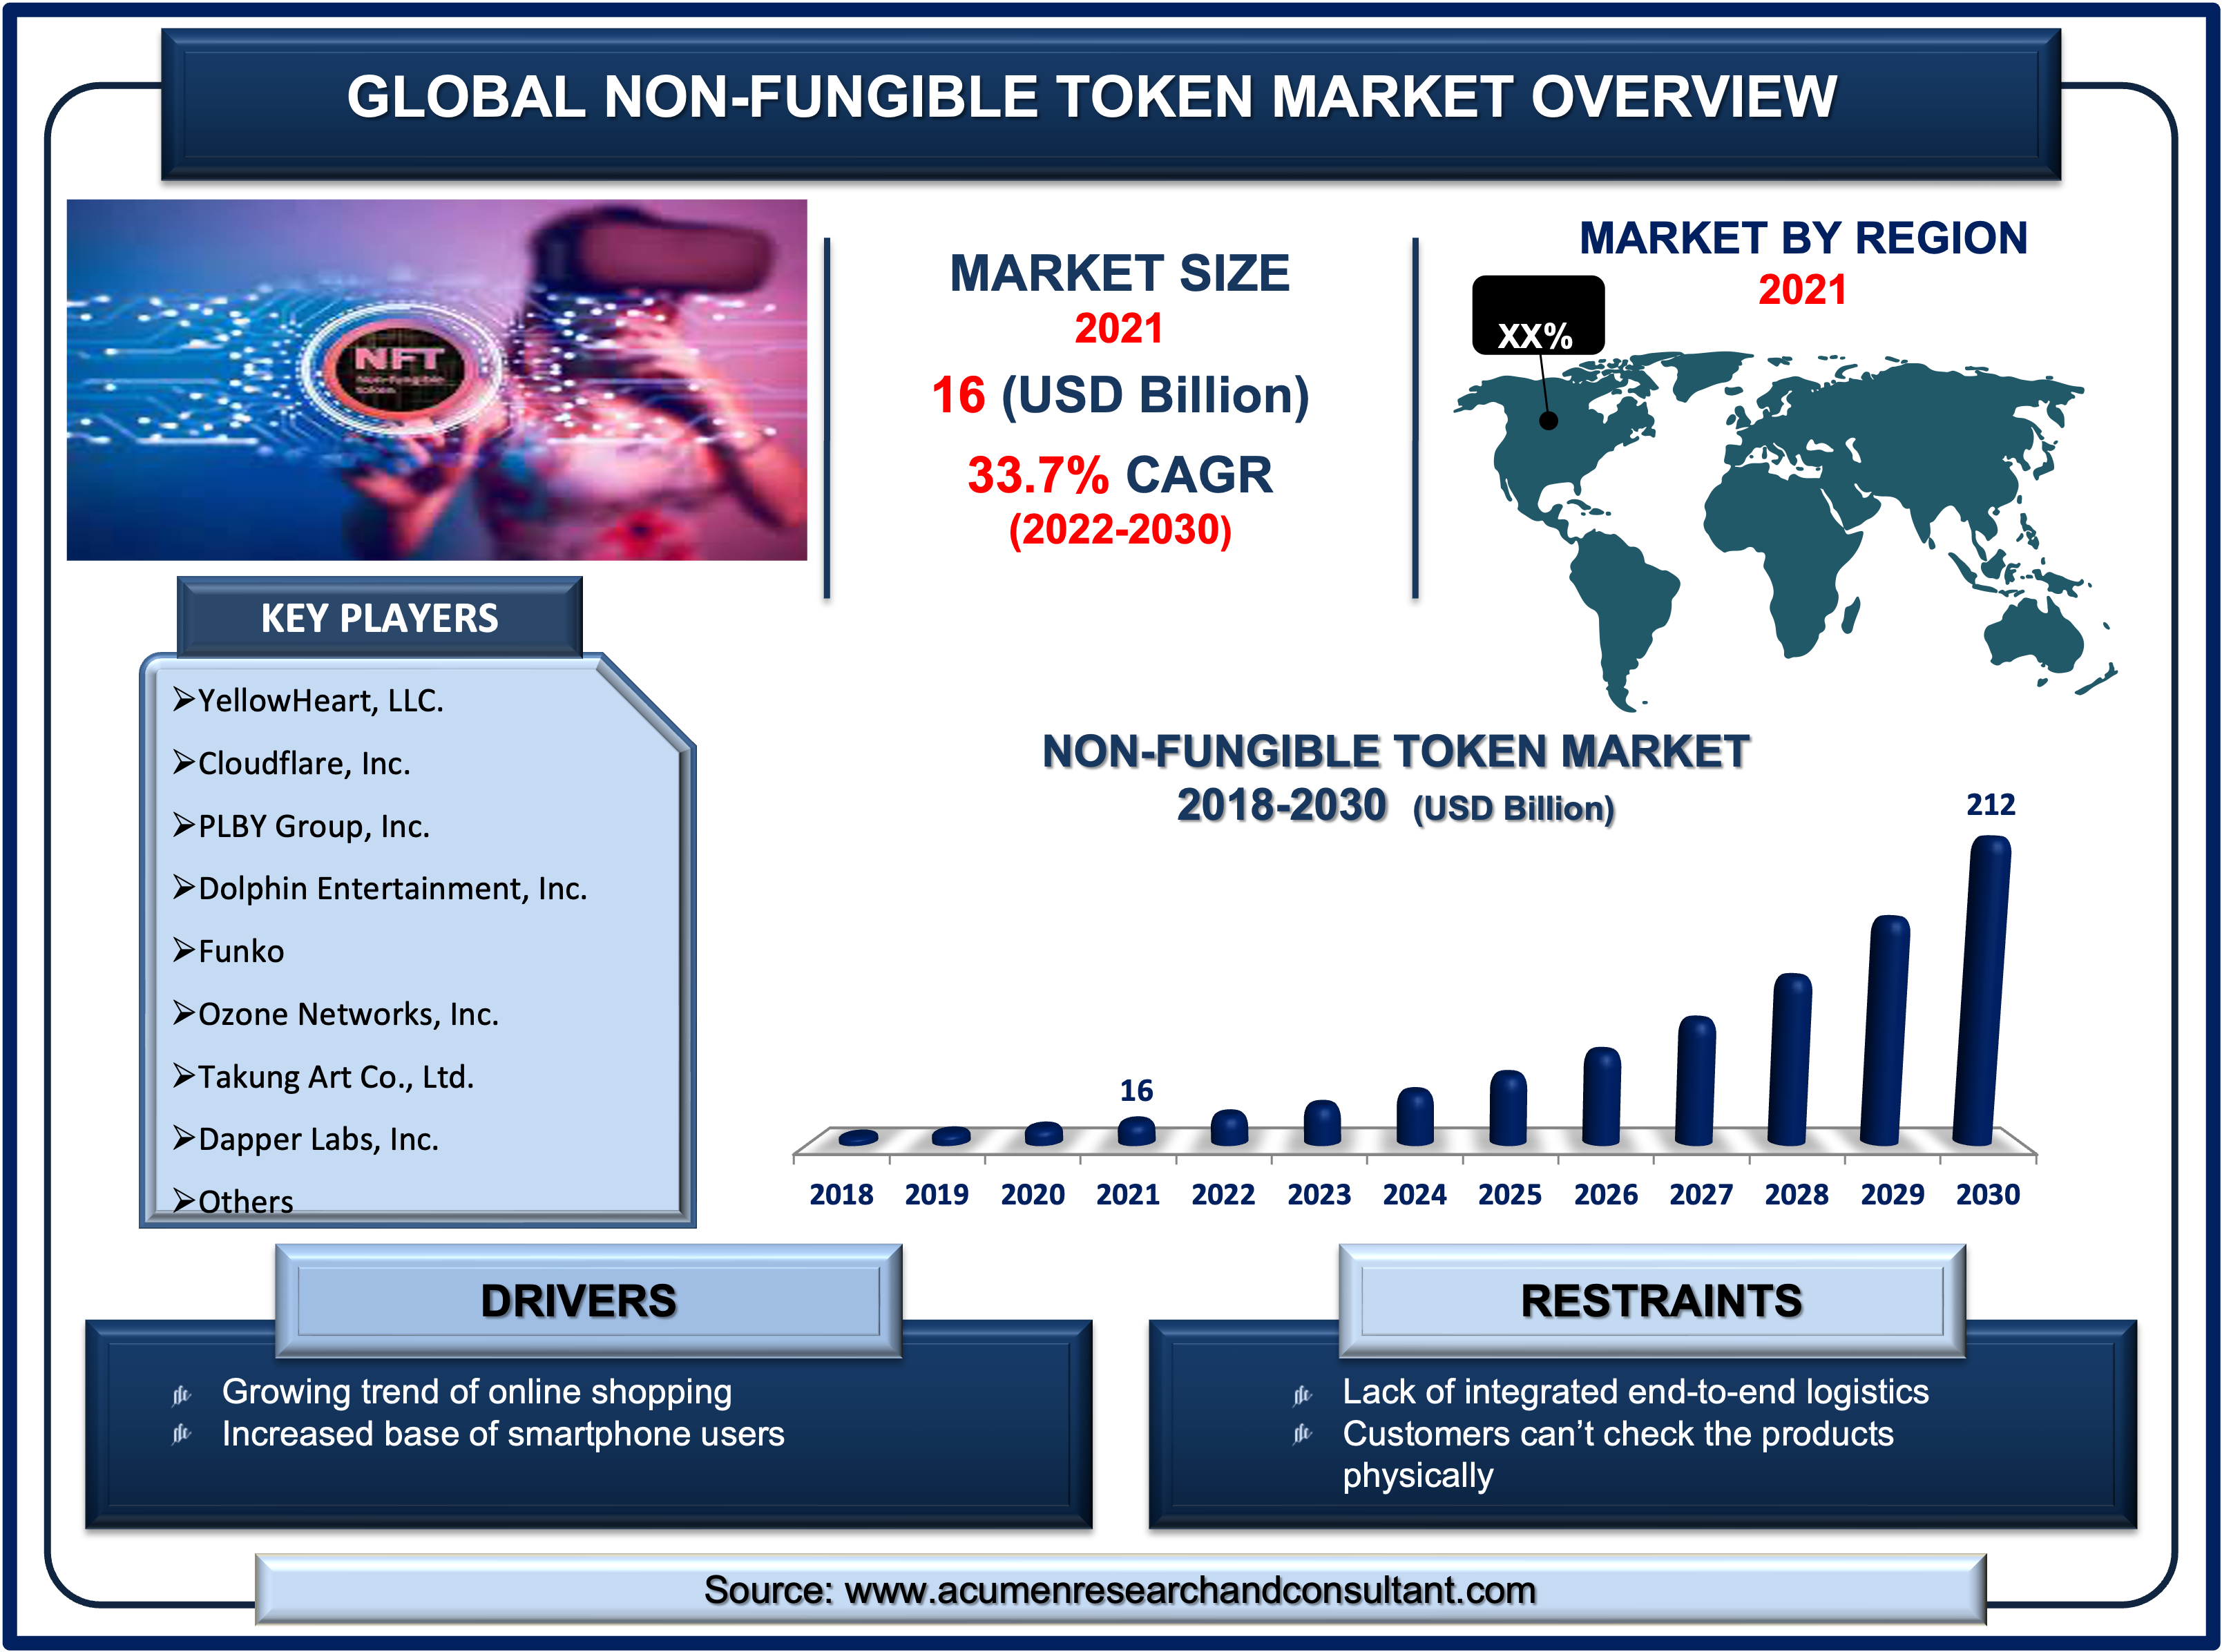
The global non-fungible token market size accounted for USD 16 Bn in 2021 and is estimated to reach USD 212 Bn by 2030, with a significant CAGR of 33.7% from 2022 to 2030.
NFTs are a relatively new and intriguing phenomenon. They're unique digital goods that can be bought and traded online using cryptocurrency, and they've been around since 2014. NFTs are intended to identify ownership of a certain digital item (typically a digital artwork). They are disrupting businesses all over the world, from art to gaming to events and insurance. Celebrities in sports, entertainment, art, technology, and huge consumer businesses have all "minted" and promoted NFTs. NFTs represent a new horizon for the fine art sector, despite the fact that artists have been working in other digital mediums for many years. Tweets, GIFs, and photos, as well as songs and movies, are all examples of NFTs.NFTs, like cryptocurrencies, are part of a global ecosystem that is borderless, decentralized, and virtual-crypto marketplaces where they are created, offered, and acquired. Blockchain technology, a decentralized, unchangeable ledger of transactions, is used to verify the legitimacy, provenance, and ownership of NFTs.

Market Growth Drivers:
- Rising awareness about NFTs
- Increasing trend of digital artworks
- Growing adoption in the gaming sector
Market Restraints:
- Concerns regarding frauds and scams
- Lack of standardization
Market Opportunities:
- Increasing demand for decentralized marketplaces
- Rising popularity by social media channels
Report Coverage
| Market | Non-fungible Token Market |
| Market Size 2021 | USD 16 Bn |
| Market Forecast 2030 | USD 212 Bn |
| CAGR | 33.7% During 2022 - 2030 |
| Analysis Period | 2018 - 2030 |
| Base Year | 2021 |
| Forecast Data | 2022 - 2030 |
| Segments Covered | By Type, By Application, By End-Use, And By Geography |
| Regional Scope | North America, Europe, Asia Pacific, Latin America, and Middle East & Africa |
| Key Companies Profiled | Cloudflare, Inc., Dapper Labs, Inc., Dolphin Entertainment, Inc., Funko, Gemini Trust Company, LLC., Onchain Labs, Inc., Ozone Networks, Inc., PLBY Group, Inc., Takung Art Co., Ltd., and YellowHeart, LLC. |
| Report Coverage |
Market Trends, Drivers, Restraints, Competitive Analysis, Player Profiling, Regulation Analysis |
| Customization Scope |
10 hrs of free customization and expert consultation |
Market Dynamics
The increasing trend of digital artworks is one of the leading factors that are driving the demand for the global non-fungible token market. NFTs are most usually connected with purchasing/owning digital artwork, as they allow an investor or collector to possess the original digital piece while retaining copyright and reproduction rights. NFTs can be anything digital (drawings, music, videos, etc.), but the current buzz is focused on exploiting the technology to sell digital art. Another significant factor driving market expansion is the increased implementation of NFT in different industries, namely gaming, ticketing, real estate, and others. For example, one of the industries that will profit the most from NFTs is gaming.
In addition to that, the rising adoption of NFTs in the gaming sector is expected to fuel market growth in the coming period. NFT games use a play-to-earn model, which allows players to earn money while they play. Gamers can also make money by purchasing and selling in-game NFTs or fulfilling tasks in exchange for cryptocurrency prices. For instance, the success of blockchain-based game providers like Axie Infinity has made the play-to-earn (P2E) style model, also known as GameFi, popular among NFT games.
However, concerns regarding frauds and scams related to NFTs are holding back the growth of the industry. For instance, in the NFT phishing scam, customers are asked to provide their private wallet keys or 12-word security seed phrases via fraudulent websites and pop-ups. Scammers can hacka user wallet once they have their wallet's keys and deplete all of your crypto and NFT holdings.
Moreover, increasing demand for decentralized marketplaces has shown the market numerous growth opportunities during the forecast period 2022 – 2030. Participants interested in making money with NFTs could look into decentralized markets that similarly use blockchain as DAOs and metaverse. The rapidly evolving metaverse, which is built on decentralized blockchain technology, will soon become the most popular location for NFTs. Rising popularity from social media channels is one of the popular non-fungible token market trends that has created a noteworthy growth prospect in the industry.
Non-Fungible Token Market Segmentation
The global non-fungible token market is segmented based ontype, application, end-use, and region.
Market by Type
- Digital Asset
- Physical Asset

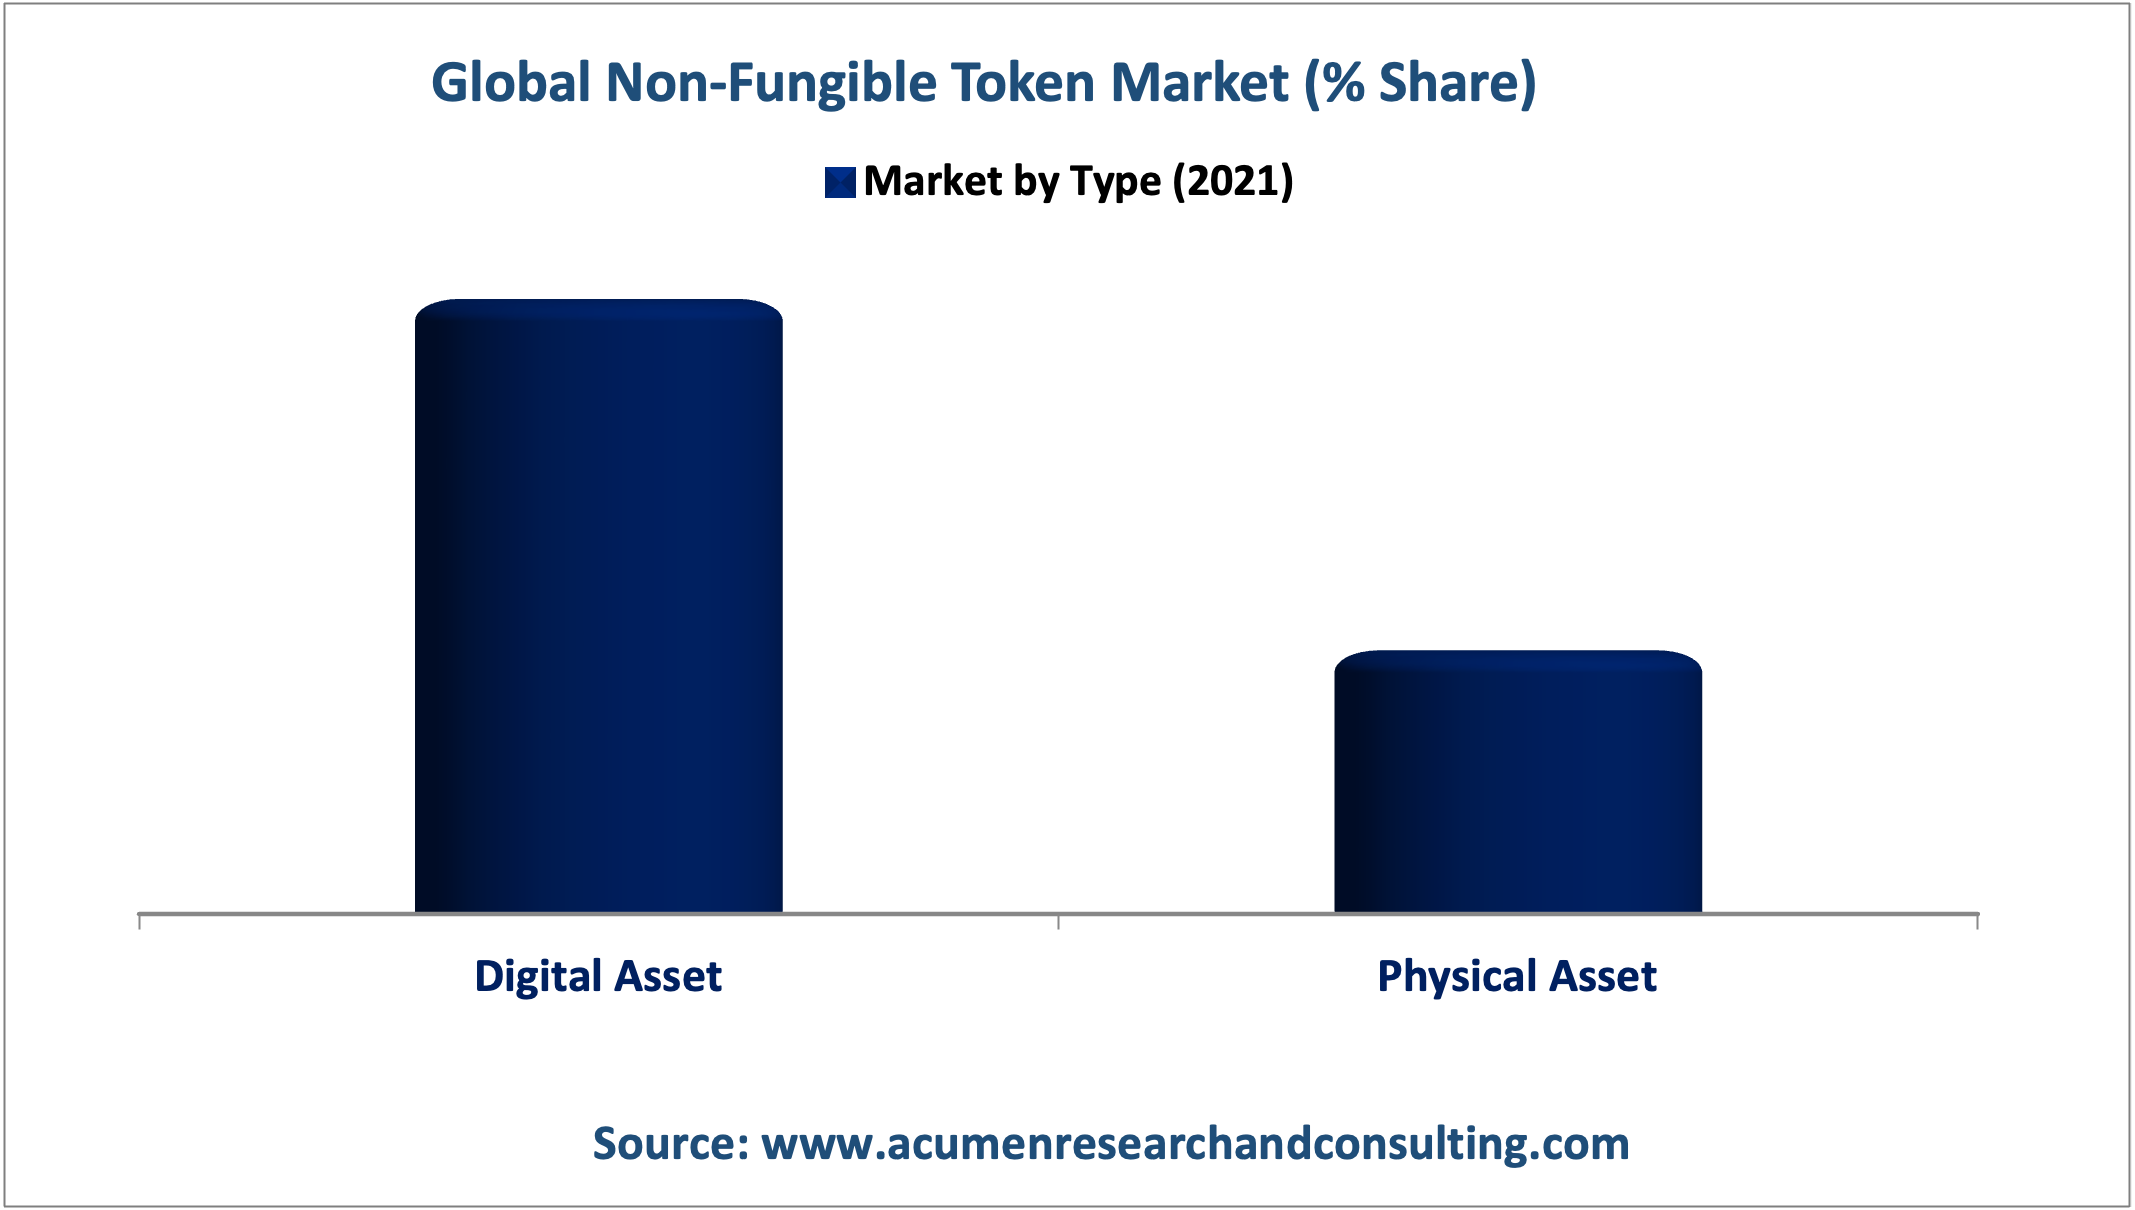
Based on our analysis, the digital asset segment occupied the majority of the non-fungible market share in 2021 and is expected to continue its trend during the forecast period 2022 – 2030. NFTs are now most commonly used in digital sector. When an artist posts work to a social media platform, the platform makes money by selling adverts to the artist's subscribers in exchange for exposure. NFTs enable a new dynamic market in which content creators retain control of their work rather than handing it over to platforms for promotion, which is driving category growth.
Market by Application
Collectibles
- Audio Clips
- Video Clips
- Gamification
- Others
Gaming
- Video Game
- Trading Card Game (TCG)
- Strategy Role Playing Game (RPG)
- Others
Art
- Pixel Art
- GIFs
- 2D/3D Painting
- 2D/3D Computer Graphics
- Fractal/Algorithmic Art
- Computer Generated Painting
- Others
Utilities
- Tickets
- Domain Names
- Assets Ownership
Sport
Metaverse
Others
Among them, the collectibles segment held a noteworthy market share in 2021. Collectibles are valuable artifacts that collectors look for and buy. Collectors might vary from short-term traders to crypto billionaires who benefit from collecting goods. NFT coins that can be minted in NFT marketplaces are known as crypto-collectibles. The increased demand for crypto collectibles can be ascribed to advantages such as asset independence and ease of use. However, the sports segment is expected to achieve a significant growth rate in the coming years.
Market by End-Use
- Commercial
- Personal

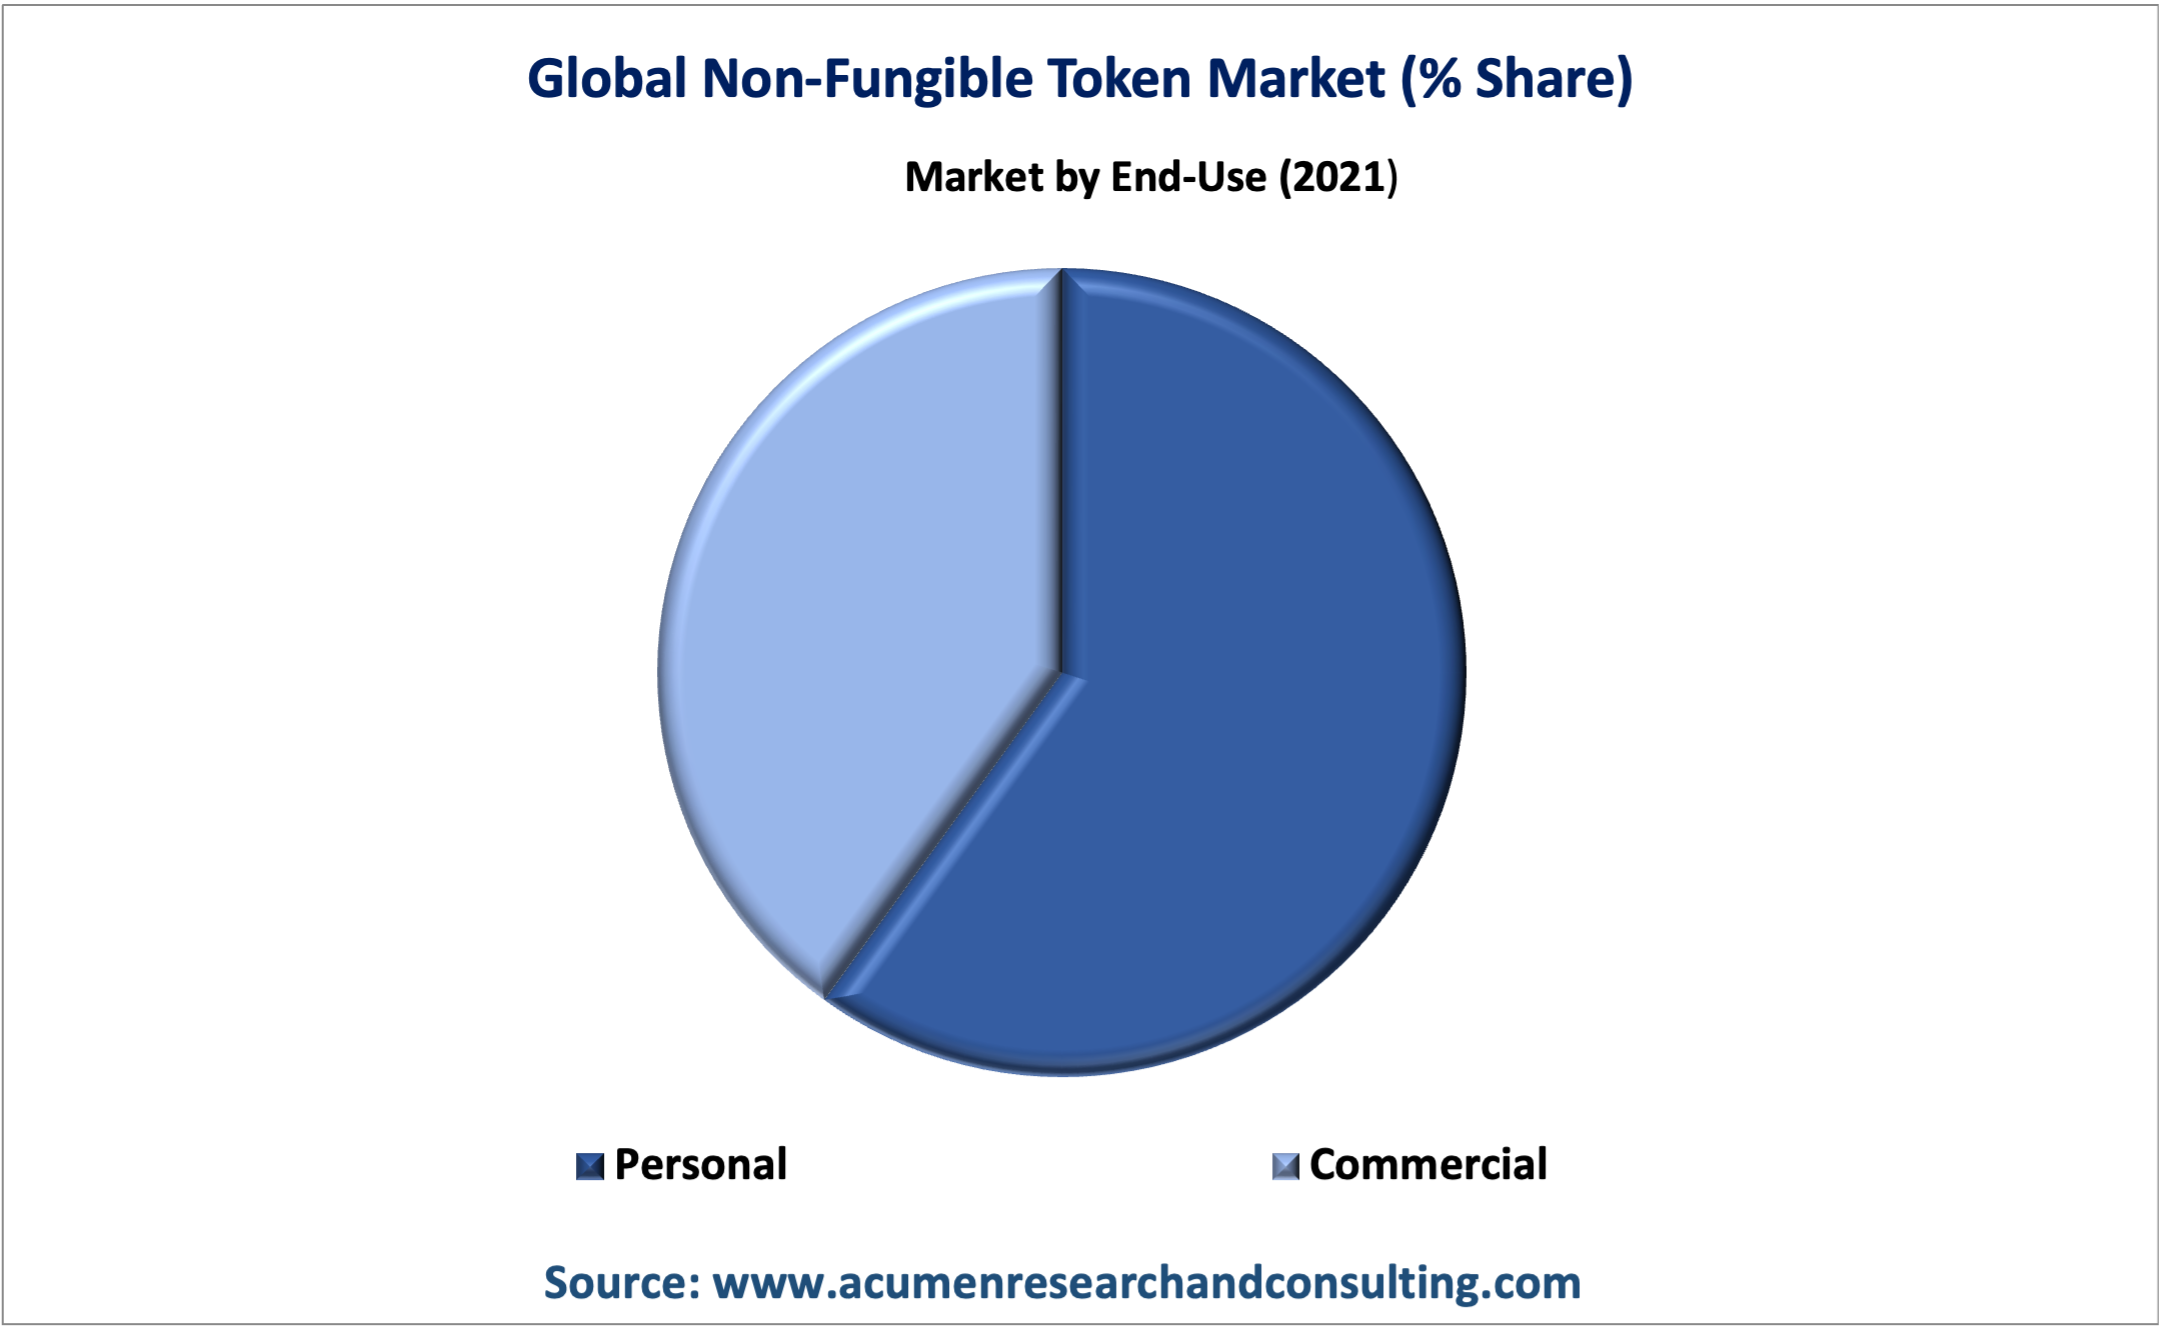
Based on the end-use, the personal segment is expected to hold a significant share in 2021. On the other hand, the commercial segment has witnessed a sudden impetus and is expected to grow significantly throughout the forecast period 2022 – 2030. The rising demand for NFTs for corporate use is likely to fuel revenue growth in the category. Furthermore, the increasing use of NFTs in supply chain and logistics will move this market forward. In addition, logistics sector market players are consistentlyusing blockchain technology into their operations, thus creating new chances for the industry to expand.
Non-fungible Token Market Regional Overview
North America
- U.S.
- Canada
Europe
- U.K.
- Germany
- France
- Spain
- Rest of Europe
Latin America
- Mexico
- Brazil
- Rest of Latin America
Asia-Pacific
- India
- Japan
- China
- Australia
- South Korea
- Rest of Asia-Pacific
The Middle East & Africa (MEA)
- Gulf Cooperation Council (GCC)
- South Africa
- Rest of the Middle East & Africa
Surging Adoption of Cryptocurrency in North America Fuels the Regional Market Growth
The regional segmentation is given as North America, Latin America, Asia-Pacific, Europe, and the Middle East & Africa (MEA). Based on regional analysis, the Asia-Pacific region is anticipated to grow at the fastest rate throughout the forecast period 2022 – 2030. The region's rapid growth can be ascribed to a number of recent developments, including as the debut of non-fungible tokens in the region. In several Asia-Pacific countries, like as China, India, and Japan, the non-fungible token is becoming popular. On the other hand, the North America region accumulated maximum non-fungible token market revenue in the regional segmentation. An increase in digital art, strong development, and the adoption of cryptocurrencies is expanding in the region, which is expected to drive market growth.
Key Players
Some of the top non-fungible token companies offered in the professional report include Cloudflare, Inc., Dapper Labs, Inc., Dolphin Entertainment, Inc., Funko, Gemini Trust Company, LLC., Onchain Labs, Inc., Ozone Networks, Inc., PLBY Group, Inc., Takung Art Co., Ltd., and YellowHeart, LLC.
Frequently Asked Questions
How much was the estimated value of the global non-fungible token market in 2021?
The estimated value of global non-fungible token market in 2021 was accounted to be US$ 16 Bn.
The estimated value of global non-fungible token market in 2021 was accounted to be US$ 16 Bn.
The projected CAGR of non-fungible token market during the analysis period of 2022 to 2030 is 33.7%.
Which are the prominent competitors operating in the market?
The prominent players of the global non-fungible token market in volve Cloudflare, Inc., Dapper Labs, Inc., Dolphin Entertainment, Inc., Funko, Gemini Trust Company, LLC., Onchain Labs, Inc., Ozone Networks, Inc., PLBY Group, Inc., Takung Art Co., Ltd., and YellowHeart, LLC.
Which region held the dominating position in the global non-fungible token market?
North America held the dominating share for non-fungible token during the analysis period of 2022 to 2030.
Which region exhibited the fastest growing CAGR for the forecast period of 2022 to 2030?
Asia-Pacific region exhibited fastest growing CAGR for non-fungible token during the analysis period of 2022 to 2030.
What are the current trends and dynamics in the global non-fungible token market?
Rising awareness about NFTs, increasing trend of digital artworks, and growing adoption in the gaming sector all contribute to the expansion of the worldwide non-fungible token market.
Rising awareness about NFTs, increasing trend of digital artworks, and growing adoption in the gaming sector all contribute to the expansion of the worldwide non-fungible token market.
Based on type, digital asset segment held the maximum share for non-fungible token market in 2021.
Select Licence Type
Connect with our sales team
Why Acumen Research And Consulting
100%
Customer Satisfaction
24x7
Availability - we are always there when you need us
200+
Fortune 50 Companies trust Acumen Research and Consulting
80%
of our reports are exclusive and first in the industry
100%
more data and analysis
1000+
reports published till date


