Non Alcoholic Beverages Market | Acumen Research and Consulting
Non-Alcoholic Beverages Market Size - Global Industry, Share, Analysis, Trends and Forecast 2023 - 2032
Published :
Report ID:
Pages :
Format :
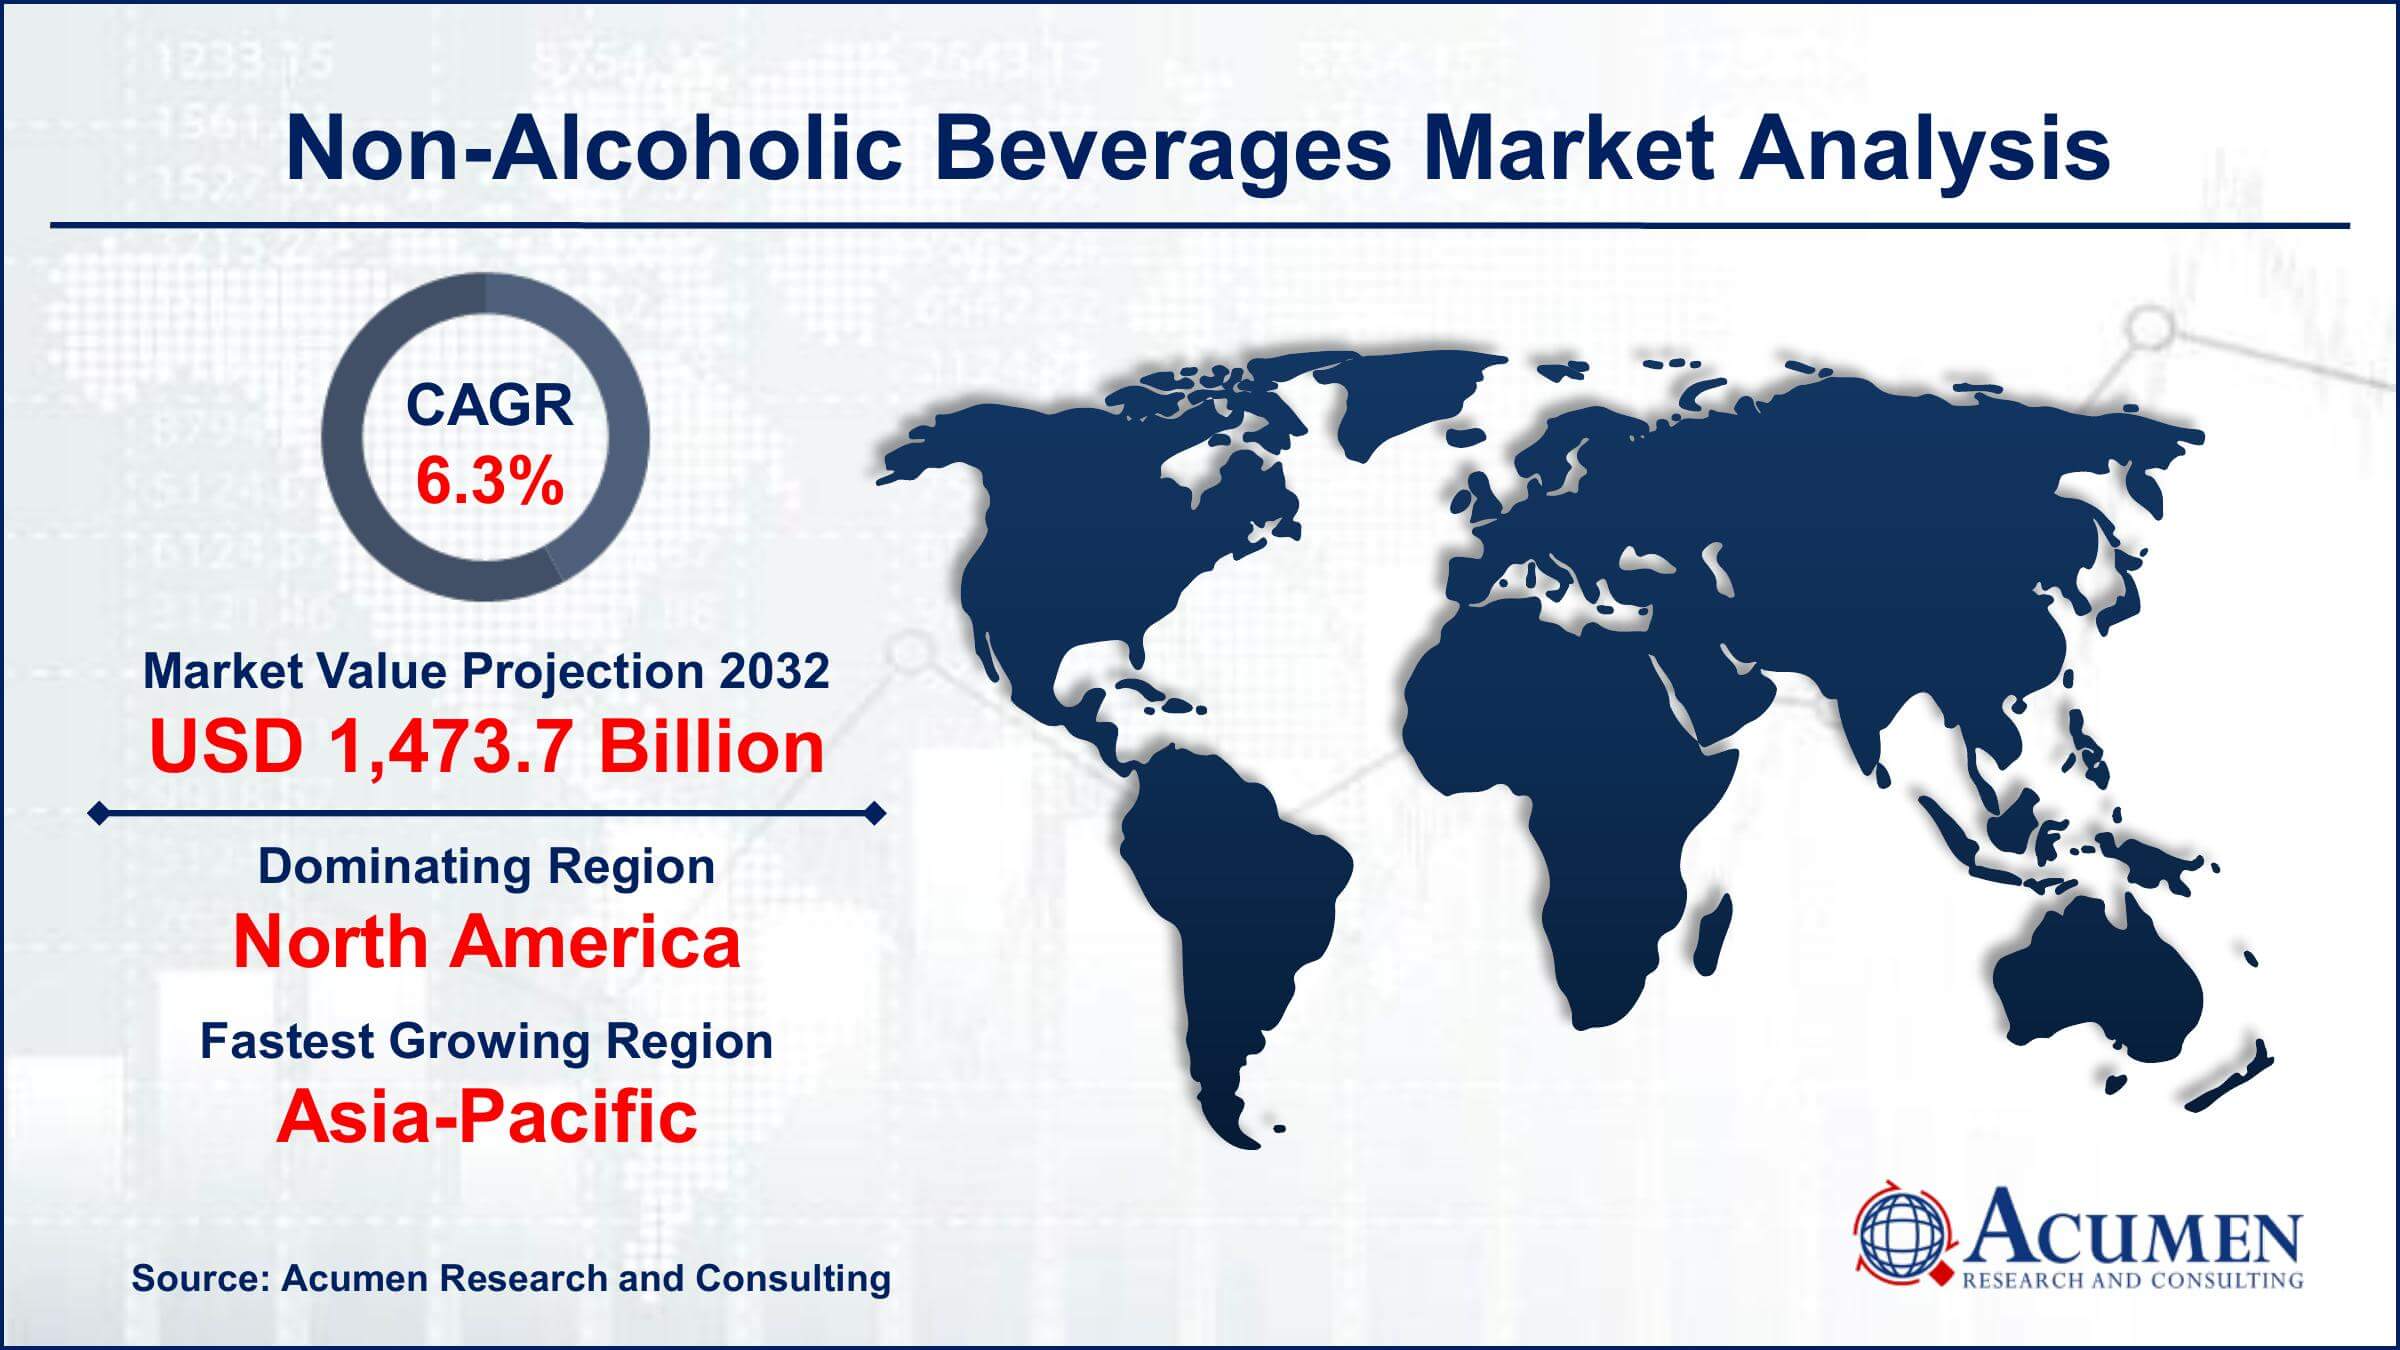
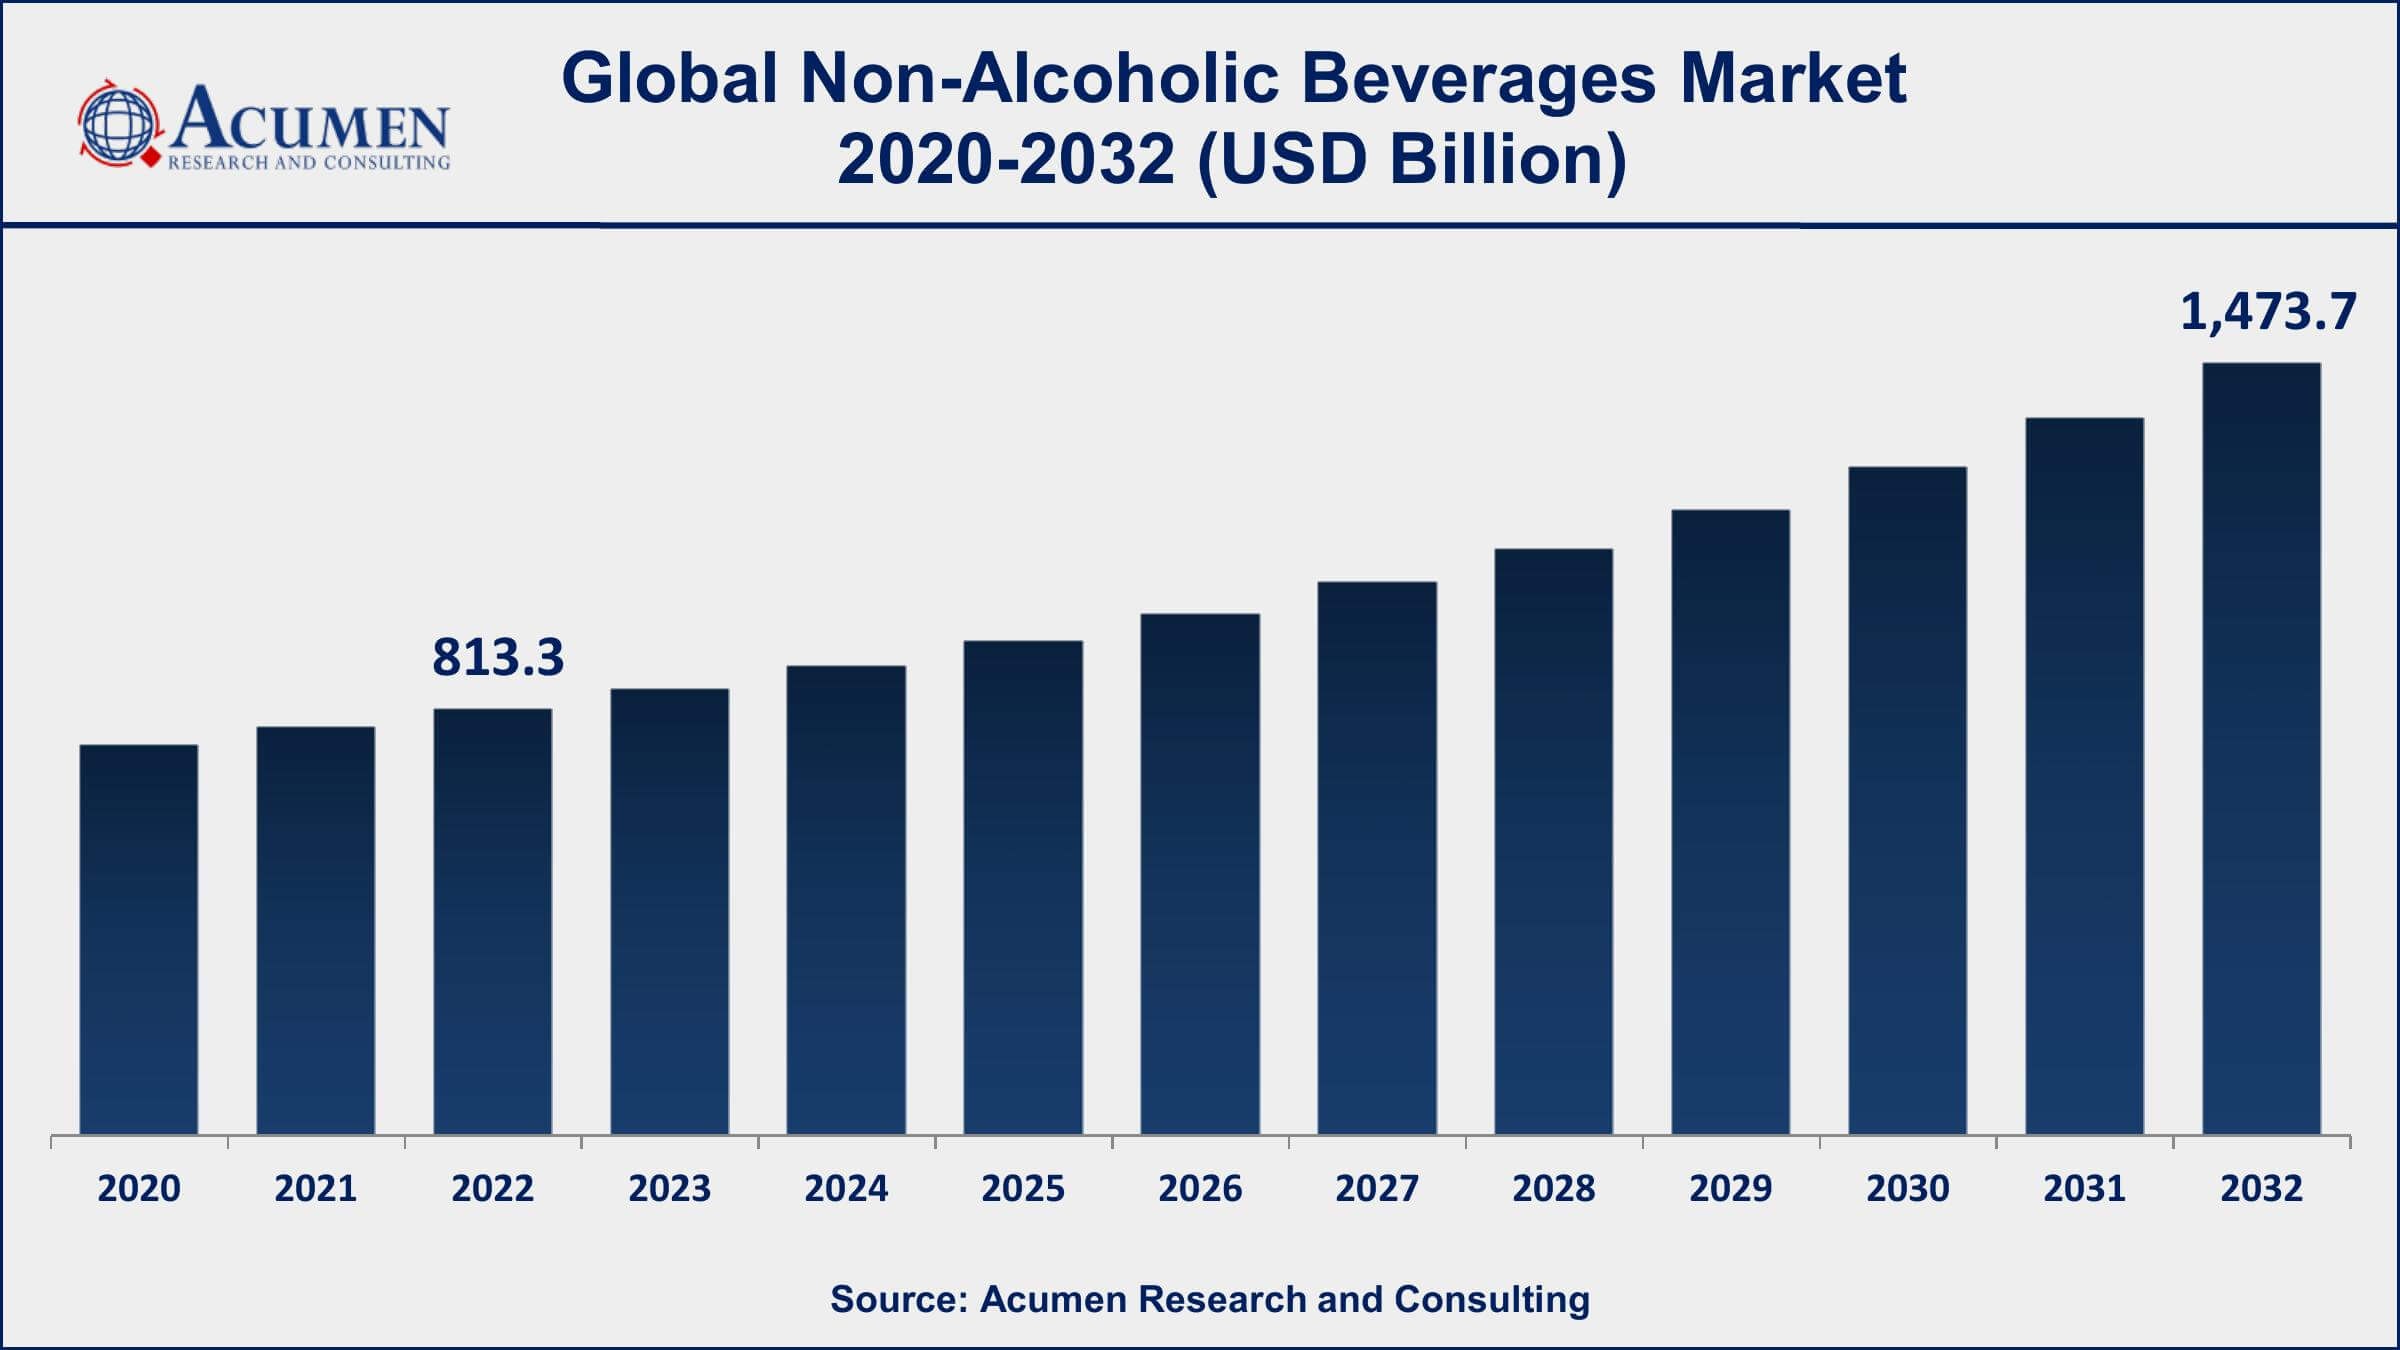
The Global Non-Alcoholic Beverages Market Size accounted for USD 813.3 Billion in 2022 and is projected to achieve a market size of USD 1,473.7 Billion by 2032 growing at a CAGR of 6.3% from 2023 to 2032.
Non-Alcoholic Beverages Market Highlights
- Global Non-Alcoholic Beverages Market revenue is expected to increase by USD 1,473.7 Billion by 2032, with a6.3% CAGR from 2023 to 2032
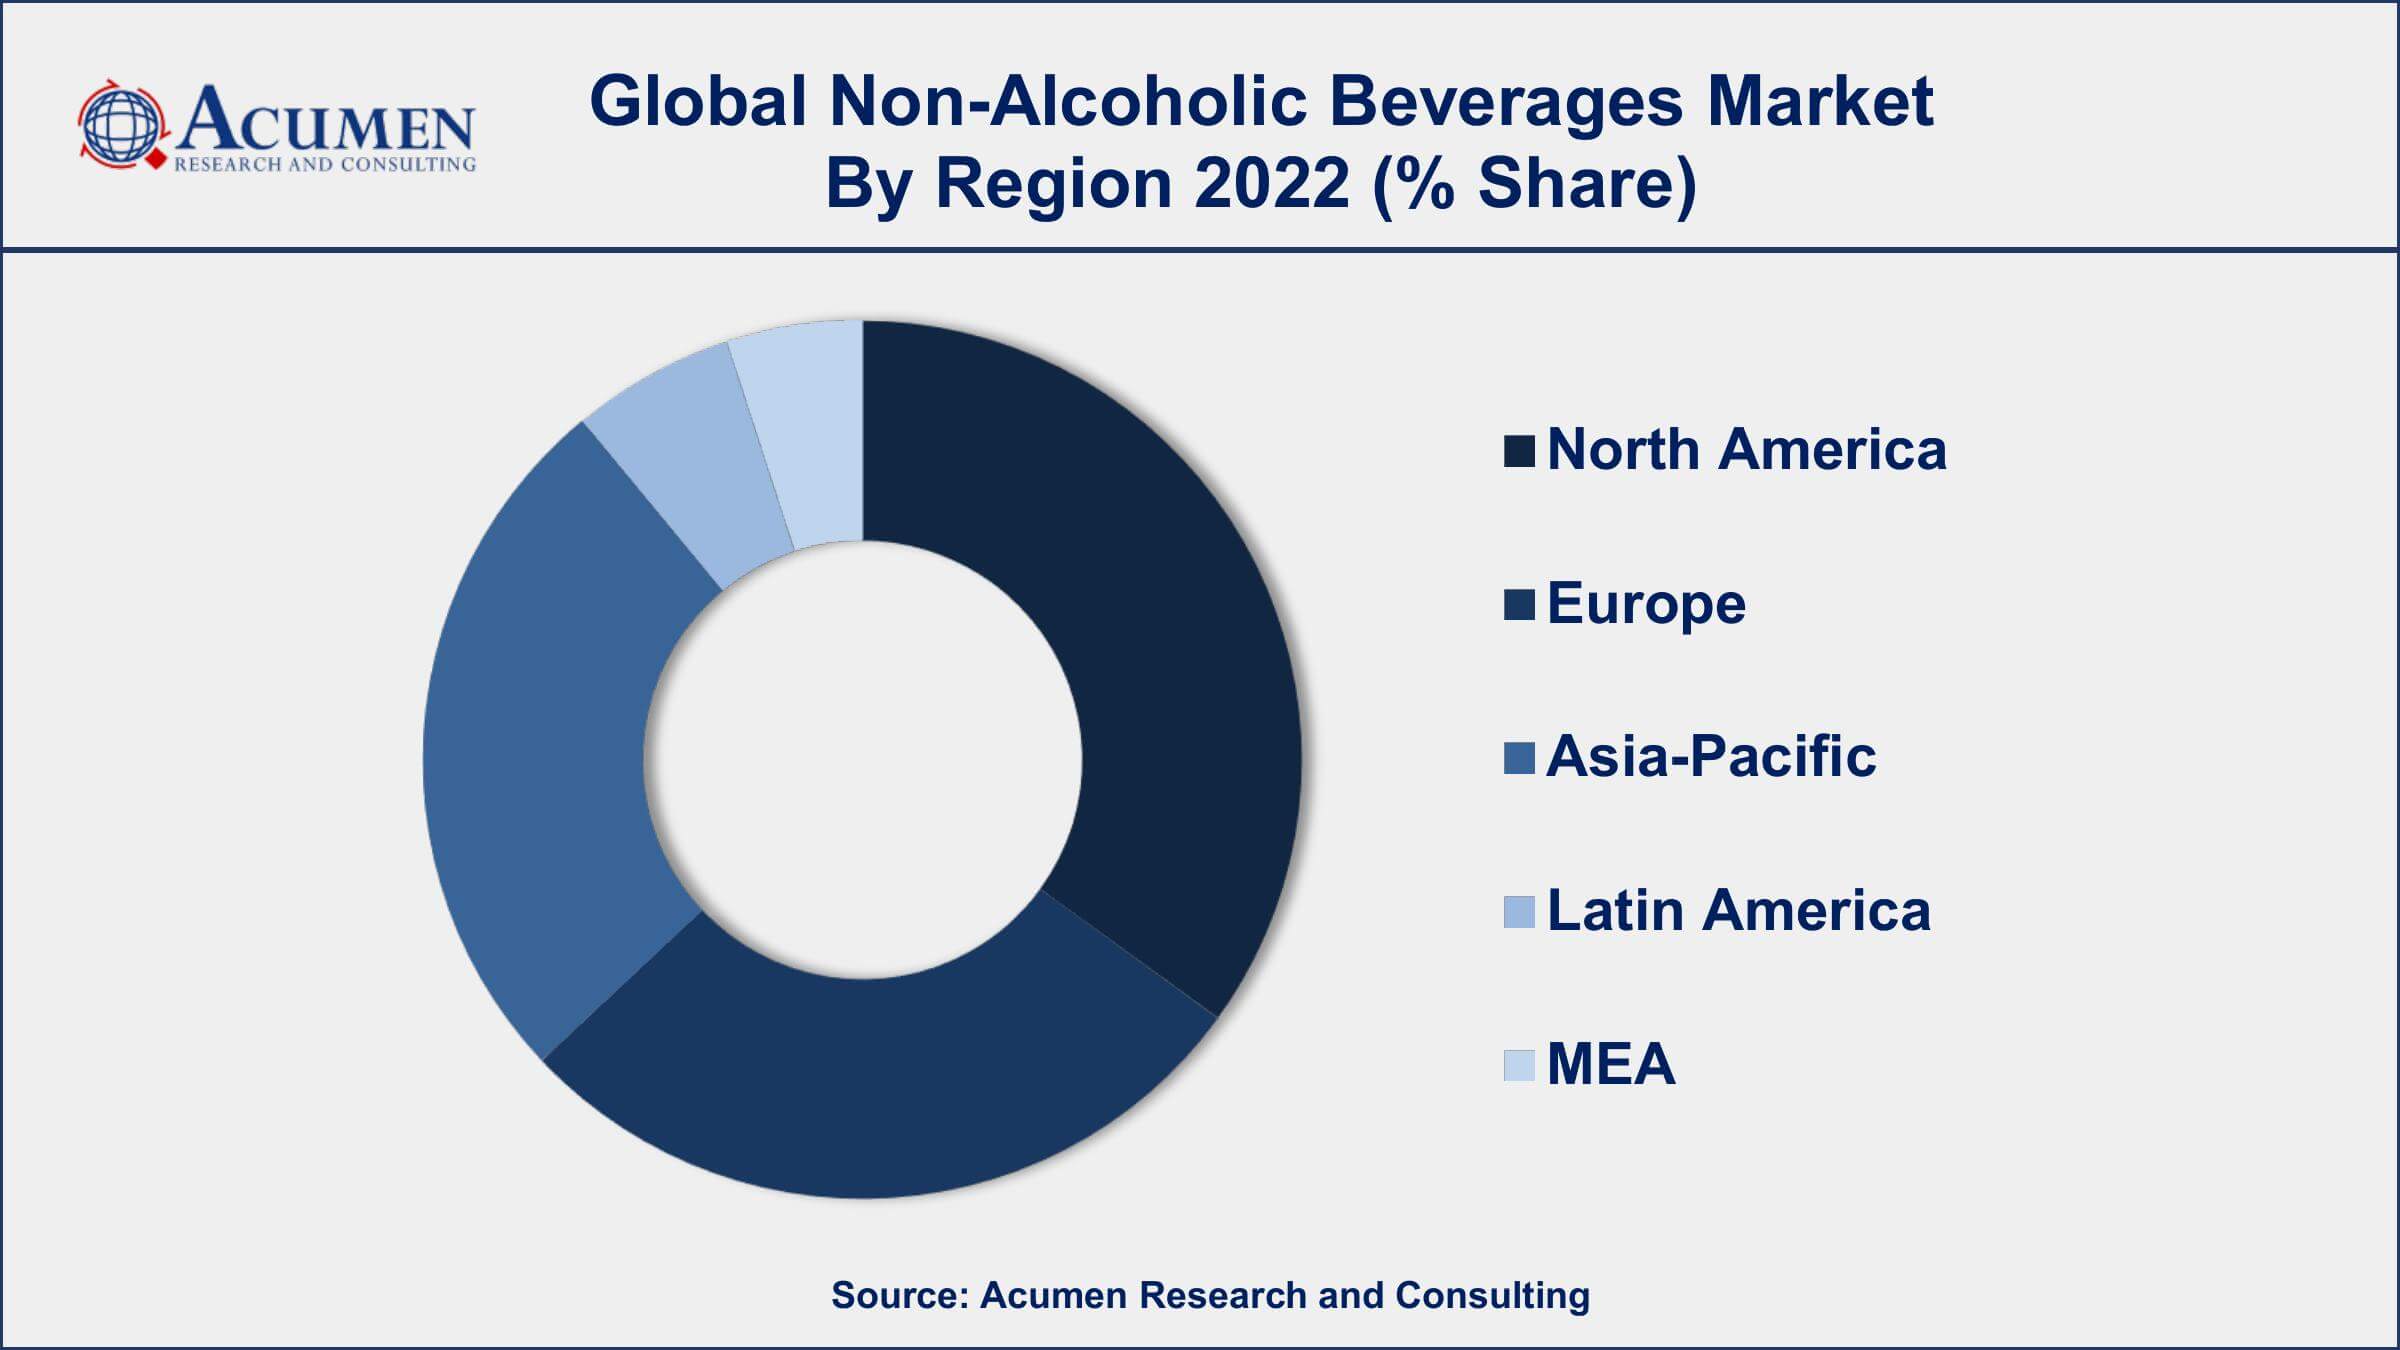
- North America region led with more than 25% of Non-Alcoholic Beverages Market share in 2022
- Asia-Pacific Non-Alcoholic Beverages Market growth will record a CAGR of more than 7% from 2023 to 2032
- By product type, the carbonated soft drinks segment has accounted more than 27% of the revenue share in 2022
- By distribution channel, the online store segment is predicted to grow at the fastest CAGR between 2023 and 2032
- Increasing health consciousness and the demand for healthier beverage options, drives the Non-Alcoholic Beverages Market value

Non-alcoholic beverages refer to beverages that do not contain alcohol or have very low alcohol content. They provide a refreshing and flavorful alternative to alcoholic drinks and are often consumed by individuals who choose not to consume alcohol for various reasons, including personal preference, health concerns, or religious beliefs. Non-alcoholic beverages come in a wide range of options, including soft drinks, juices, energy drinks, flavored water, mocktails, and herbal teas.
One of the key drivers behind the growth of the non-alcoholic beverage market is the increasing health consciousness among consumers. As more people become aware of the negative health effects of excessive alcohol consumption, they are seeking healthier alternatives. Non-alcoholic beverages, particularly those that are low in sugar and calories, offer a healthier option for hydration and refreshment. Additionally, the rise of wellness trends and the focus on fitness and well-being have contributed to the growing demand for non-alcoholic beverages. The market growth of non-alcoholic beverages has also been fueled by changing consumer preferences and the availability of innovative and flavorful drink options.

Global Non-Alcoholic Beverages Market Trends
Market Drivers
- Increasing health consciousness and the demand for healthier beverage options
- Growing awareness of the negative health effects of alcohol consumption
- Rising focus on fitness, wellness, and overall well-being
- Changing consumer preferences and taste preferences
Market Restraints
- Intense competition from alcoholic beverages
- High production and marketing costs
Market Opportunities
- Utilization of digital marketing strategies to reach a wider consumer base
- Introduction of new flavors and product variations to cater to diverse tastes
Non-Alcoholic Beverages Market Report Coverage
| Market | Non-Alcoholic Beverages Market |
| Non-Alcoholic Beverages Market Size 2022 | USD 813.3 Billion |
| Non-Alcoholic Beverages Market Forecast 2032 | USD 1,473.7 Billion |
| Non-Alcoholic Beverages Market CAGR During 2023 - 2032 | 6.3% |
| Non-Alcoholic Beverages Market Analysis Period | 2020 - 2032 |
| Non-Alcoholic Beverages Market Base Year | 2022 |
| Non-Alcoholic Beverages Market Forecast Data | 2023 - 2032 |
| Segments Covered | By Product Type, By Distribution Channel, And By Geography |
| Regional Scope | North America, Europe, Asia Pacific, Latin America, and Middle East & Africa |
| Key Companies Profiled | The Coca-Cola Company, PepsiCo, Inc., Nestlé S.A., Keurig Dr. Pepper Inc., Danone S.A., Unilever PLC, Suntory Holdings Limited, Red Bull GmbH, Monster Beverage Corporation, The Kraft Heinz Company, Ocean Spray Cranberries, Inc., and Starbucks Corporation. |
| Report Coverage |
Market Trends, Drivers, Restraints, Competitive Analysis, Player Profiling, Covid-19 Analysis, Regulation Analysis |
Non-alcoholic beverages are a diverse range of drinks that do not contain alcohol. They are consumed for various purposes, including hydration, refreshment, and enjoyment, and are available in numerous forms to cater to different tastes and preferences. These beverages have a wide array of applications in different settings, from households to restaurants, cafes, and social gatherings. Soft drinks, flavored water, and fruit juices are commonly consumed to satisfy thirst and replenish fluids in the body. They offer a refreshing and flavorful alternative to plain water and can be enjoyed by people of all ages. Non-alcoholic beverages also play a significant role in maintaining proper hydration during physical activities or in hot climates, where the need for fluid intake is particularly important.
Non-alcoholic beverages are also popular in social settings and gatherings. They are commonly served at parties, weddings, and other events where alcoholic beverages may not be suitable or desired. Mocktails, which are non-alcoholic versions of cocktails, provide an appealing and festive option for those who prefer not to consume alcohol. In addition, non-alcoholic beverages are often served as accompaniments to meals, providing complementary flavors and enhancing the overall dining experience. They can range from carbonated soft drinks and herbal teas to natural fruit juices and specialty concoctions, offering a versatile range of options for consumers.
The non-alcoholic beverages market has witnessed significant growth in recent years and is expected to continue expanding in the coming years. One of the primary drivers behind this growth is the increasing consumer demand for healthier and more diverse beverage options. With a rising emphasis on health and wellness, consumers are seeking alternatives to traditional sugary soft drinks and alcoholic beverages. This shift in consumer preferences has led to the introduction of a wide range of non-alcoholic beverages, including natural and organic options, functional drinks, and low-sugar alternatives, which have gained popularity among health-conscious consumers.
Non-Alcoholic Beverages Market Segmentation
The global Non-Alcoholic Beverages Market segmentation is based on product type, distribution channel, and geography.
Non-Alcoholic Beverages Market By Product Type
- Carbonated Soft Drinks
- Bottled Water
- Juices
- RTD Tea and Coffee
- Sports and Energy Drinks
- Others
In terms of product types, the carbonated soft drinks (CSD) segment has seen significant growth in the recent years. CSDs are carbonated beverages that typically include cola, lemon-lime, fruit-flavored, and other carbonated drinks. While the market for CSDs has faced increasing competition from healthier alternatives and changing consumer preferences, it still maintains a significant presence and continues to grow. One of the key factors driving the growth of the CSD segment is its widespread popularity and brand recognition. Established brands in the CSD market have built strong consumer loyalty and enjoy a large customer base. These brands continually innovate and introduce new flavors and variants to cater to evolving consumer tastes. Additionally, CSDs are often associated with social gatherings, parties, and special occasions, contributing to their continued demand.
Non-Alcoholic Beverages Market By Distribution Channel
- Retail
- Food Service
- Online Stores
- Supermarkets and Hypermarkets
- Others
According to the non-alcoholic beverages market forecast, the online stores segment is expected to witness significant growth in the coming years. The rise of e-commerce and the increasing popularity of online shopping have provided consumers with convenient access to a wide range of non-alcoholic beverages, driving the growth of this segment. One of the key drivers behind the growth of online stores for non-alcoholic beverages is the convenience factor. Online platforms offer consumers the ability to browse and purchase their favorite beverages from the comfort of their homes or on the go through mobile devices. This convenience appeals to busy consumers who prefer the ease of ordering online and having their beverages delivered directly to their doorstep. The availability of various payment options and the ability to compare prices and product offerings from different brands further enhance the convenience and shopping experience. Moreover, the online channel provides a platform for beverage companies to showcase their product portfolios and reach a wider customer base.
Non-Alcoholic Beverages Market Regional Outlook
North America
- U.S.
- Canada
Europe
- U.K.
- Germany
- France
- Spain
- Rest of Europe
Asia-Pacific
- India
- Japan
- China
- Australia
- South Korea
- Rest of Asia-Pacific
Latin America
- Brazil
- Mexico
- Rest of Latin America
The Middle East & Africa
- South Africa
- GCC Countries
- Rest of the Middle East & Africa (ME&A)

Non-Alcoholic Beverages Market Regional Analysis
North America is a dominating region in the non-alcoholic beverages market for several reasons. One of the primary factors is the high consumption rate of non-alcoholic beverages in the region. North American consumers have a strong affinity for a wide variety of beverages, including carbonated soft drinks, juices, sports drinks, energy drinks, and bottled water. The culture of convenience and on-the-go consumption, coupled with a diverse and affluent population, has contributed to the robust demand for non-alcoholic beverages in North America. Furthermore, North America is home to several major beverage companies and global brands that have established a strong presence in the market. These companies have extensive distribution networks and marketing capabilities, allowing them to effectively reach consumers across the region. The strong brand recognition and marketing efforts of these companies, along with their ability to invest in product innovation, have helped them maintain a significant market share in North America.
Non-Alcoholic Beverages Market Player
Some of the top non-alcoholic beverages market companies offered in the professional report include The Coca-Cola Company, PepsiCo, Inc., Nestlé S.A., Keurig Dr. Pepper Inc., Danone S.A., Unilever PLC, Suntory Holdings Limited, Red Bull GmbH, Monster Beverage Corporation, The Kraft Heinz Company, Ocean Spray Cranberries, Inc., and Starbucks Corporation.
Frequently Asked Questions
What was the market size of the global non-alcoholic beverages in 2022?
The market size of non-alcoholic beverages was USD 813.3 Billion in 2022.
What is the CAGR of the global non-alcoholic beverages market from 2023 to 2032?
The CAGR of non-alcoholic beverages is 6.3% during the analysis period of 2023 to 2032.
Which are the key players in the non-alcoholic beverages market?
The key players operating in the global market are including The Coca-Cola Company, PepsiCo, Inc., Nestlé S.A., Keurig Dr. Pepper Inc., Danone S.A., Unilever PLC, Suntory Holdings Limited, Red Bull GmbH, Monster Beverage Corporation, The Kraft Heinz Company, Ocean Spray Cranberries, Inc., and Starbucks Corporation.
Which region dominated the global non-alcoholic beverages market share?
North America held the dominating position in non-alcoholic beverages industry during the analysis period of 2023 to 2032.
Which region registered fastest CAGR from 2023 to 2032?
Asia-Pacific region exhibited fastest growing CAGR for market of non-alcoholic beverages during the analysis period of 2023 to 2032.
What are the current trends and dynamics in the global non-alcoholic beverages industry?
The current trends and dynamics in the non-alcoholic beverages market growth include increasing health consciousness and the demand for healthier beverage options, and growing awareness of the negative health effects of alcohol consumption.
Which product type held the maximum share in 2022?
The carbonated soft drinks product type held the maximum share of the non-alcoholic beverages industry.


