Ngs Services Market | Acumen Research and Consulting
NGS Services Market Size - Global Industry, Share, Analysis, Trends and Forecast 2022 - 2030
Published :
Report ID:
Pages :
Format : ![]()
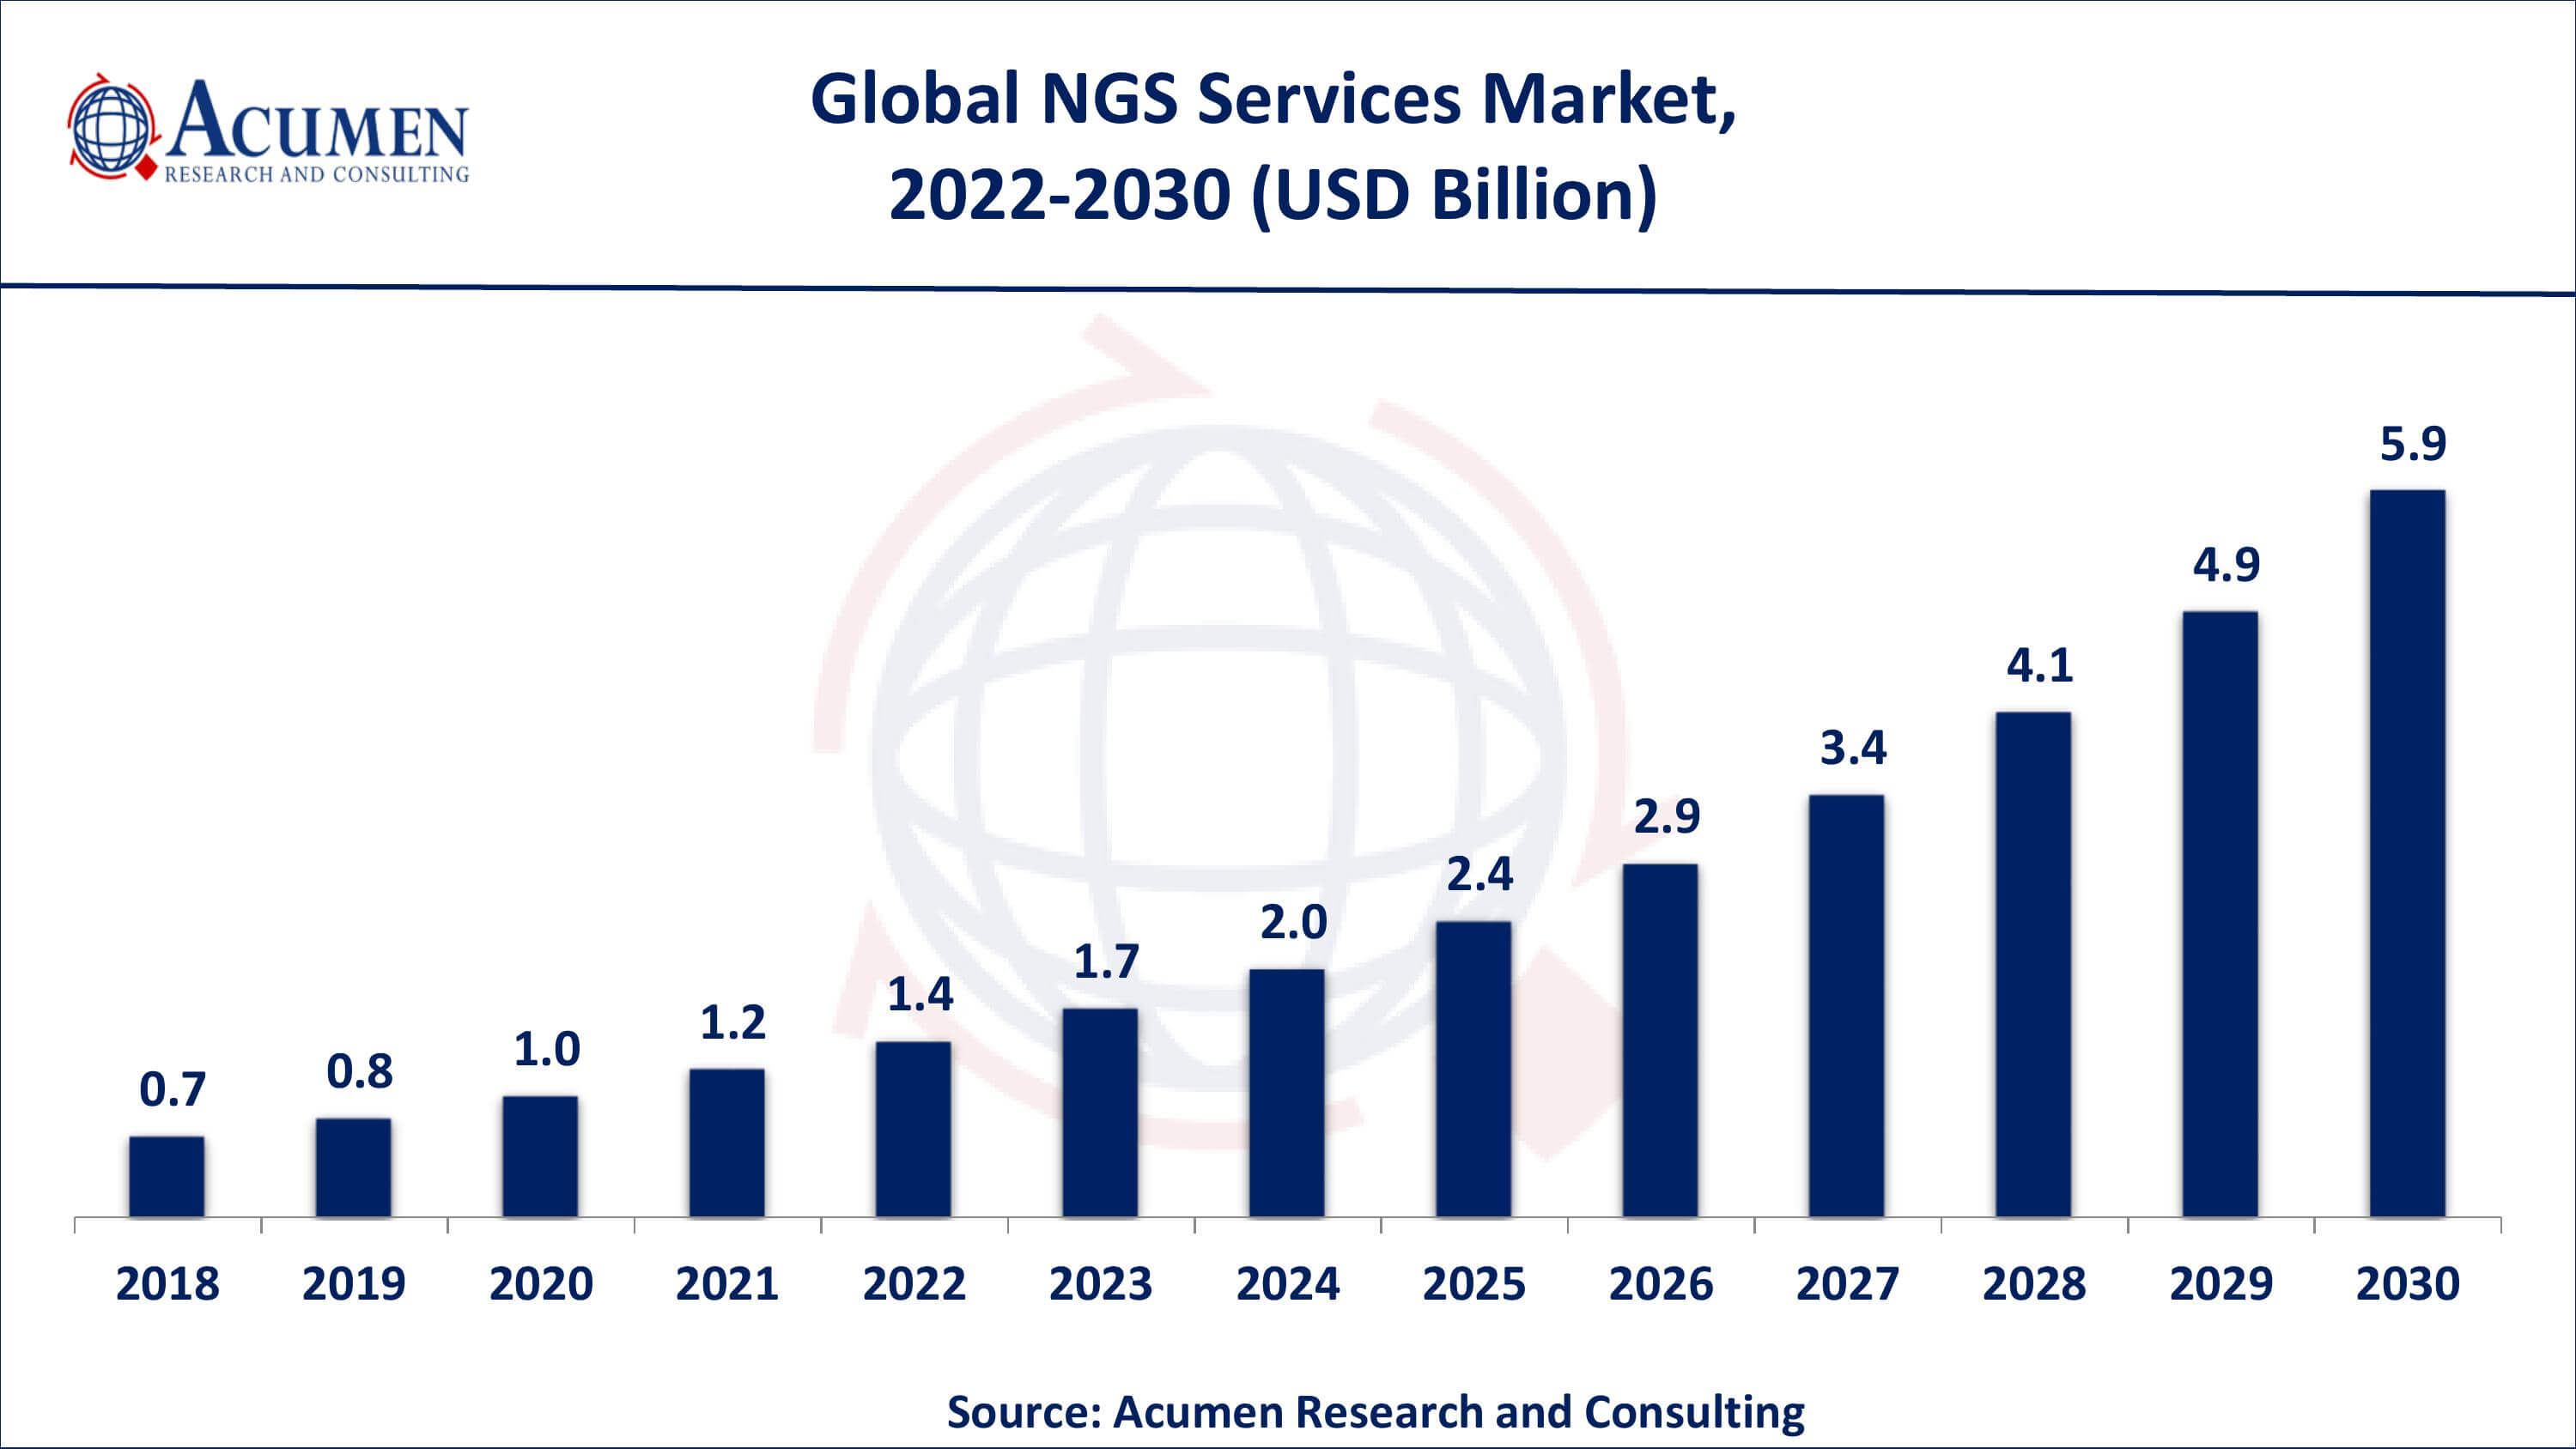
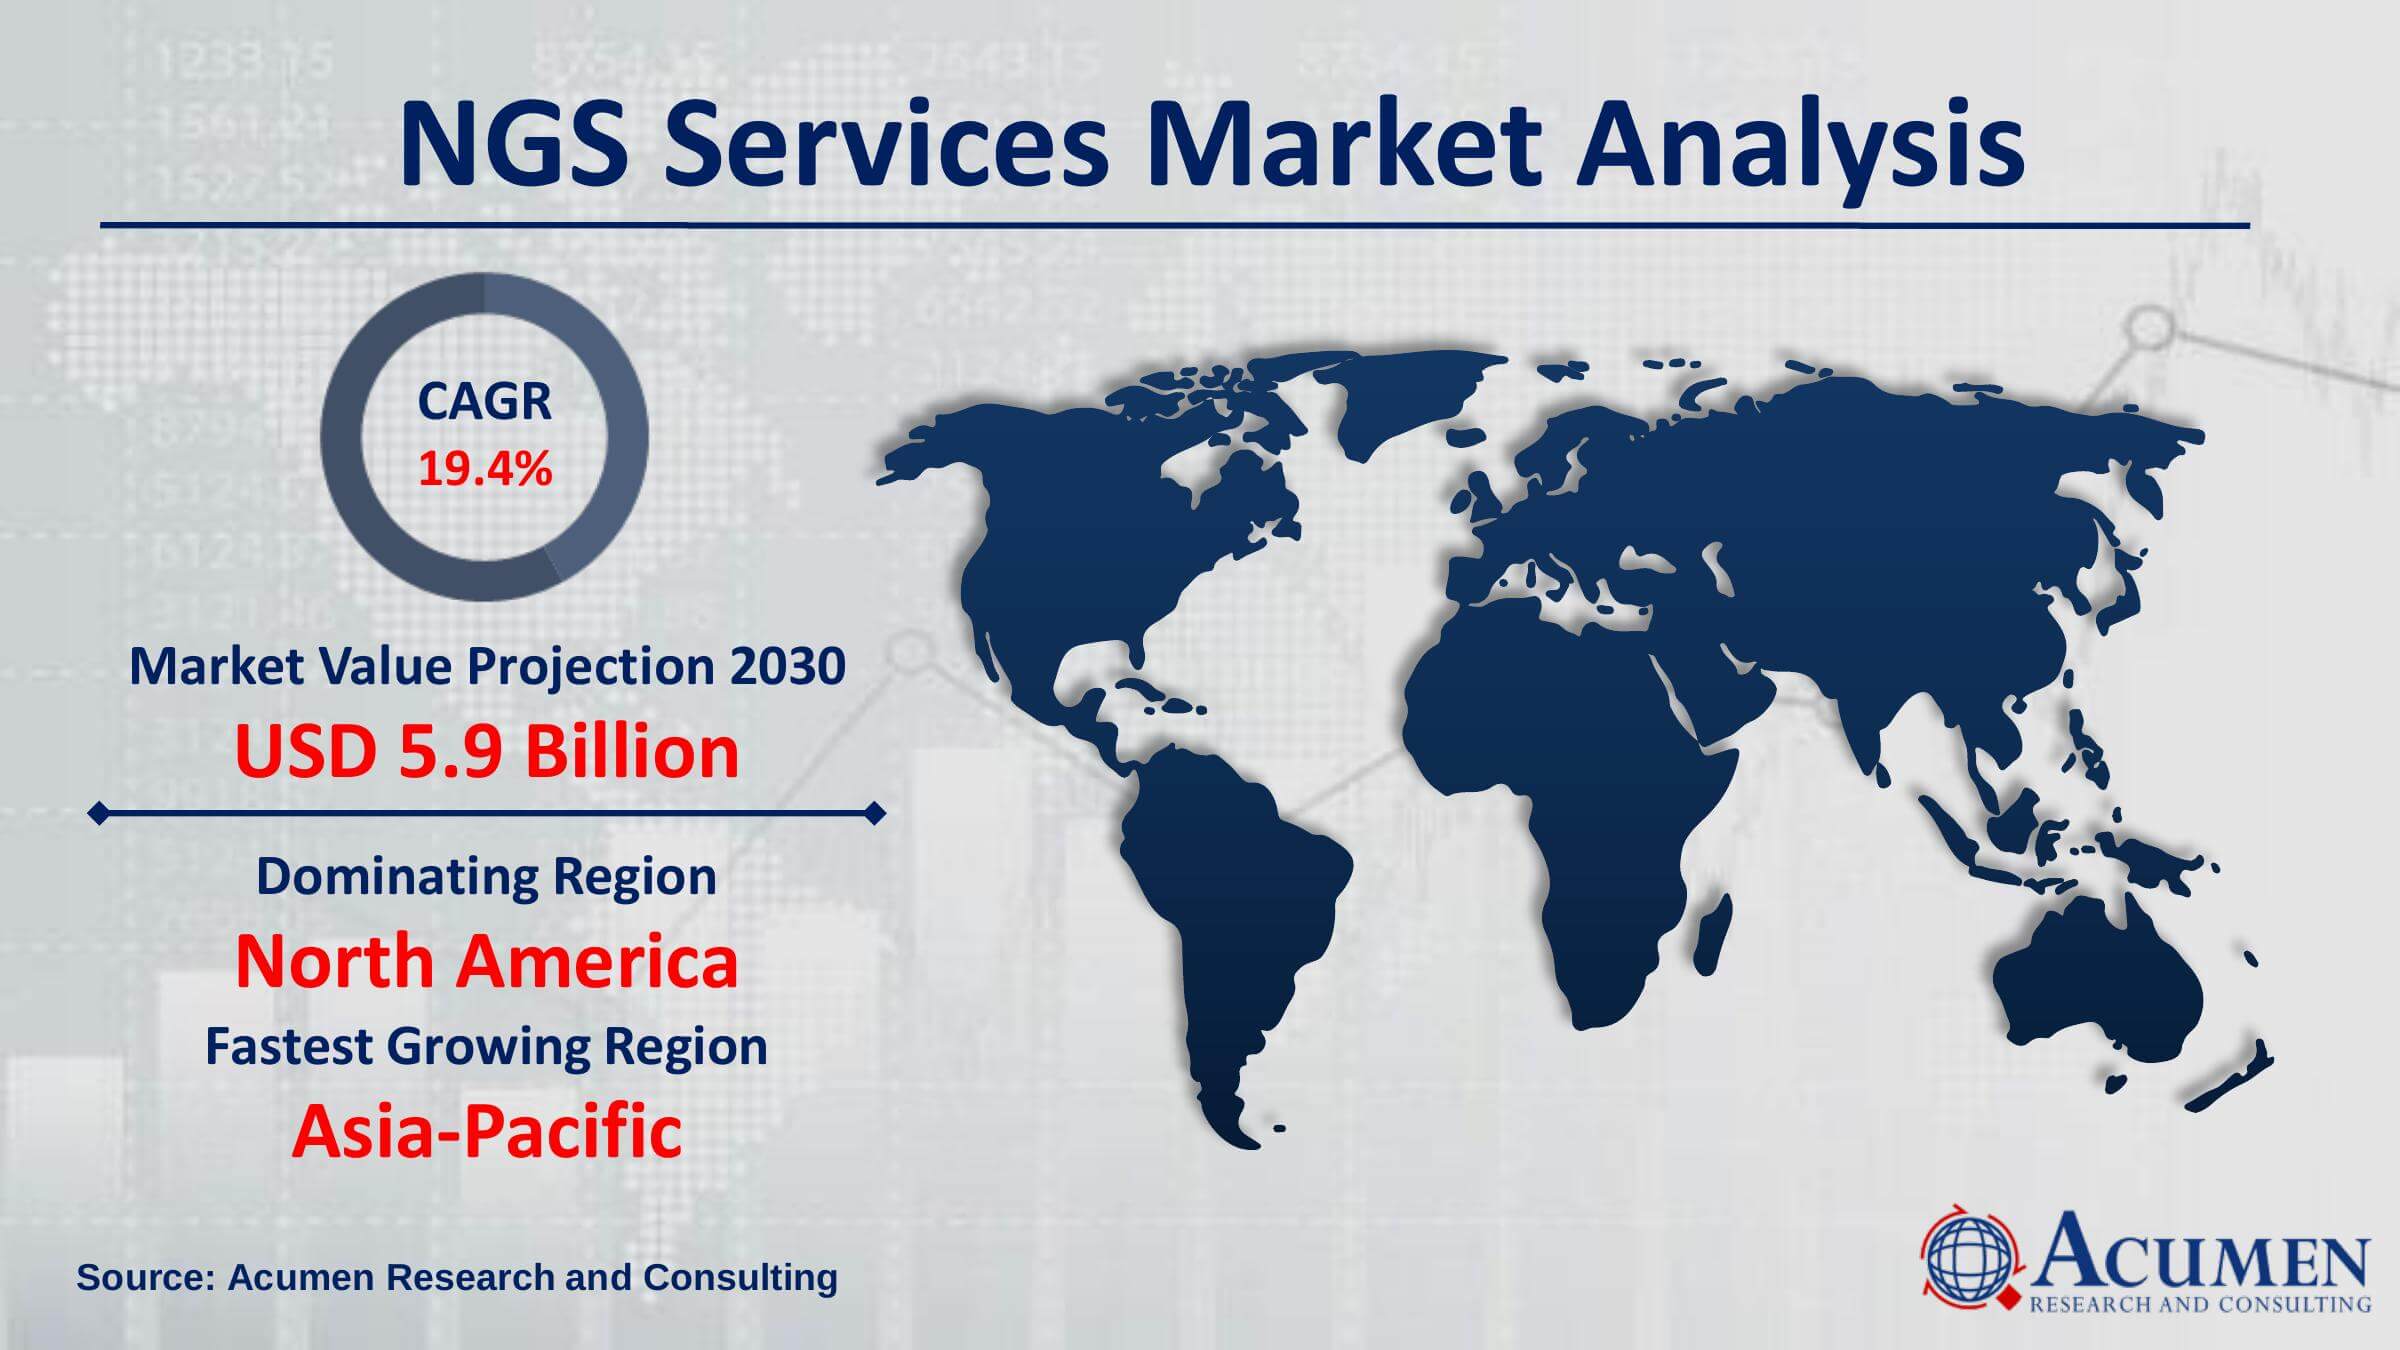
The Global NGS Services Market Size accounted for USD 1.2 Billion in 2021 and is projected to achieve a market size of USD 5.9 Billion by 2030 rising at a CAGR of 19.4% from 2022 to 2030. The market is driven by increase in demand for better sequencing products drive the need for better NGS services. Growth of NGS technologies has transformed gene sequencing in terms of reproducibility and cost savings. This has resulted in introduction of numerous progressions in NGS technology to encourage its usage in hospitals and Sequencing labs. Most current novelties in this field revolve around simplifying usage of seq-technology and making it classier. These parameters have boosted the uptake of NGS services across numerous end users.
NGS Services Market Report Statistics
- Global NGS services market revenue is estimated to reach USD 5.9 Billion by 2030 with a CAGR of 19.4% from 2022 to 2030
- North America NGS services market share generated over 45% shares in 2021
- According to the CDC, the US government allocated funds USD 1.7 billion to the CDC from the American Rescue Plan of 2021 to improve genomic sequencing capabilities
- Asia-Pacific NGS services market growth will record substantial CAGR from 2022 to 2030
- Based on service type, human genome sequencing captured over 30% of the overall market share in 2021
- Among end-use, universities and other research entities occupied more than 53% of the market share from 2022 to 2030
- Surging advancements in sequencing data analytics is a popular NGS services market trend that is fueling the industry demand
Global NGS Services Market Dynamics
Market Drivers
- Increasing prevalence of cancer
- Rising approvals and development of new targeted therapies
- Decreasing cost of sequencing procedures
- Rapid advancements in next generation sequencing (NGS) service
Market Restraints
- Availability of substitute technologies
- Lack of qualified professional for sample preparation
Market Opportunities
- Growing application in cancer and agrigenomics research
- Increasing strategies undertaken for the implementation of Sequencing NGS
NGS Services Market Report Coverage
| Market | NGS Services Market |
| NGS Services Market Size 2021 | USD 1.2 Billion |
| NGS Services Market Forecast 2030 | USD 5.9 Billion |
| NGS Services Market CAGR During 2022 - 2030 | 19.4% |
| NGS Services Market Analysis Period | 2018 - 2030 |
| NGS Services Market Base Year | 2021 |
| NGS Services Market Forecast Data | 2022 - 2030 |
| Segments Covered | By Service Type, By Workflow, End-Use, And By Geography |
| Regional Scope | North America, Europe, Asia Pacific, Latin America, and Middle East & Africa |
| Key Companies Profiled | GENEWIZ Germany GmbH, Illumina, Inc., Novogene Corporation, abm Inc., Veritas Genetics, Quest Diagnostics, Gene by Gene, ARUP Laboratories, BGI, and Lucigen. |
| Report Coverage |
Market Trends, Drivers, Restraints, Competitive Analysis, Player Profiling, Regulation Analysis |
NGS Services Market Growth Factors
Rising need for robust sequencing-based diagnostics has resulted in the beginning of new seq-technologies, ranging from high-throughput sequencers to portable units. This has stimulated the trend of Sequencing NGS in over the coming years. Such as, in March 2018, ARUP Laboratories and IDbyDNA, Inc. launched Explify Respiratory, an NGS test for respiratory infections, to assist physicians in screening patients with pneumonia and other respiratory illnesses.
In addition, decreasing cost of sequencing procedures is driving the next-generation sequencing services market. Similarly, rising approvals for new targeted therapies is one of the next-gen sequencing services market trends that is generating significant revenue. However, regulatory and standardization concerns in diagnostic testing is restraining the next-generation sequencing (NGS) services market growth. Furthermore, increasing prevalence of cancer is expected to gain significant impetus for the next-generation sequencing services market.
NGS Services Market Insights
Traditional disease testing service producers have widened their portfolio with an increasing trend of seq-based genetic tests. For instance, ARUP Laboratories integrated with the Children’s Hospital of Philadelphia (CHOP) in October 2014. The service provision for NGS-based HLA genotyping, comprise of HLA Class I, and HLA Class II and began in November 2017.
With increasing trend of high throughput sequencing within the biotech and pharma industry, there is a demand for more growths to advance the speed and convenience of high throughput seq-platforms and simplify workflows. As a result, businesses are concentrating on growth of solutions to simplify the purification and amplification of sample and starting input.

NGS Services Market Segmentation
The global NGS services market is segmented based on service type, workflow, end-use, and geography.
NGS Services Market By Service Type
- Human Genome Sequencing
- Single Cell Sequencing
- Gene Regulation Services
- Small RNA Sequencing
- ChIP Sequencing
- Other Gene Regulation-Based Services
- Animal & Plant Sequencing
- Other Sequencing Services
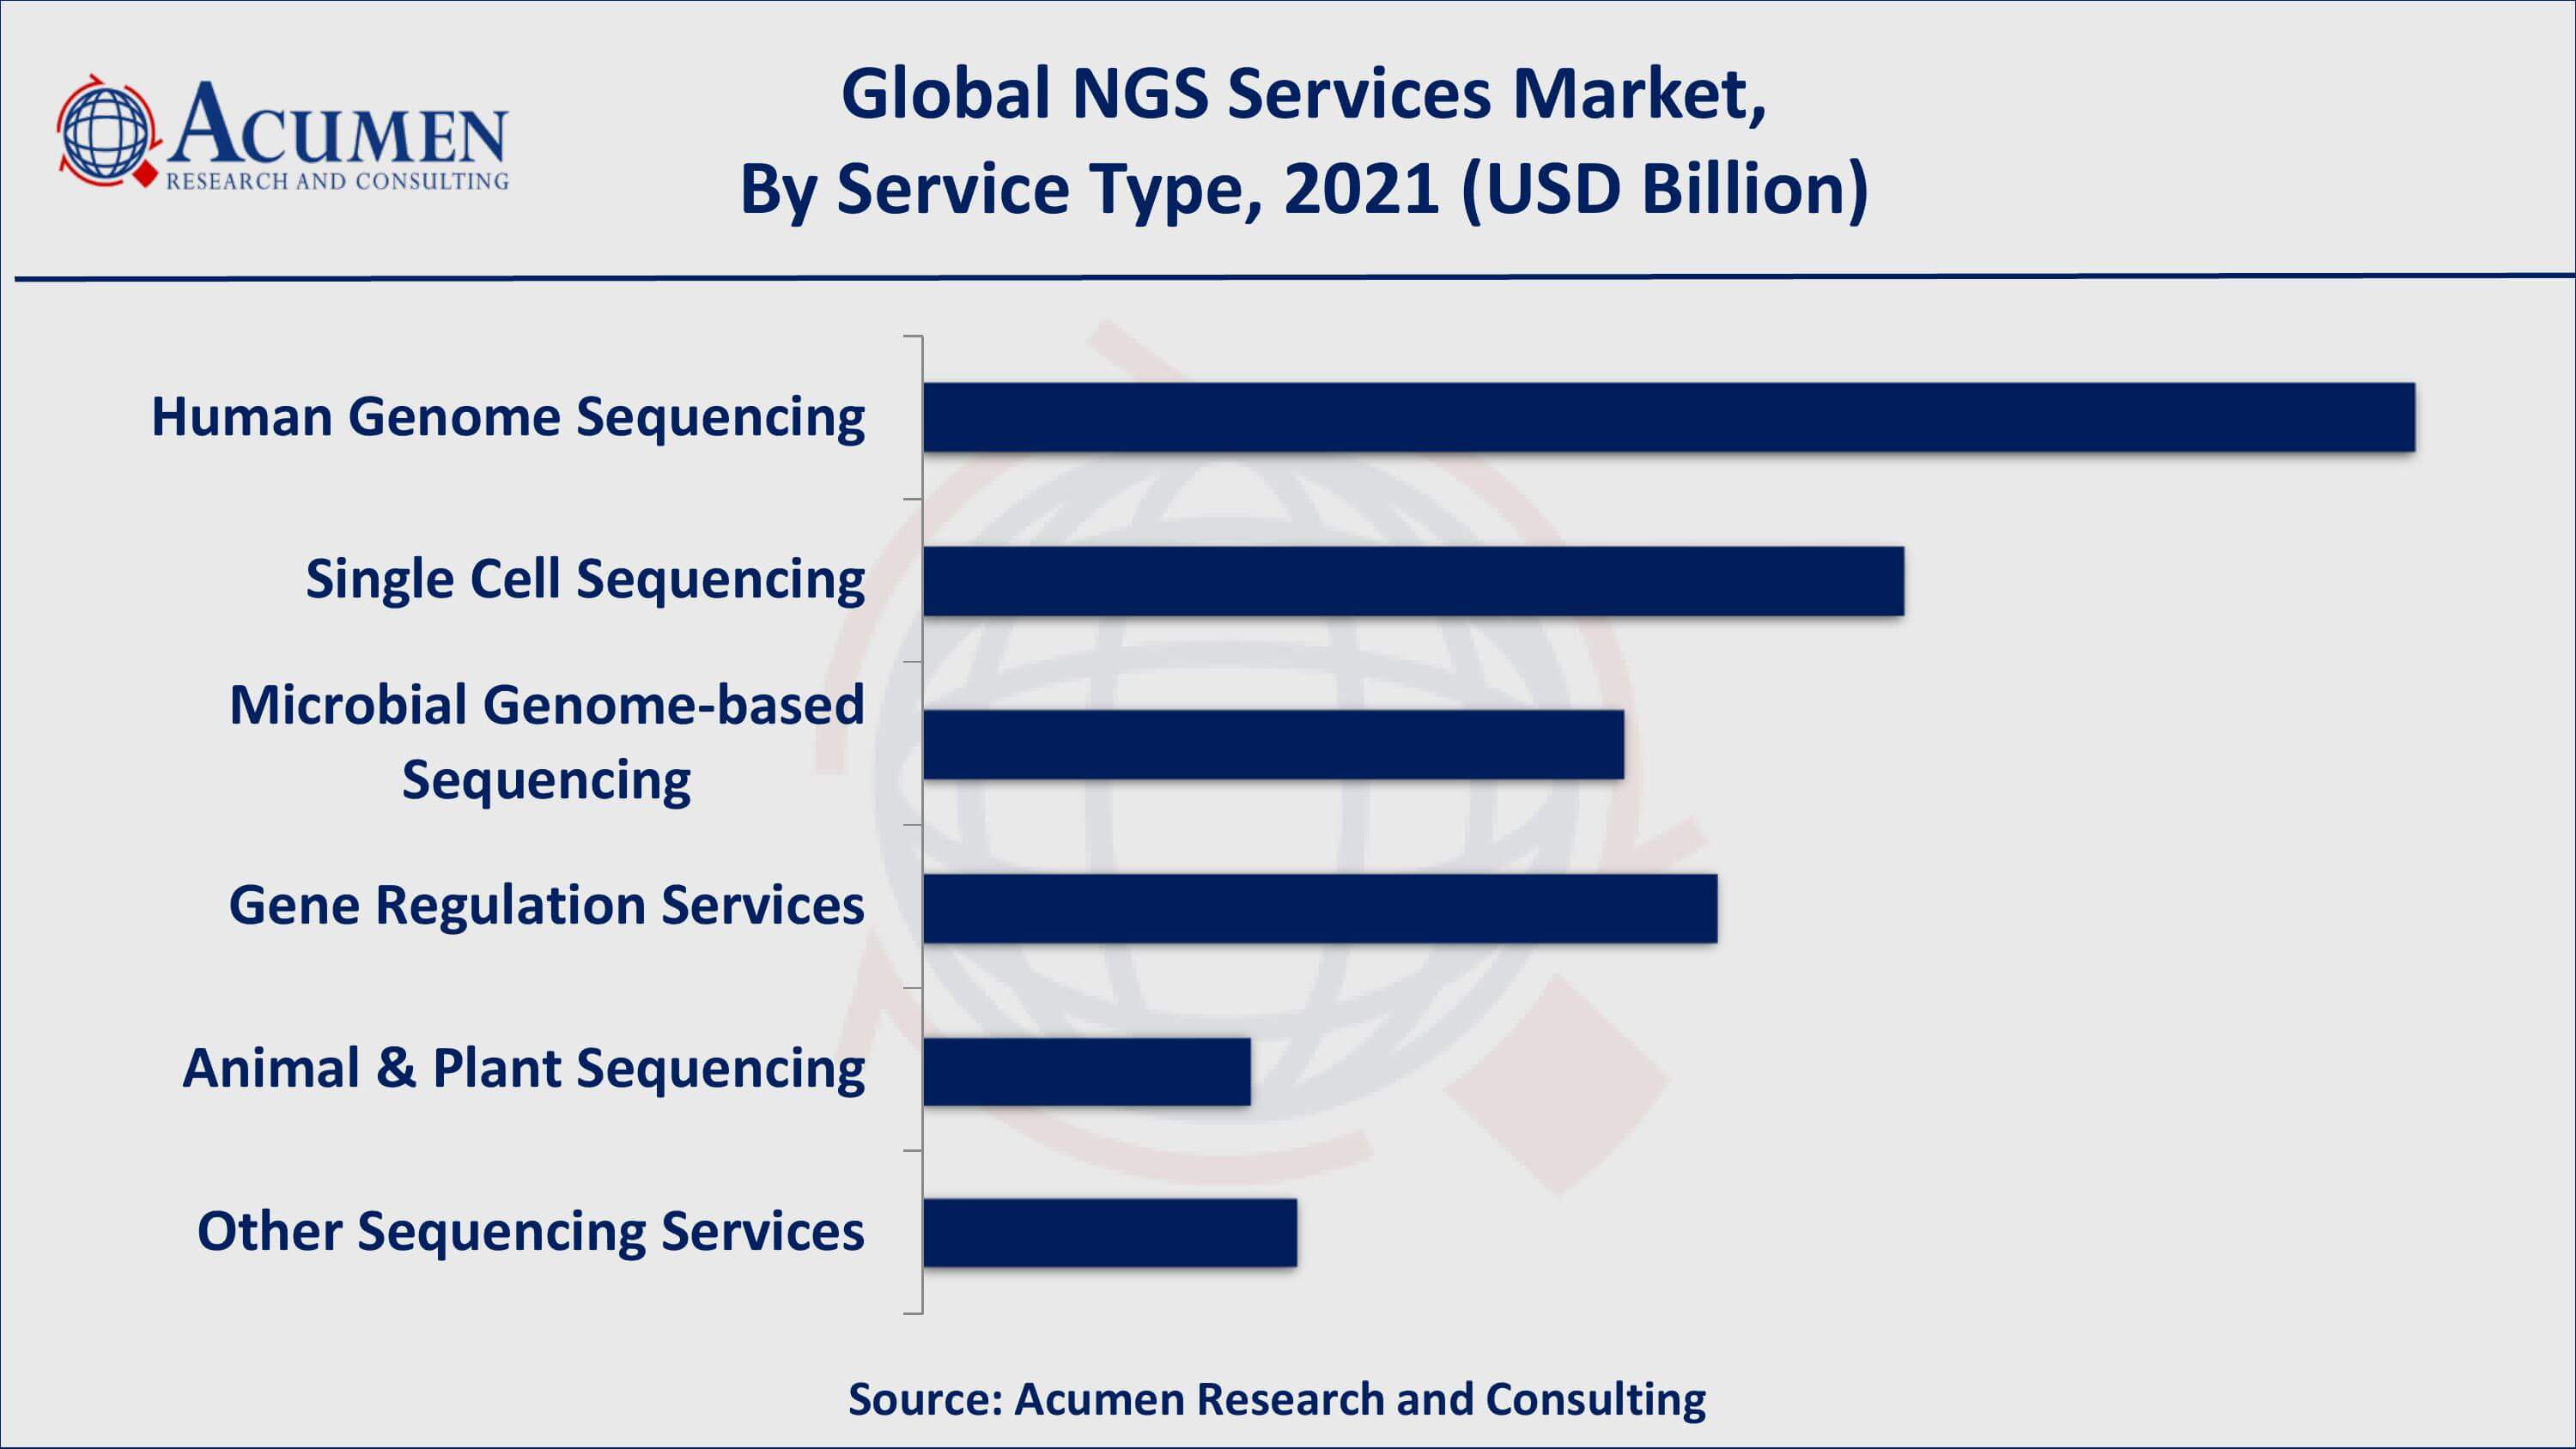
According to the NGS services industry analysis, human genome sequencing sub-segment grabbed the maximum revenue in 2021 and is expected to do so in the coming years. The Human Genome Project is one of the most significant scientific achievements in history. The project was a journey of biological discovery guided by an international group of scientists who wanted to investigate all of the DNA (known as a genome) of a specific set of organisms in depth. On the other hand, gene regulation is expected to gain significant impetus during the projected timeframe from 2022 to 2030.
NGS Services Market By Workflow
- Pre-Sequencing
- Sequencing
- Data Analysis
As per NGS services market forecast, the sequencing sub-segment accounted for more than half of the total market shares over the estimated timeframe of 2022 to 2030. NGS services on the market cover all aspects of sequencing, from consultation to final result derivation. Some companies provide comprehensive protocol, while others provide stand-alone services to customers who have a lab equipped with NGS facilities but want to outsource some aspects of the NGS workflow.
NGS Services Market By End-Use
- Universities and Other Research Entities
- Hospitals & Clinics
- Pharma & Biotech Entities
- Others
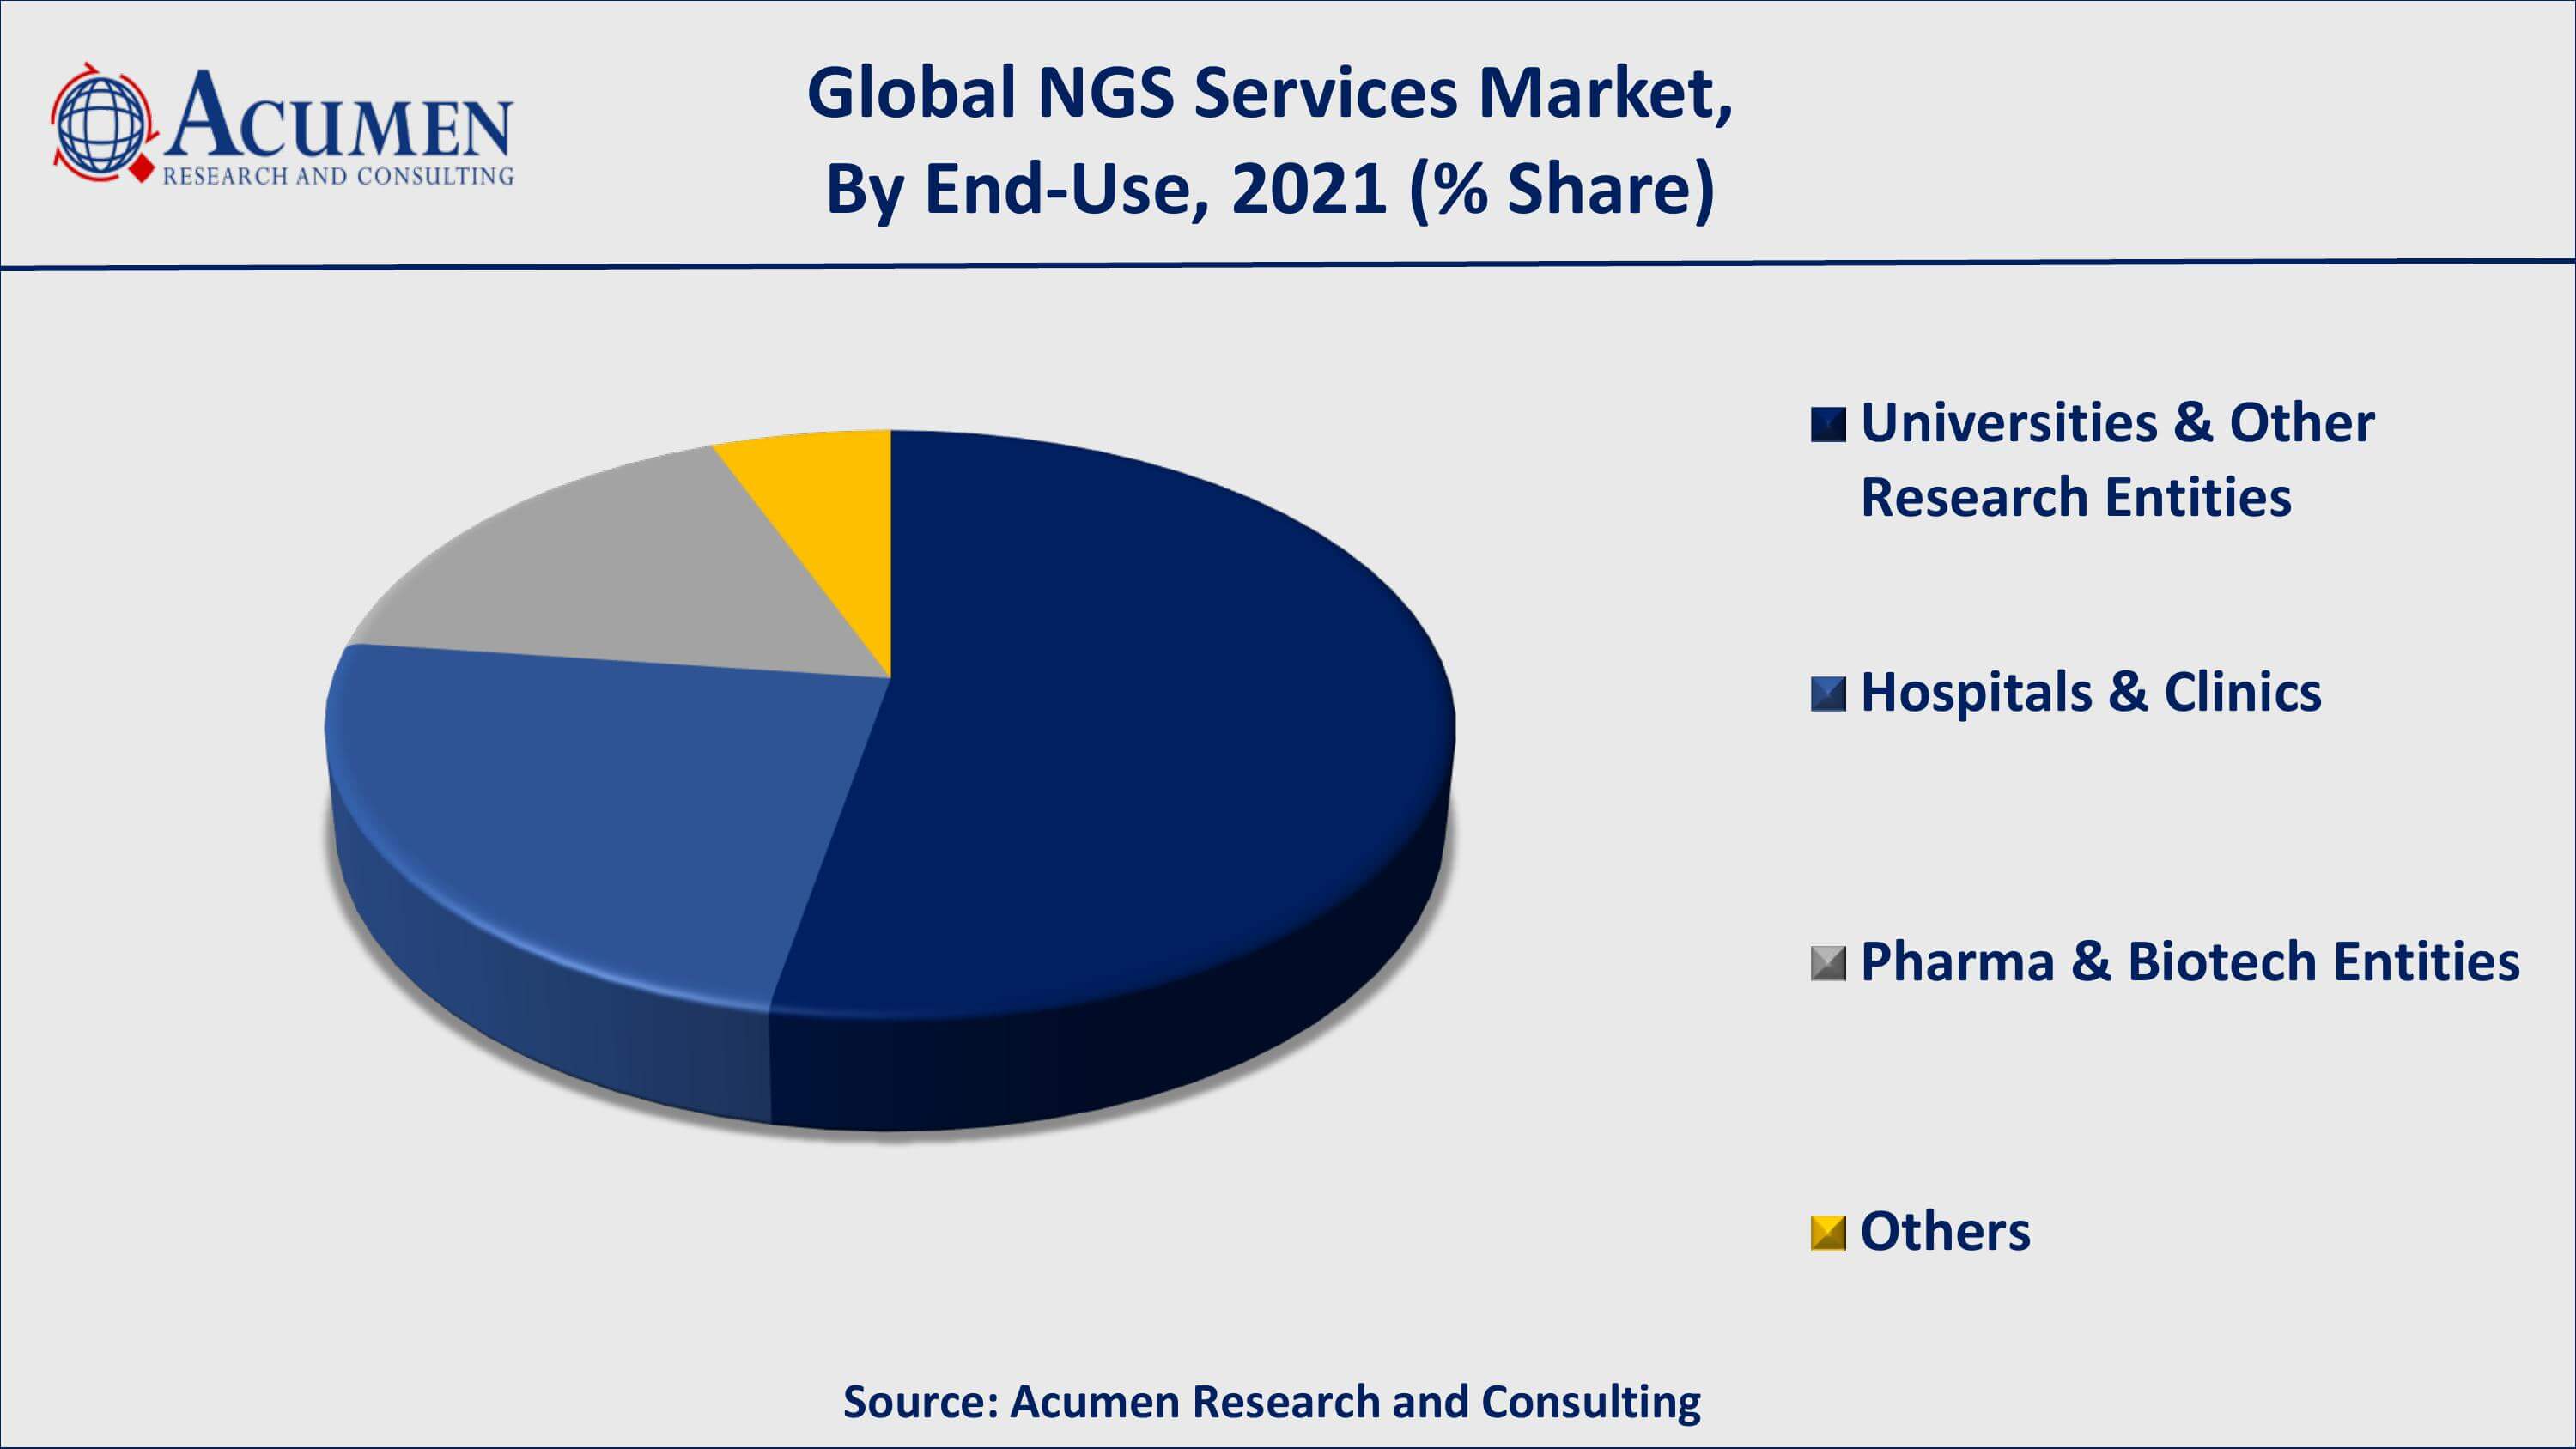
Based on end-use segment, universities and other research entities would conquer a bulk market share from 2022 to 2030. The high growth in the segment is witnessed as next-gen sequencing services are primarily being used for research purposes. Besides, due to the rising trend of NGS services all over the world, the demand among hospitals and clinics is also likely to increase throughout the forecast period. Pharma & biotech entities are also gaining significant impetus in the forthcoming years.
NGS Services Market Regional Outlook
North America
- U.S.
- Canada
Europe
- U.K.
- Germany
- France
- Spain
- Rest of Europe
Asia-Pacific
- India
- Japan
- China
- Australia
- South Korea
- Rest of Asia-Pacific
Latin America
- Brazil
- Mexico
- Rest of Latin America
The Middle East & Africa
- South Africa
- GCC Countries
- Rest of the Middle East & Africa (ME&A)
NGS Services Market Regional Analysis
North America captures the largest share due to factors for instance, well-established informatics network, effective regulatory guidelines relating to usage and approval of genetic tests, and occurrence of market leaders in the region. Also, rising numeral of FDA-approved genomic tests in U.S. is expected to boost the regional market during the forthcoming years.
The Asia-Pacific industry is estimated to serve as an opportunity source of revenue through 2030. Rising attention of government bodies regarding maintenance of public health and consequential funds in growth of progressive diagnostic methods is expected to drive the uptake of seq-services in the region.
NGS Services Market Players
Market companies are concentrating on implementing new strategies for instance regional expansion, partnerships, mergers and acquisitions, new product launches, and distribution agreements to surge their revenue share. The major players associated with the NGS Services market are GENEWIZ Germany GmbH, Illumina, Inc., Novogene Corporation, ABM Inc., Veritas Genetics, Quest Diagnostics, Gene by Gene, ARUP Laboratories, BGI, and Lucigen.
Frequently Asked Questions
What is the size of global NGS services market in 2021?
The market size of NGS services market in 2021 was accounted to be USD 1.2 Billion.
What is the CAGR of global NGS services market during forecast period of 2022 to 2030?
The projected CAGR of NGS services market during the analysis period of 2022 to 2030 is 19.4%.
Which are the key players operating in the market?
The prominent players of the global NGS services market include GENEWIZ Germany GmbH, Illumina, Inc., Novogene Corporation, ABM Inc., Veritas Genetics, Quest Diagnostics, Gene by Gene, ARUP Laboratories, BGI, and Lucigen.
Which region held the dominating position in the global NGS services market?
North America held the dominating NGS services during the analysis period of 2022 to 2030.
Which region registered the fastest growing CAGR for the forecast period of 2022 to 2030?
Asia-Pacific region exhibited fastest growing CAGR for NGS services during the analysis period of 2022 to 2030.
What are the current trends and dynamics in the global NGS services market?
Increasing prevalence of cancer, rising approvals and development of new targeted therapies, and decreasing cost of sequencing procedures drives the growth of global NGS services market.
Which workflow held the maximum share in 2021?
Based on workflow, sequencing segment is expected to hold the maximum share NGS services market.


