Next Generation Sequencing Market Size - Global Industry, Share, Analysis, Trends and Forecast 2024 - 2032
Published :
Report ID:
Pages :
Format :
Next Generation Sequencing Market Size - Global Industry, Share, Analysis, Trends and Forecast 2024 - 2032
Report Coverage
- Industry Dynamics
- Market Size and Forecast Data
- Segment Analysis
- Competitive Landscape
- Regional Analysis with a Niche Focus on Country-Level Data
- High Level Analysis - Porter's, PESTEL, Value Chain, etc.
- Company Profiles of Key Players
- Option to Customize the Report As Per Your Specific Need
Request Sample Report
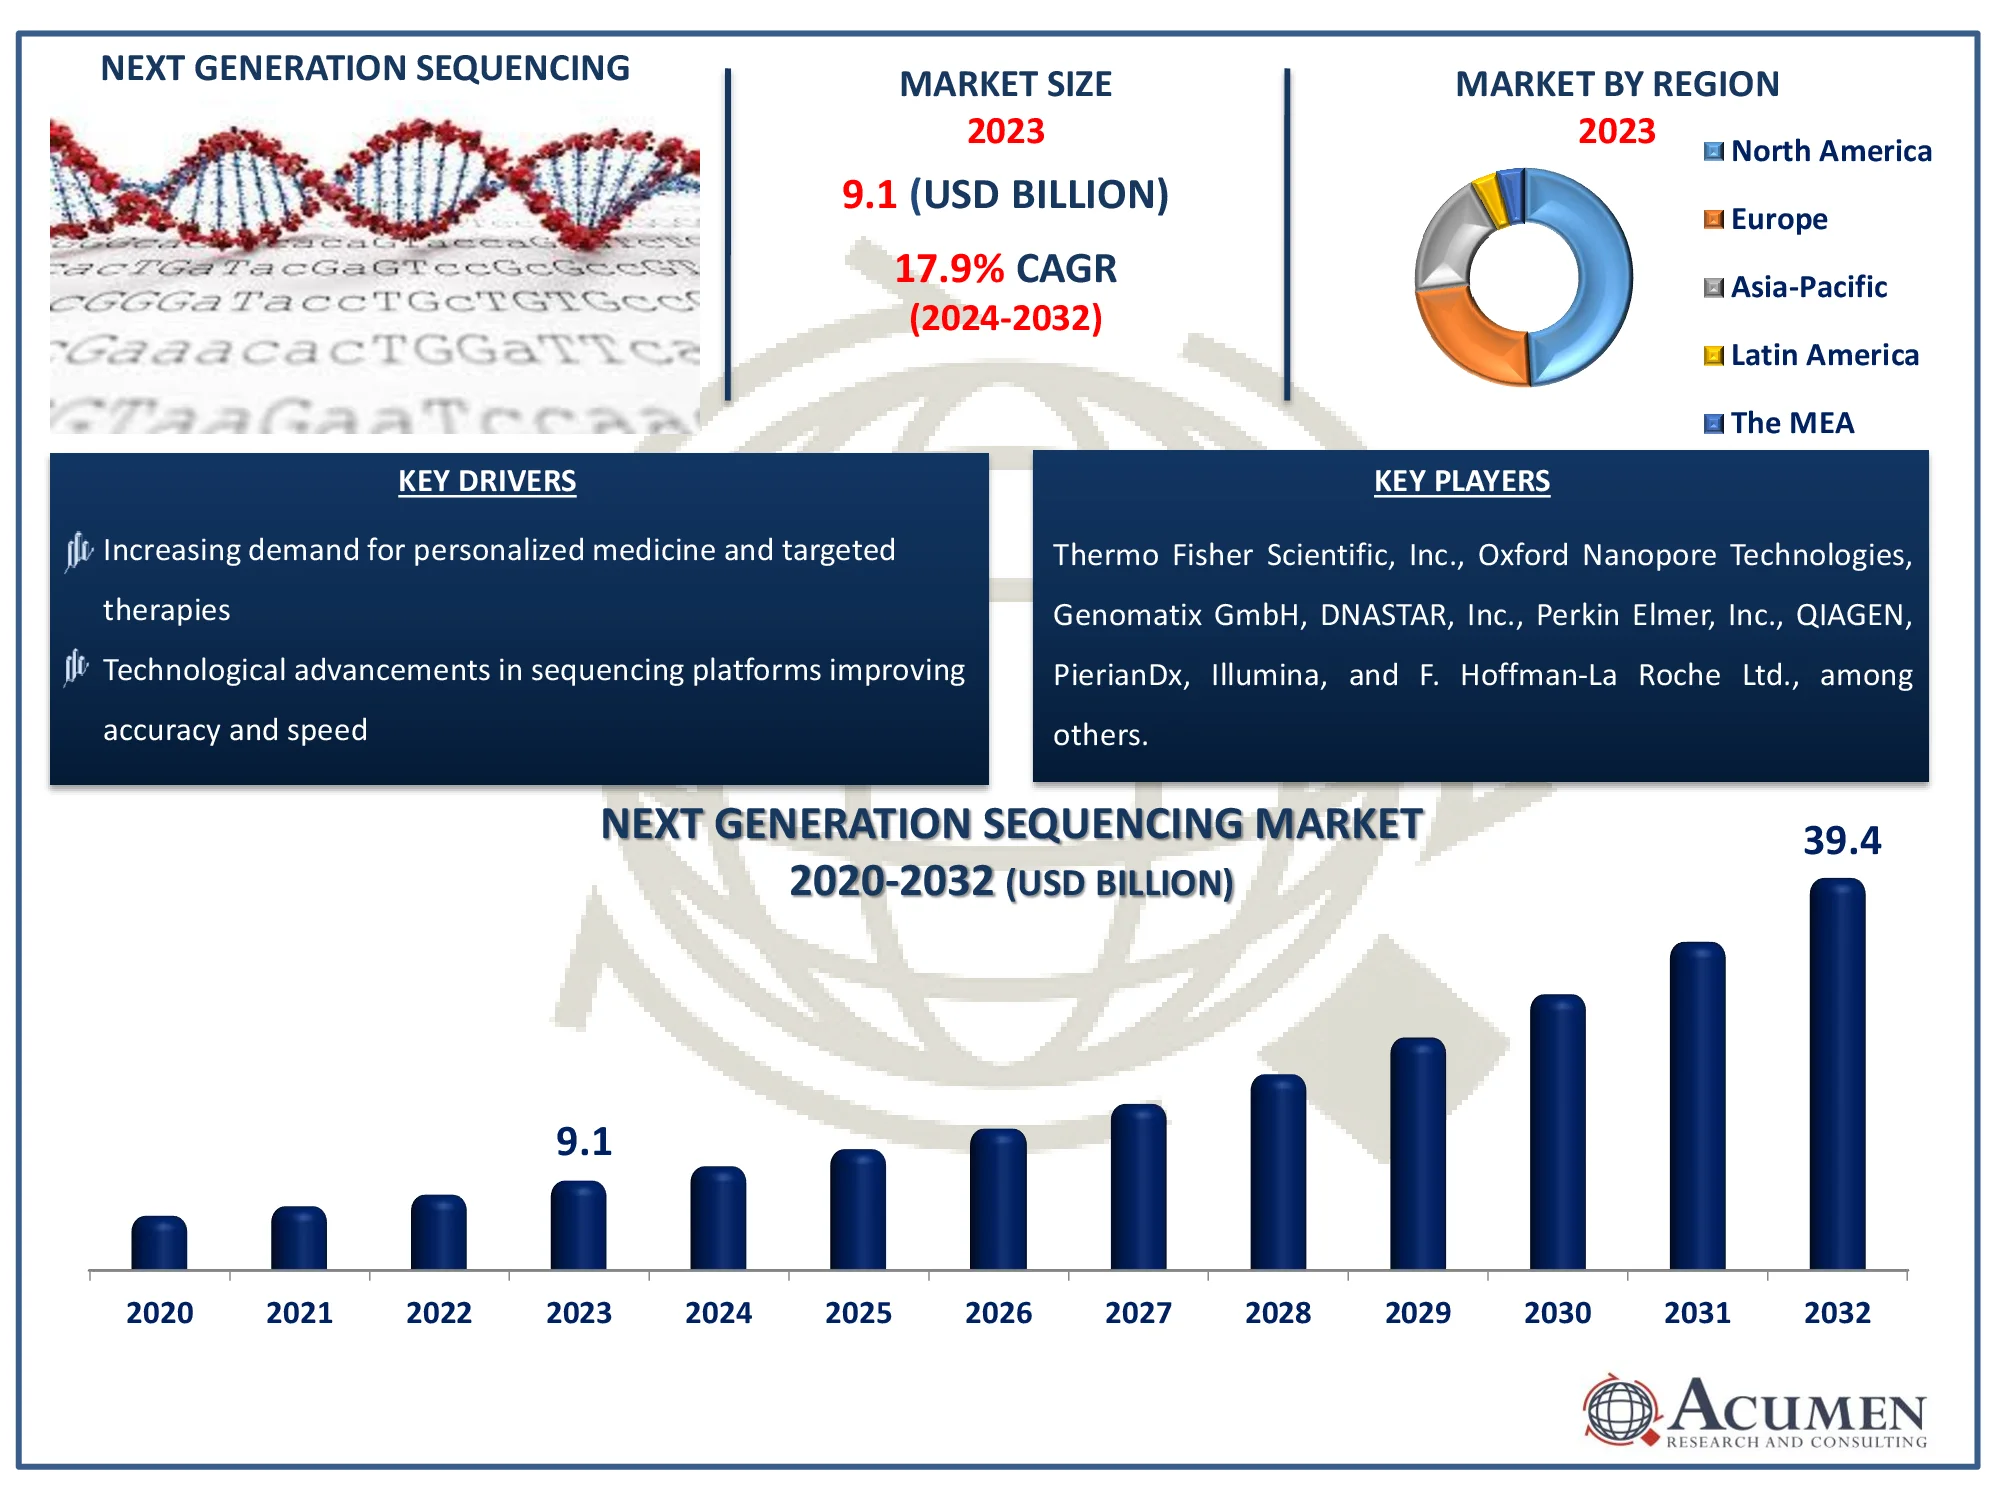
The Global Next Generation Sequencing Market Size accounted for USD 9.1 Billion in 2023 and is estimated to achieve a market size of USD 39.4 Billion by 2032 growing at a CAGR of 17.9% from 2024 to 2032.
Next Generation Sequencing Market Highlights
- Global next generation sequencing market revenue is poised to garner USD 39.4 billion by 2032 with a CAGR of 17.9% from 2024 to 2032
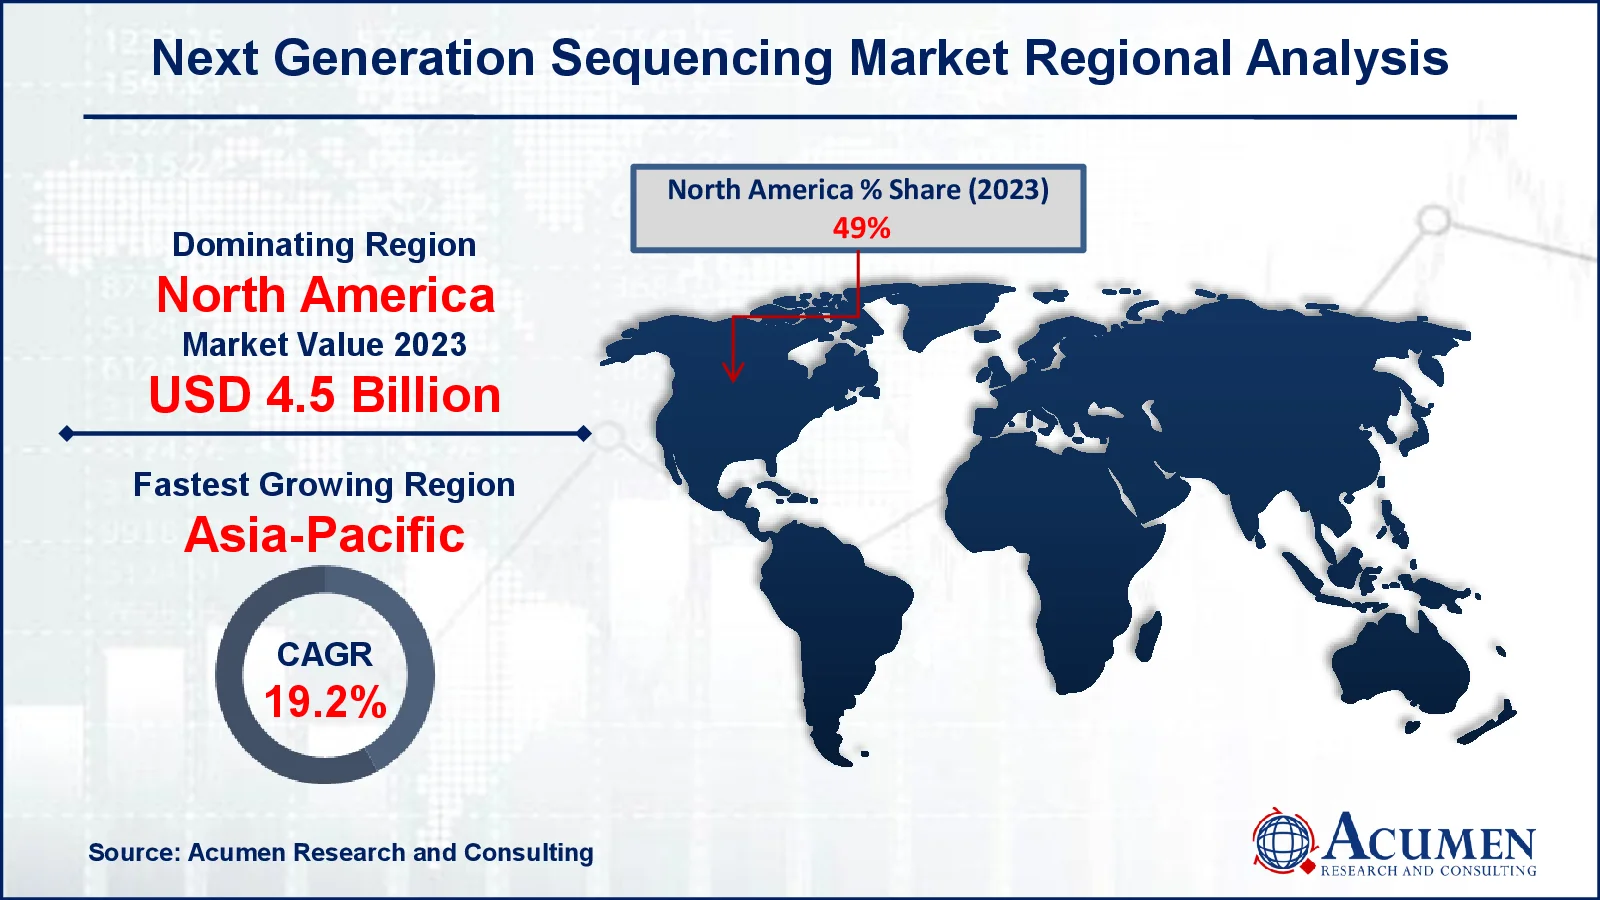
- North America next generation sequencing market value occupied around USD 4.5 billion in 2023
- Asia-Pacific next generation sequencing market growth will record a CAGR of more than 19.2% from 2024 to 2032
- Among application, the oncology sub-segment generated around USD 2.5 billion revenue in 2023
- Based on end user, the academic research sub-segment generated 30% next generation sequencing market share in 2023
- Rising collaborations between research institutes and biotech companies is a popular next generation sequencing market trend that fuels the industry demand

Next generation sequencing (NGS) is a platform that can sequence hundreds of thousands or millions of DNA molecules at once. It is sometimes called "massively parallel sequencing technology." Because of its ability to sequence several persons at the same time, this sequencing is useful in a variety of sectors, including personalized medicine, clinical diagnostics, and genetic illnesses. This technique is widely used in genomics, transcriptomics, and epigenomics to identify genetic variants, study gene expression, and detect mutations. Whole-genome, targeted, and RNA sequencing are all useful methodologies. NGS has become a cornerstone of modern molecular biology, driving innovation and discovery in a variety of scientific fields.
Global Next Generation Sequencing Market Dynamics
Market Drivers
- Increasing demand for personalized medicine and targeted therapies
- Technological advancements in sequencing platforms improving accuracy and speed
- Rising prevalence of genetic disorders and cancers worldwide
- Decreasing costs of sequencing, making it more accessible
Market Restraints
- High initial investment and maintenance costs of sequencing equipment
- Ethical concerns regarding genetic data privacy and usage
- Limited availability of trained professionals to interpret sequencing data
Market Opportunities
- Growth in genomic research initiatives and precision medicine
- Expanding applications in prenatal testing and oncology diagnostics
- Increased use of next-generation sequencing in drug discovery
Next Generation Sequencing Market Report Coverage
|
Market |
Next Generation Sequencing Market |
|
Next Generation Sequencing Market Size 2023 |
USD 9.1 Billion |
|
Next Generation Sequencing Market Forecast 2032 |
USD 39.4 Billion |
|
Next Generation Sequencing Market CAGR During 2024 - 2032 |
17.9% |
|
Next Generation Sequencing Market Analysis Period |
2020 - 2032 |
|
Next Generation Sequencing Market Base Year |
2023 |
|
Next Generation Sequencing Market Forecast Data |
2024 - 2032 |
|
Segments Covered |
By Product, By Technology, By Workflow, By Application, By End User, and By Geography |
|
Regional Scope |
North America, Europe, Asia Pacific, Latin America, and Middle East & Africa |
|
Key Companies Profiled |
Thermo Fisher Scientific, Inc., Oxford Nanopore Technologies, Genomatix GmbH, DNASTAR, Inc., Perkin Elmer, Inc., QIAGEN, Bio-Rad Laboratories, Inc., PierianDx, Illumina, and F. Hoffman-La Roche Ltd. |
|
Report Coverage |
Market Trends, Drivers, Restraints, Competitive Analysis, Player Profiling, Covid-19 Analysis, Regulation Analysis |
Next Generation Sequencing Market Insights
Continuous technological innovations in next generation sequencing platforms and software is responsible for the entry of efficient, effective, easy to use, and portable products in the market. Significant investment in R&D by market players leads to availability of platforms that provide accurate and faster results. The advancement in the bioinformatics area also enhances the adoption of NGS technology in diagnosis and analysis of rare diseases, for prenatal testing, and identifying therapeutic targets.
Significant decline in the cost of NGS to USD 1,000 - 1200 per genome from USD 95.26 million in 2001 and USD 108.1 thousand in 2009 will boost the market growth. This reduction of cost is majorly attributed to the significant decline in the installation cost of sequencing platforms. This is also anticipated to have a positive impact on the demand for NGS techniques. Development, approvals, and commercialization of innovative products and services by key market players is also expected to propel the growth. For instance Illumina launched iSeq 100 Sequencing System. This new, NGS system provides high accuracy at low capital cost and hence making this technology available at any lab.
 Next Generation Sequencing Market Segmentation
The worldwide market for next generation sequencing is split based on product, technology, workflow, application, end users, and geography.
Next Generation Sequencing Market By Product
- Platform
- Data Analysis
- Sequencing
- Consumables
- Target Enrichment
- Sample Preparation
- Others
According to next generation sequencing industry analysis, consumables are the largest product sector in the market because they play such an important role in sequencing workflow support. Consumables comprise chemicals, primers, buffers, and sequencing kits, which are required for sample preparation, amplification, and sequencing. These devices are widely utilized in NGS applications across a variety of industries, including genomics, diagnostics, and personalized medicine. As the demand for genetic research and clinical diagnostics increases, so does the demand for consumables, which contribute significantly to market revenue. Furthermore, consumables are consumable in nature, necessitating frequent replenishment, resulting in recurring demand and consolidating their dominant position in the NGS industry.
Next Generation Sequencing Market By Technology
- Whole Genome Sequencing (WGS)
- Targeted Sequencing & Resequencing
- Whole Exome Sequencing
Based on the technology, the market has been segmented into whole genome sequencing, targeted sequencing & resequencing, and whole exome sequencing. In 2023, targeted sequencing and resequencing accounted for the largest share of the market due to its ability of rapid and cost-effective detection of known variants in selected genes. However, demand for the whole genome sequencing is anticipated to increase with the fastest rate during the forecast period.
Next Generation Sequencing Market By Workflow
- Sequencing
- Pre-Sequencing
- NGS Data Analysis
Sequencing dominates the next generation sequencing (NGS) market due to its vital role in generating high-throughput genomic data. This method includes reading DNA or RNA sequences, which allows researchers to find genetic variants, mutations, and other important biomarkers. Sequencing technologies, such as Illumina and Oxford Nanopore, offer fast and inexpensive ways to decode genomes, which is critical for applications such as customized medicine, diagnostics, and research. The increasing demand for precise, scalable, and high-quality sequencing data to study complicated diseases and conditions has contributed to this segment's dominance in the NGS workflow, as it directly supports genomic research advances.
Next Generation Sequencing Market By Application
- Oncology
- Reproductive Health
- Clinical Investigation
- Immune System Monitoring
- Metagenomics, Epidemiology & Drug Development
- Agrigenomics & Forensics
- Consumer Genomics
Based on application, the NGS market is divided into oncology, reproductive health, clinical investigation, immune system monitoring, agriculture & animal research, epidemiology & drug development, and consumer genomics. Oncology held the maximum share of the market in 2023. High research in the field and lesser availability of alternative treatments are the key reasons for the dominance in the market.
Next Generation Sequencing Market By End User
- Clinical Research
- Academic Research
- Pharma & Biotech Entities
- Hospitals & Clinics
- Others
On the basis of end user, the NGS market is subsegmented into academic institutes & research centers, hospitals & clinics, pharmaceutical & biotechnology companies, and other users. Academic institutes & research centers held the maximum share of the market in 2023 due to wide application of NGS in Ph.D projects and research. Furthermore, the segment anticipated to observe the fastest growth as well owing to strong clinical pipeline.
Next Generation Sequencing Market Regional Outlook
North America
- U.S.
- Canada
Europe
- U.K.
- Germany
- France
- Spain
- Rest of Europe
Asia-Pacific
- India
- Japan
- China
- Australia
- South Korea
- Rest of Asia-Pacific
Latin America
- Brazil
- Mexico
- Rest of LATAM
The Middle East & Africa
- South Africa
- GCC Countries
- Rest of the Middle East & Africa (ME&A)
 Next Generation Sequencing Market Regional Analysis
Geographically, the North America region dominated in the industry in 2023 and is expected to maintain its share during the next generation sequencing market forecast period. This can be attributed to high investment in research and development activities, local presence of major market players, more awareness about new technologies, and increasing prevalence of infectious diseases and cancer. For instance The World Health Organization (WHO) has released a new tuberculosis study, revealing that around 8.2 million individuals were newly diagnosed with TB in 2023. This is the highest number observed since WHO began tracking tuberculosis globally in 1995, and represents a significant increase from 7.5 million cases in 2022. TB will once again be the greatest infectious disease killer in 2023, surpassing COVID-19.
However, the Asia-Pacific region is anticipated to propel the industry growth at the fastest rate during the next generation sequencing market forecast period. This is due to growing investment by pharmaceutical and biotechnology companies considering high growth in the region and funding provided by the private and government organization for the development of innovative and effective treatment. Additionally, presence of large pool of targeted patients increases the demand for next generation sequencing from the region.
Next Generation Sequencing Market Players
Some of the top next generation sequencing companies offered in our report includes Thermo Fisher Scientific, Inc., Oxford Nanopore Technologies, Genomatix GmbH, DNASTAR, Inc., Perkin Elmer, Inc., QIAGEN, Bio-Rad Laboratories, Inc., PierianDx, Illumina, and F. Hoffman-La Roche Ltd.
Frequently Asked Questions
How big is the next generation sequencing market?
The next generation sequencing market size was valued at USD 9.1 Billion in 2023.
What is the CAGR of the global next generation sequencing market from 2024 to 2032?
The CAGR of next generation sequencing is 17.9% during the analysis period of 2024 to 2032.
Which are the key players in the next generation sequencing market?
The key players operating in the global market are including Thermo Fisher Scientific, Inc., Oxford Nanopore Technologies, Genomatix GmbH, DNASTAR, Inc., Perkin Elmer, Inc., QIAGEN, Bio-Rad Laboratories, Inc., PierianDx, Illumina, and F. Hoffman-La Roche Ltd.
Which region dominated the global next generation sequencing market share?
North America held the dominating position in next generation sequencing industry during the analysis period of 2024 to 2032.
Which region registered fastest CAGR from 2024 to 2032?
Asia-Pacific region exhibited fastest growing CAGR for market of next generation sequencing during the analysis period of 2024 to 2032.
What are the current trends and dynamics in the global next generation sequencing industry?
The current trends and dynamics in the next generation sequencing industry include increasing demand for personalized medicine and targeted therapies, and technological advancements in sequencing platforms improving accuracy and speed.
Which product held the maximum share in 2023?
The consumables product held the notable share of the next generation sequencing industry.


