NET Treatment Market Size - Global Industry, Share, Analysis, Trends and Forecast 2022 - 2030
Published :
Report ID:
Pages :
Format :
NET Treatment Market Size - Global Industry, Share, Analysis, Trends and Forecast 2022 - 2030
Report Coverage
- Industry Dynamics
- Market Size and Forecast Data
- Segment Analysis
- Competitive Landscape
- Regional Analysis with a Niche Focus on Country-Level Data
- High Level Analysis - Porter's, PESTEL, Value Chain, etc.
- Company Profiles of Key Players
- Option to Customize the Report As Per Your Specific Need
Request Sample Report
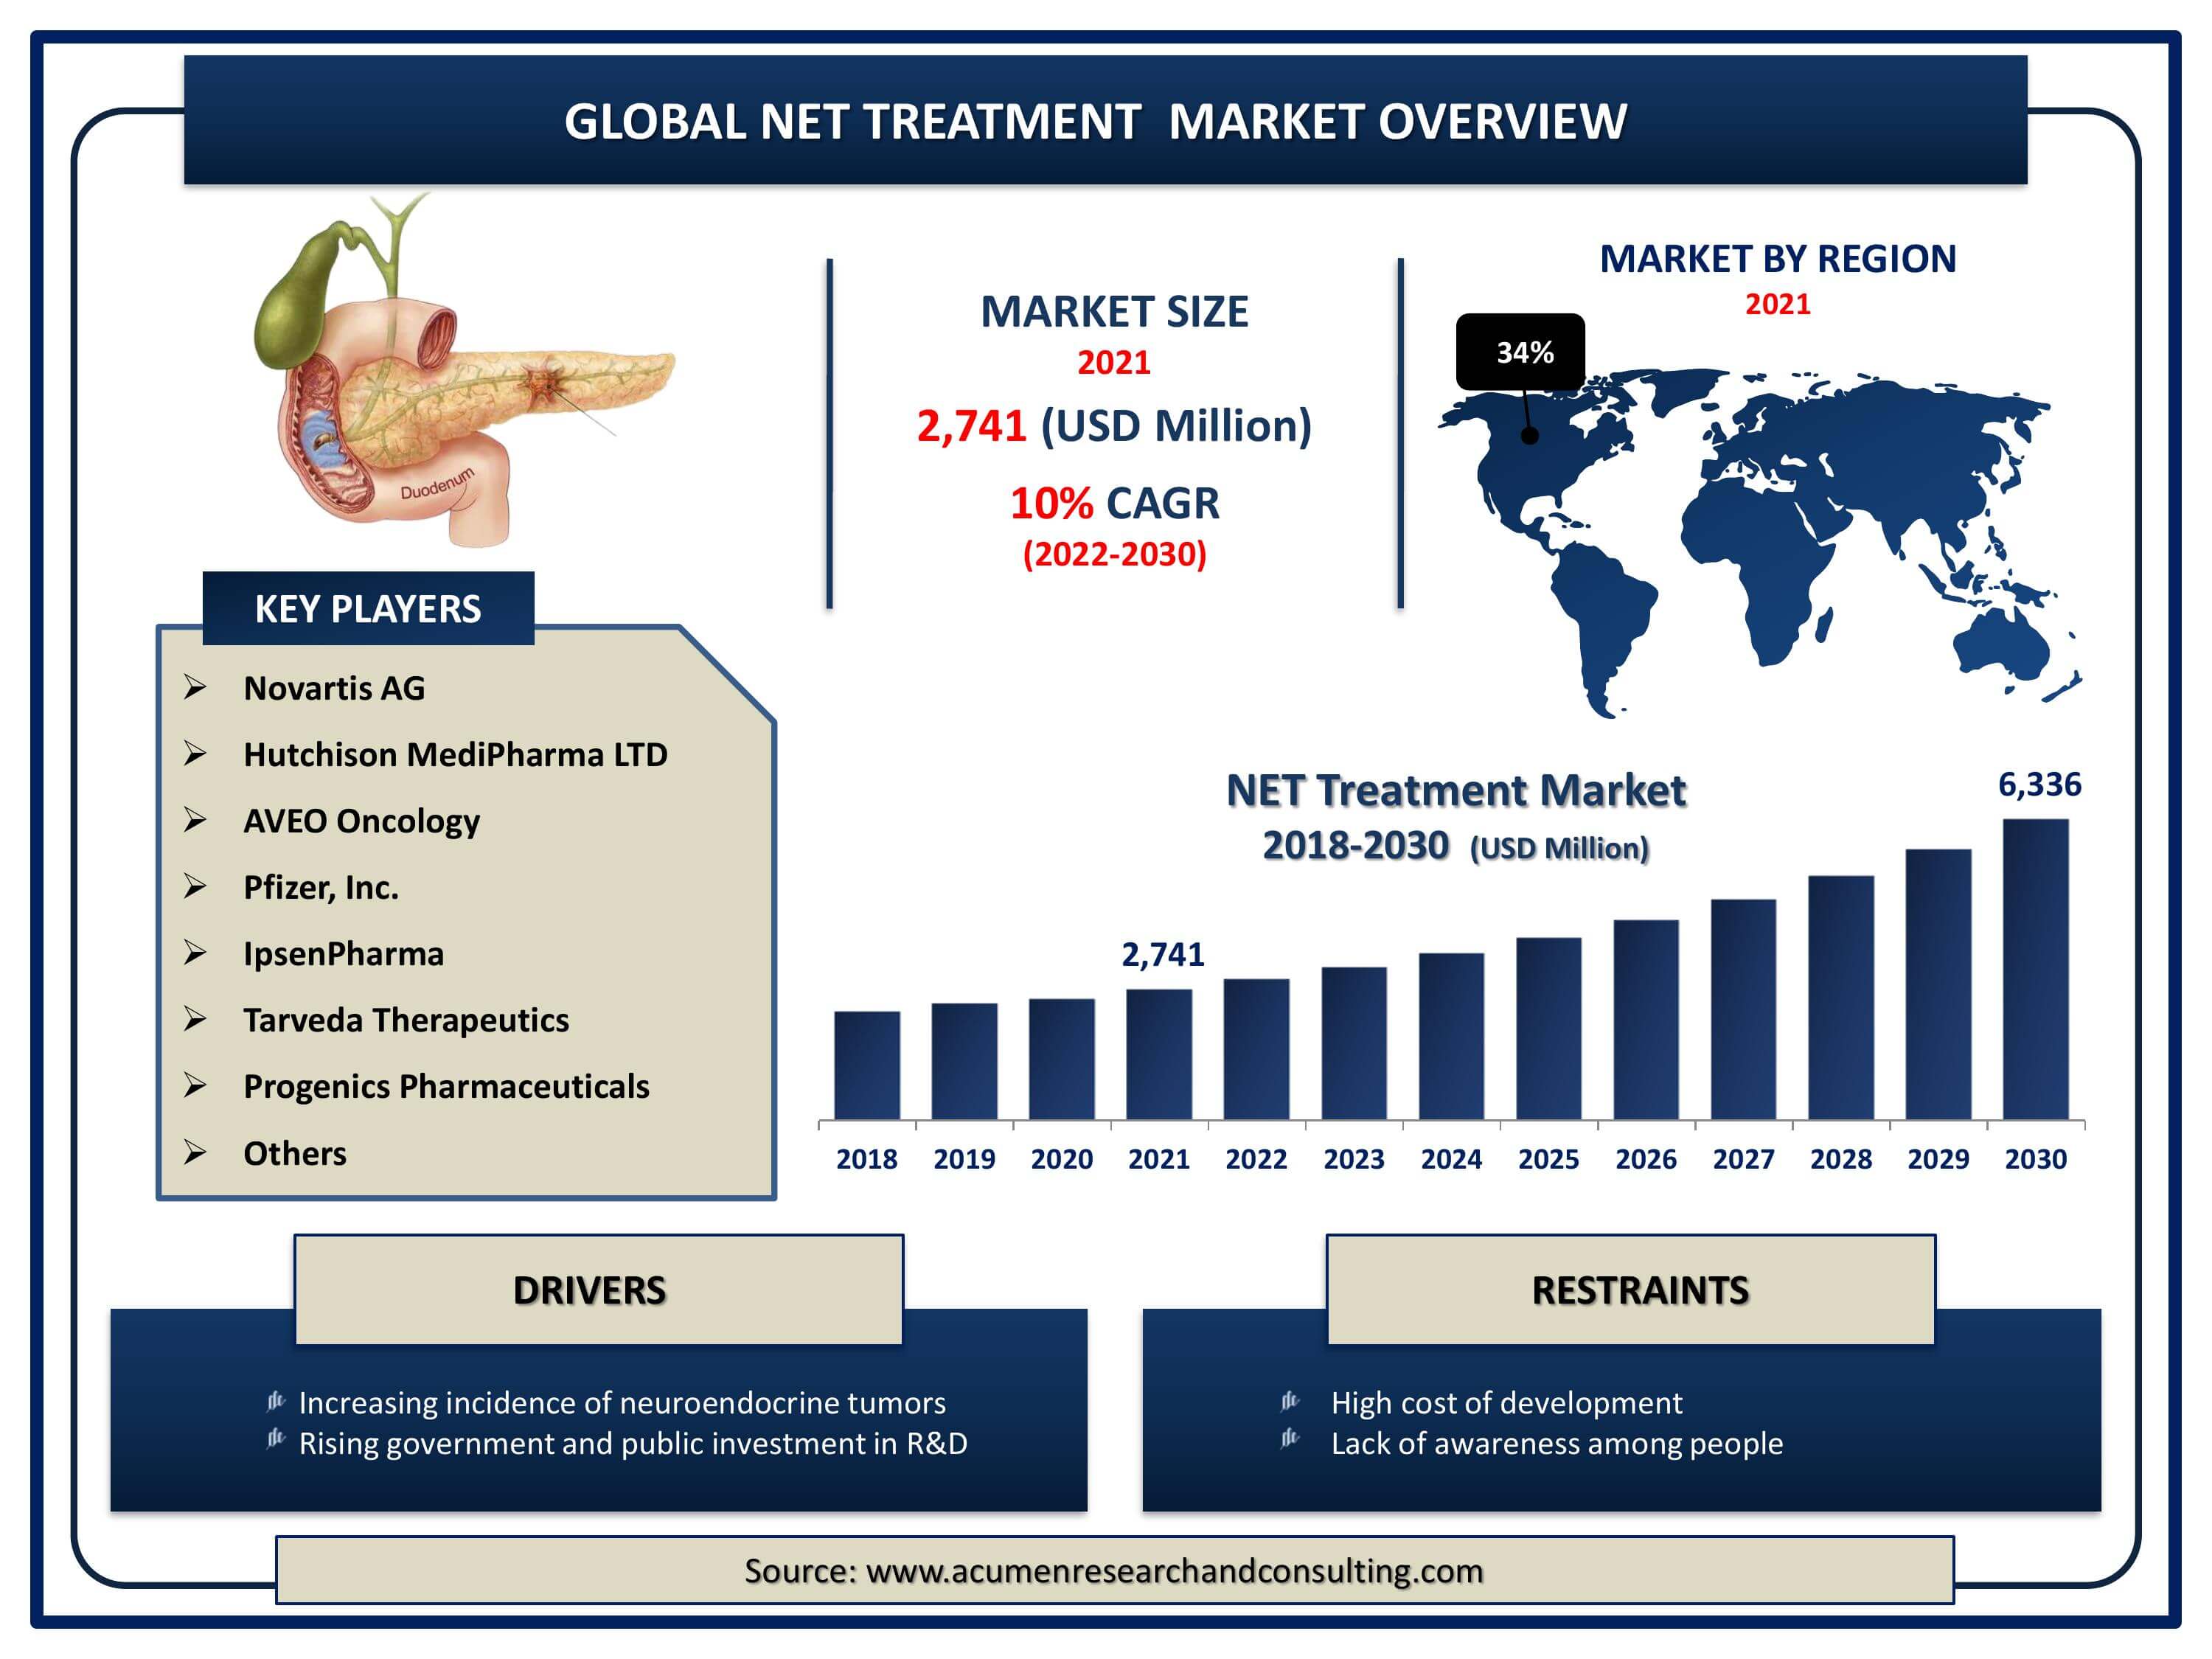
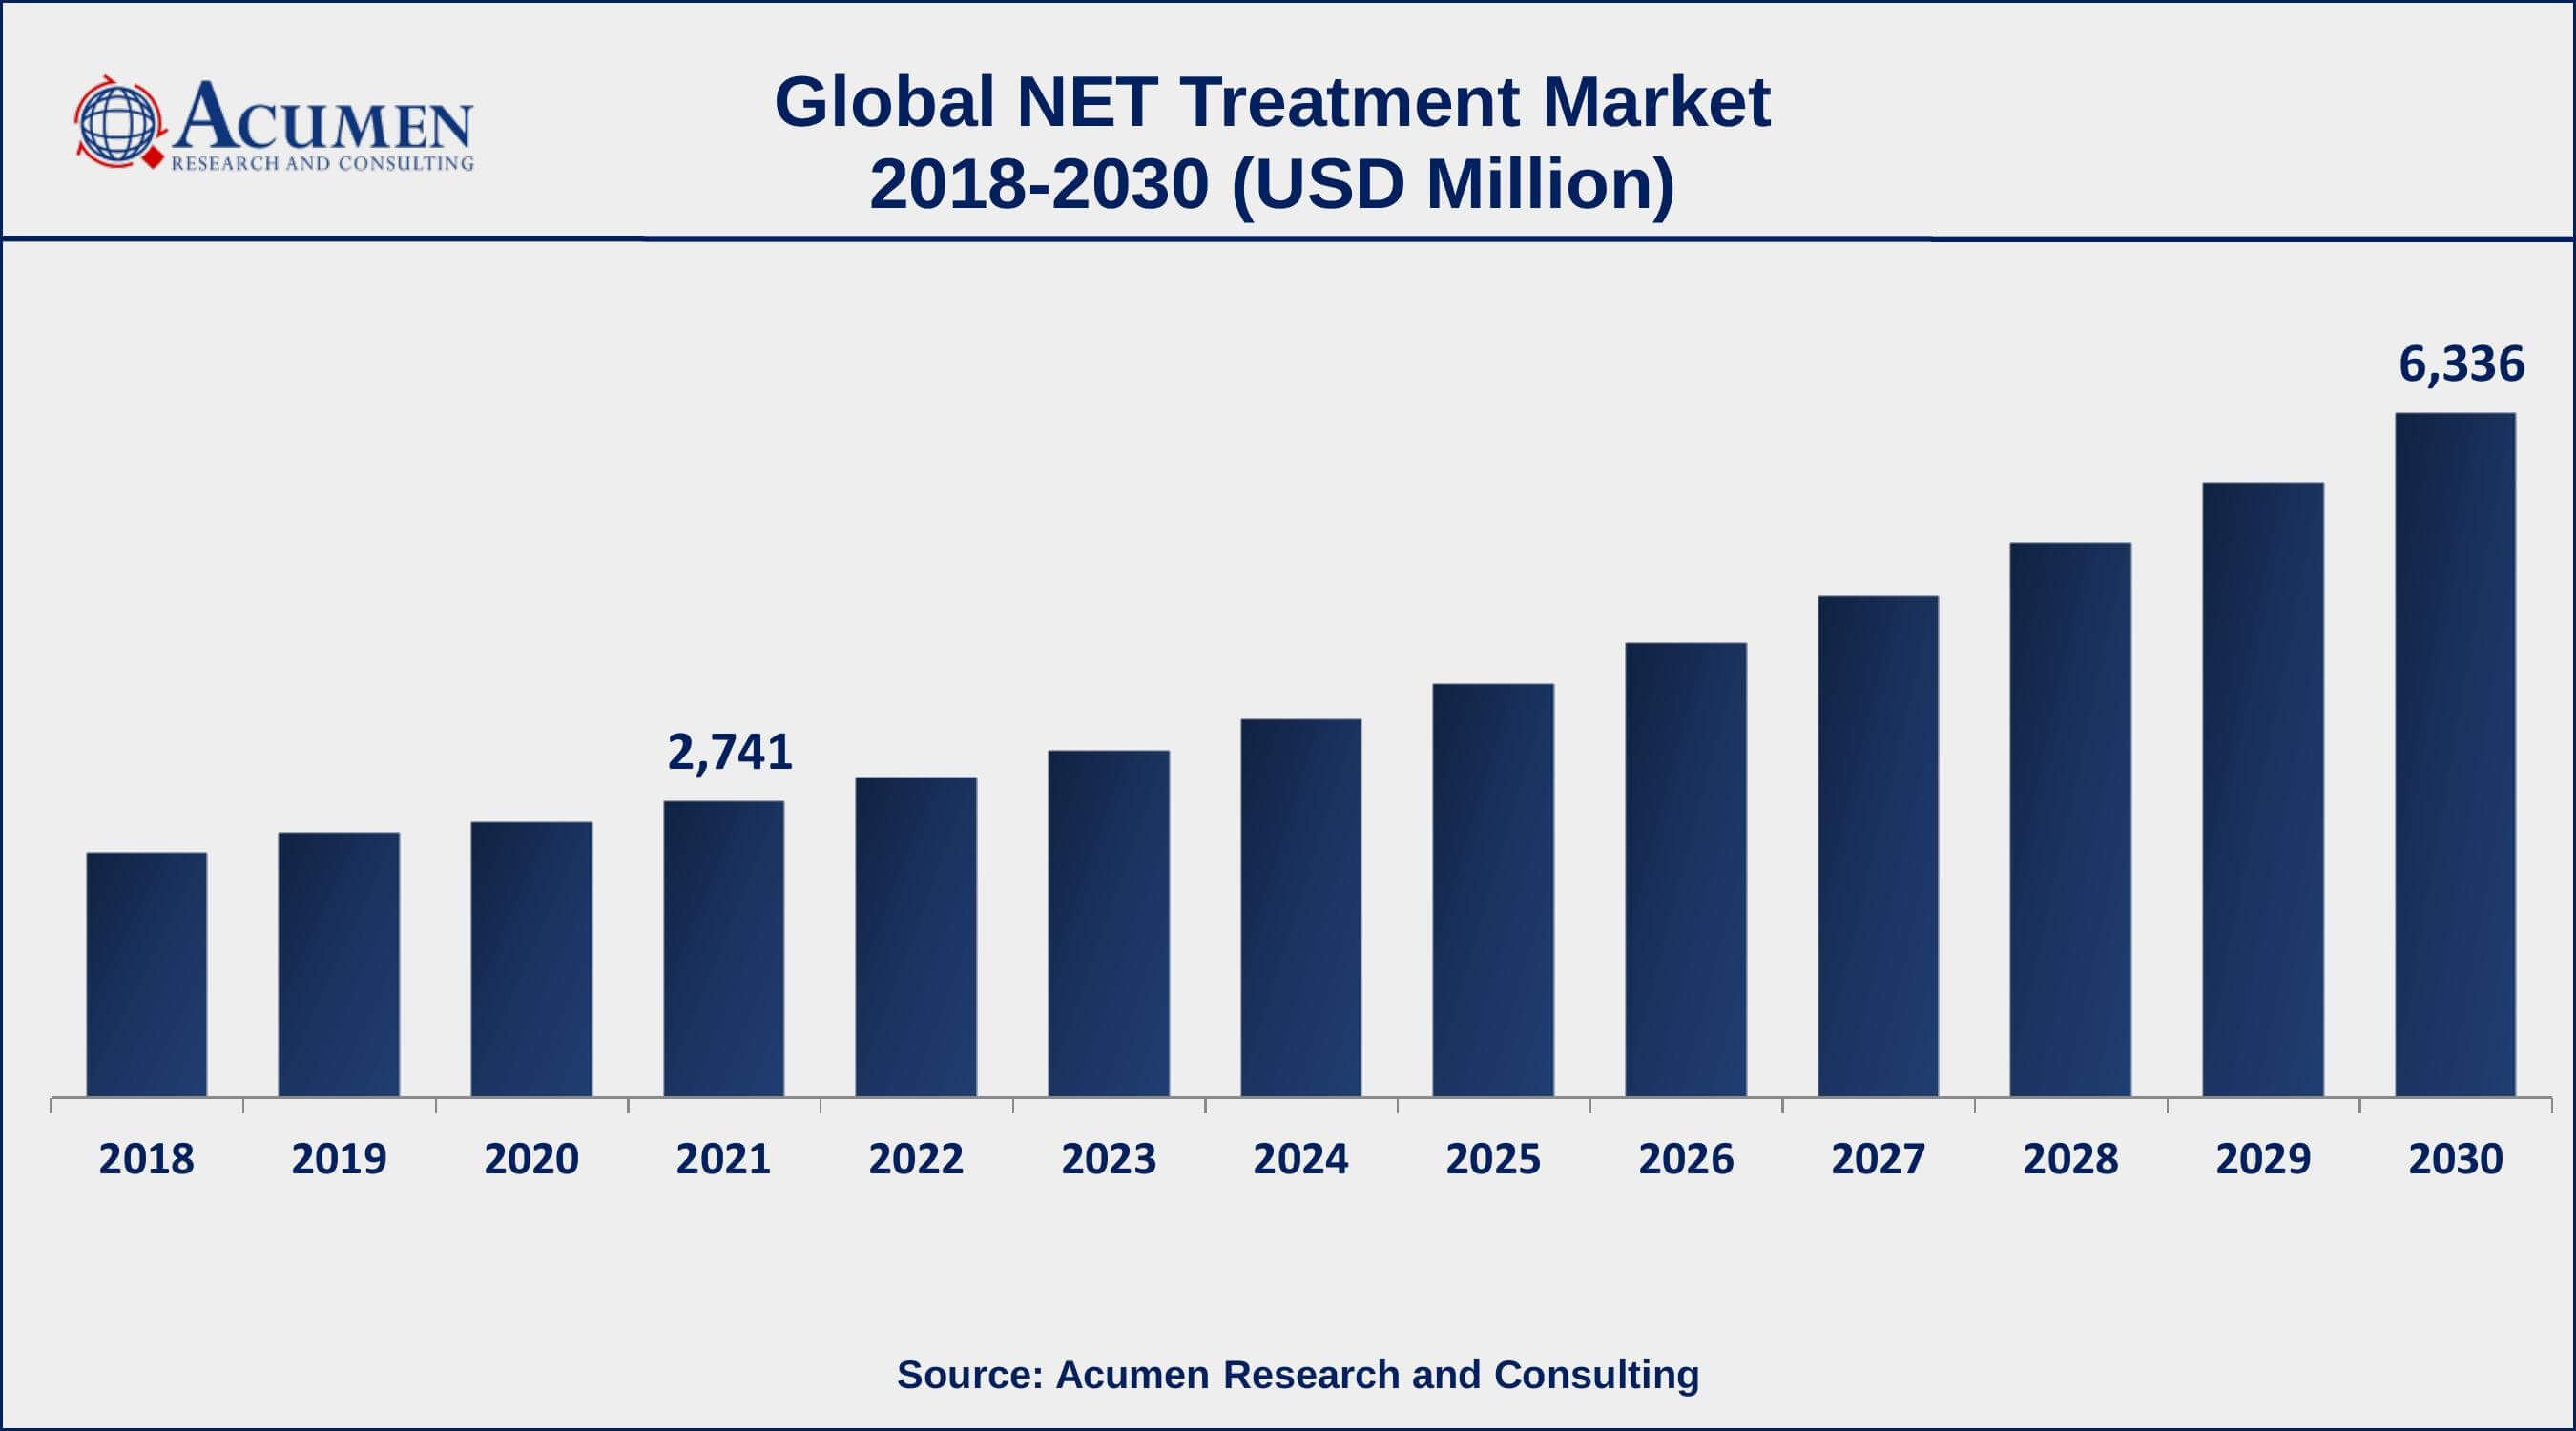
The Global NET Treatment Market Size accounted for USD 2,741 Million in 2021 and is estimated to achieve a market size of USD 6,336 Million by 2030 growing at a CAGR of 10% from 2022 to 2030. Increased occurrences of neuroendocrine tumors (NETs) are expected to drive the NET treatment market growth. Furthermore, novel therapies and expanded indications for current medications are projected to fuel the NET treatment market value in the coming years.
NET Treatment Market Report Key Highlights
- Global Neuroendocrine tumors NET treatment market revenue is expected to increase by USD 6,336 million by 2030, with a 10% CAGR from 2022 to 2030.
- North America region led with more than 34% NET treatment market share in 2021
- Europe and Asia-Pacific NET treatment market growth will observe fastest CAGR from 2022 to 2030
- By product, the somatostatin analogs (SSAs) segment has accounted market share of over 54% in 2021
- By site, pancreas segment engaged more than 34% of the total market share in 2021
- Among end-user, clinic sector is growing at a strongest CAGR over the forecast period
Neuroendocrine tumors (NETs) are caused by the aberrant development of neoplasms originating in different endocrine glands as well as neurological systems. Though the majority of them are benign, some are malignant and may progress to cancer in the long run. Neuroendocrine tumors are commonly called carcinoid tumors since they get infected in the intestine first. The pancreatic is the body's second-most important organ, and it is a common site for NET growth. A number of clinical studies are underway to identify innovative therapies or medications for the diagnosis of pancreatic neuroendocrine tumors in adults.
Global NET Treatment Market Dynamics
Market Drivers
- Increasing incidence of neuroendocrine tumors
- Rising government and public investment in R&D
- Technological developments in treatment
- Increasing product approval in the treatment
Market Restraints
- High cost of development
- Lack of awareness among the people
Market Opportunities
- Integration of artificial intelligence for medicating
- Early-phase investigations were ongoing in immuno-oncology clinical development
NET Treatment Market Report Coverage
| Market | NET Treatment Market |
| NET Treatment Market Size 2021 | USD 2,741 Million |
| NET Treatment Market Forecast 2030 | USD 6,336 Million |
| NET Treatment Market CAGR During 2022 - 2030 | 10% |
| NET Treatment Market Analysis Period | 2018 - 2030 |
| NET Treatment Market Base Year | 2021 |
| NET Treatment Market Forecast Data | 2022 - 2030 |
| Segments Covered | By Product, By Site, By End-User, And By Geography |
| Regional Scope | North America, Europe, Asia Pacific, Latin America, and Middle East & Africa |
| Key Companies Profiled | BoehringerIngelheim International GmbH, Hutchison MediPharma Limited, AVEO Oncology, Pfizer, Inc., Novartis AG, IpsenPharma, Tarveda Therapeutics, and Progenics Pharmaceuticals. |
| Report Coverage |
Market Trends, Drivers, Restraints, Competitive Analysis, Player Profiling, Regulation Analysis |
The market is driven by the growing occurrence of cancer among patients and is expected to drive neuroendocrine tumor treatment market size across the globe. The growing extensiveness of carcinoid tumors is anticipated to drive the NET treatment market during the forthcoming years. Huge investment in clinical trials by numerous pharmaceutical businesses to develop new products is another parameter driving the neuroendocrine tumors treatment market growth.
Such as, Novartis AG has the witnessed highest numeral of clinical trials followed by the company named Pfizer Inc. and Ipsen Pharma. Furthermore, technical advancements in therapies to treat neuroendocrine tumors are expected to drive the NET treatment market development over the coming years. A few of these comprise targeted drug therapies, PET imaging with Ga labeled Somatostatin, and tyrosine kinase therapies. Such as, Lutathera by Novartis AG received FDA sanction for the first-ever radionucleotide therapy.
Many of these businesses have undertaken policies, for instance, product launches, regional development, strategic partnerships, and distribution agreements, to reinforce their market position. Such as, Novartis AG declared to purchase all the ordinary shares from its subsidiary group Novartis Groupe France S.A. in January 2018.
NET Treatment Market Segmentation
The global NET treatment market segmentation is based on product, site, end-user, and geography.
NET Treatment Market By Product
- Somatostatin Analogs (SSAs)
- Targeted Therapy
- Others
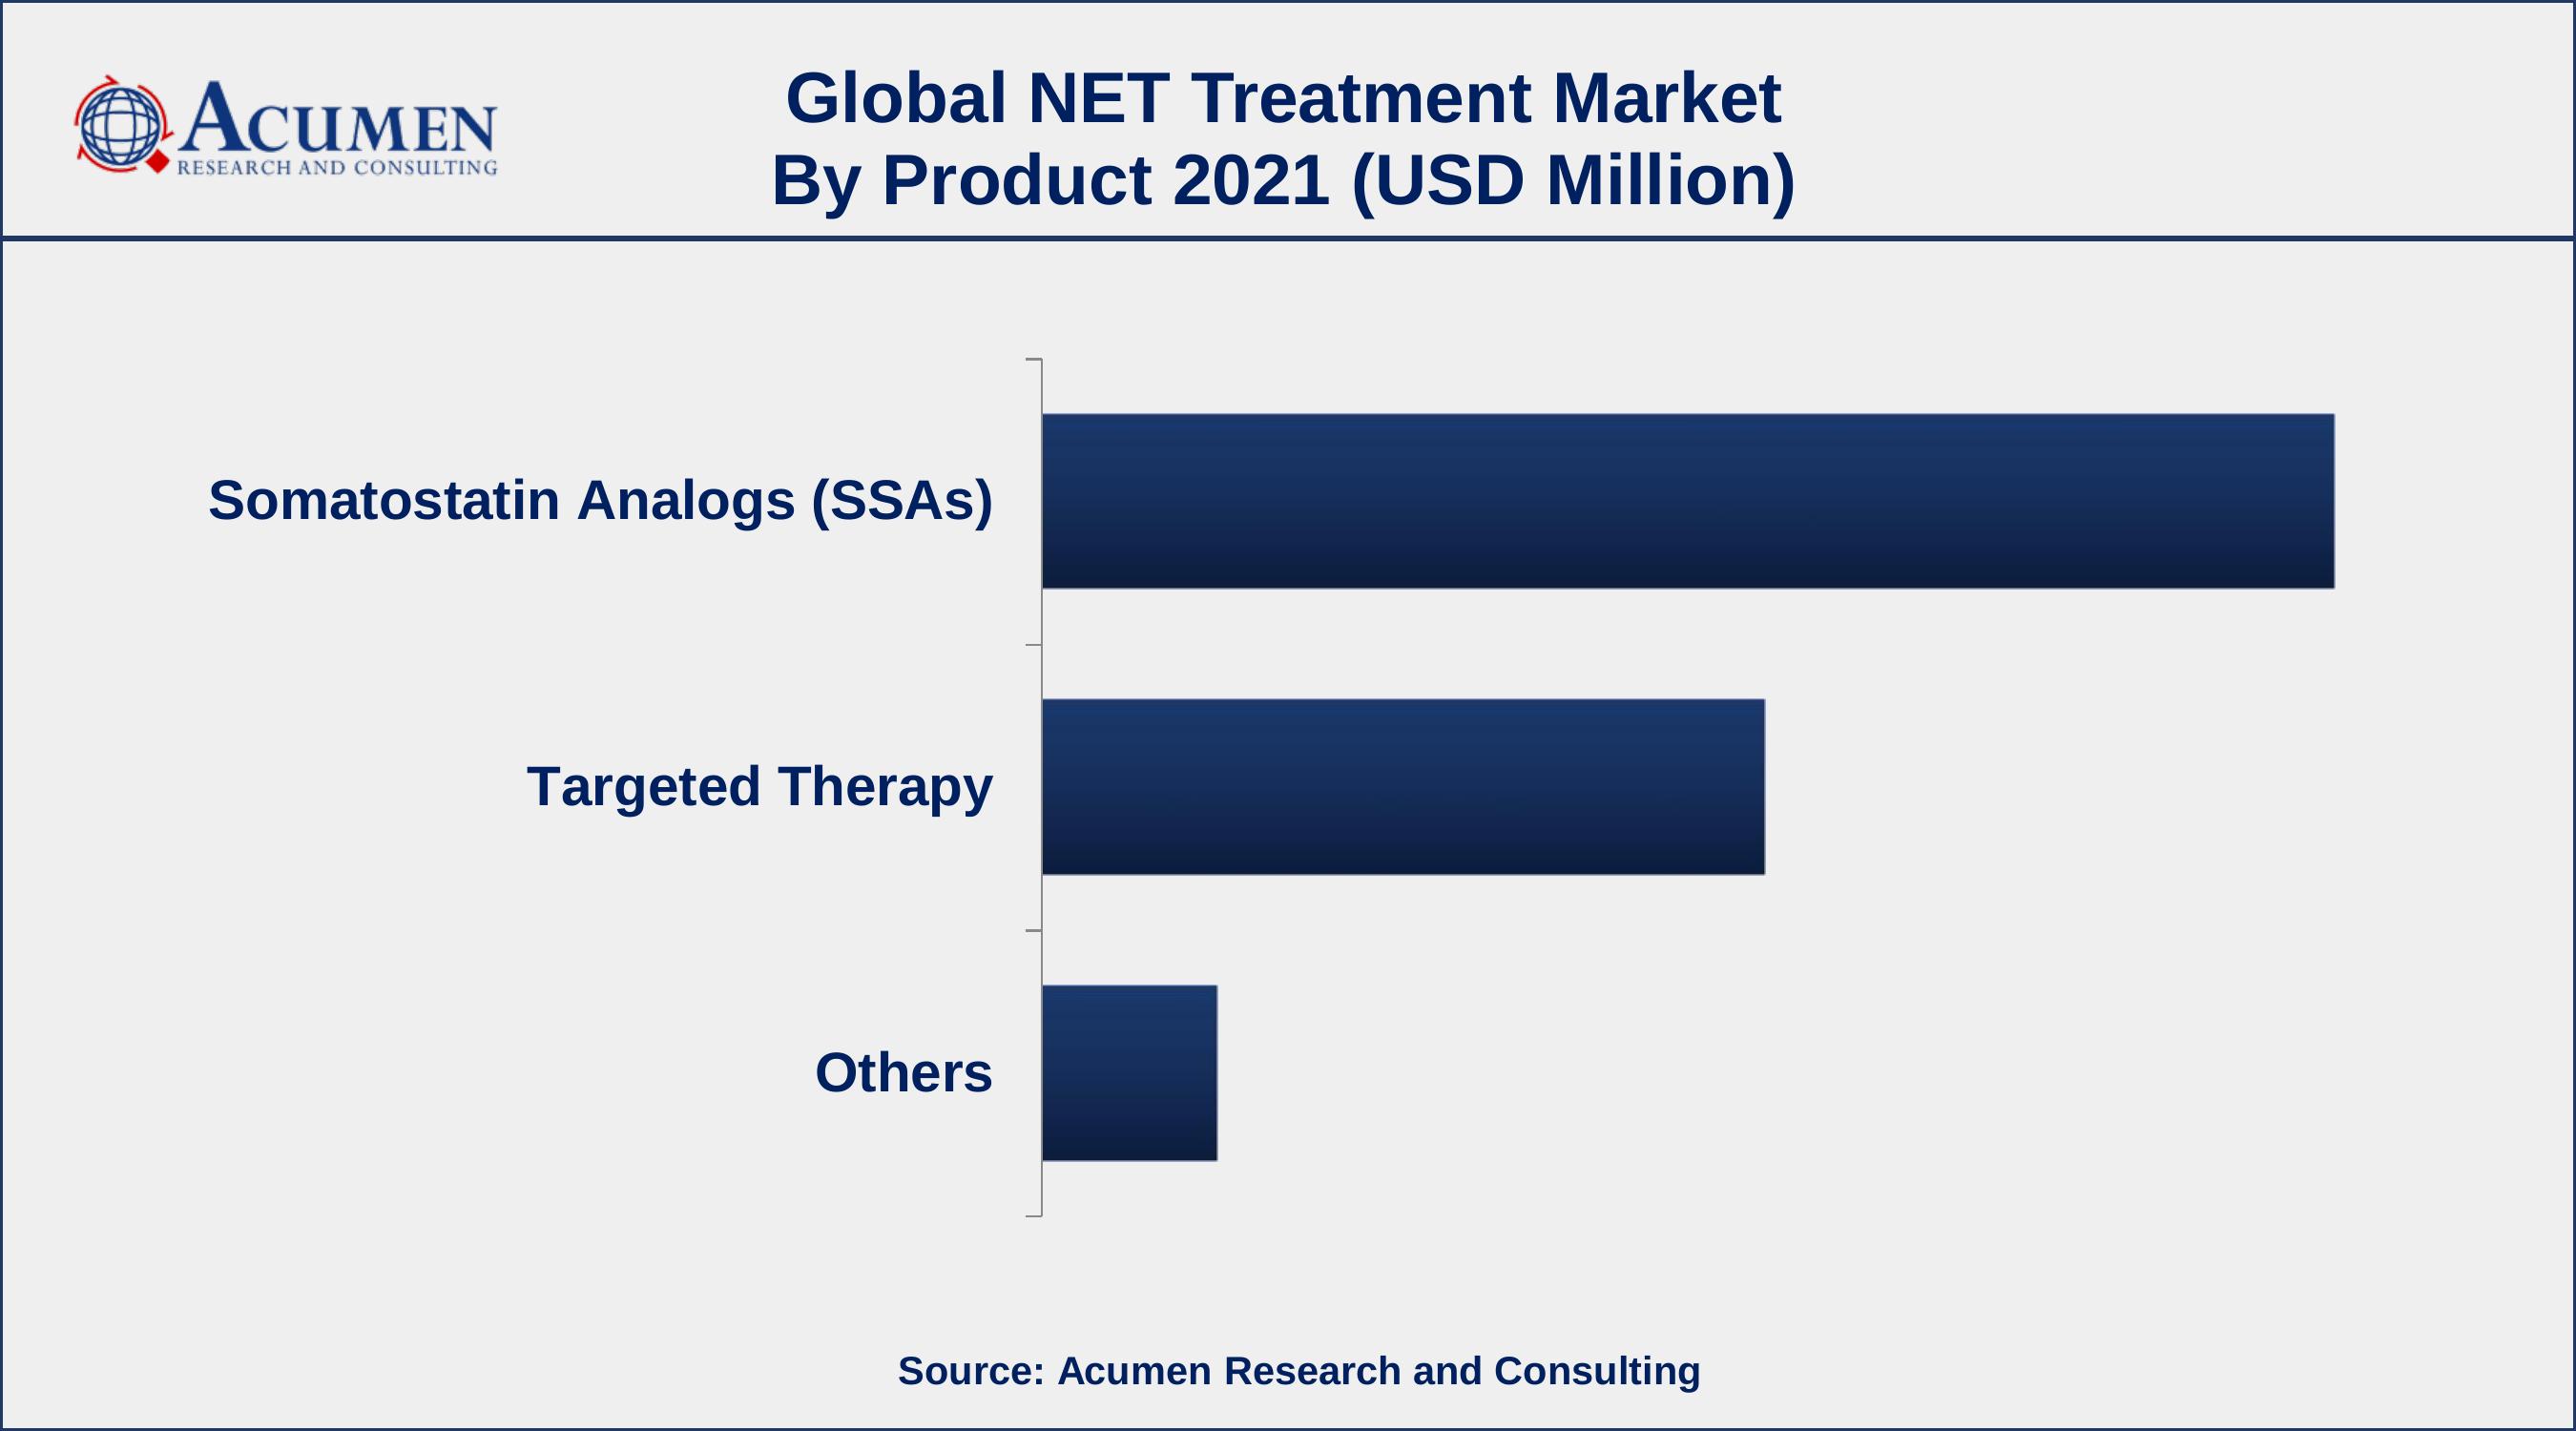
According to a NET treatment industry analysis, the SSAs category will account for the biggest market share in 2021. This increase is due to the appropriate treatment procedures provided by SSAs. Because they limit tumor growth, comorbidities, and target biomarkers, SSAs are commonly utilized in the treatment of neuroendocrine carcinoma.
NET Treatment Market By Site
- Lungs
- Colon
- Pancreas
- Small Intestine
- Others
In terms of sites, the pancreatic segment is expected to expand significantly in the coming years. Increased R&D efforts for the creation of revolutionary therapeutics for pancreatic NETs are projected to drive segment growth. Pfizer Inc.'s SUNITINIB, for example, is currently in phase III clinical trials and is indicated for the treatment of pancreatic NETs.
NET Treatment Market By End-User
- Hospitals
- Clinics
- Others
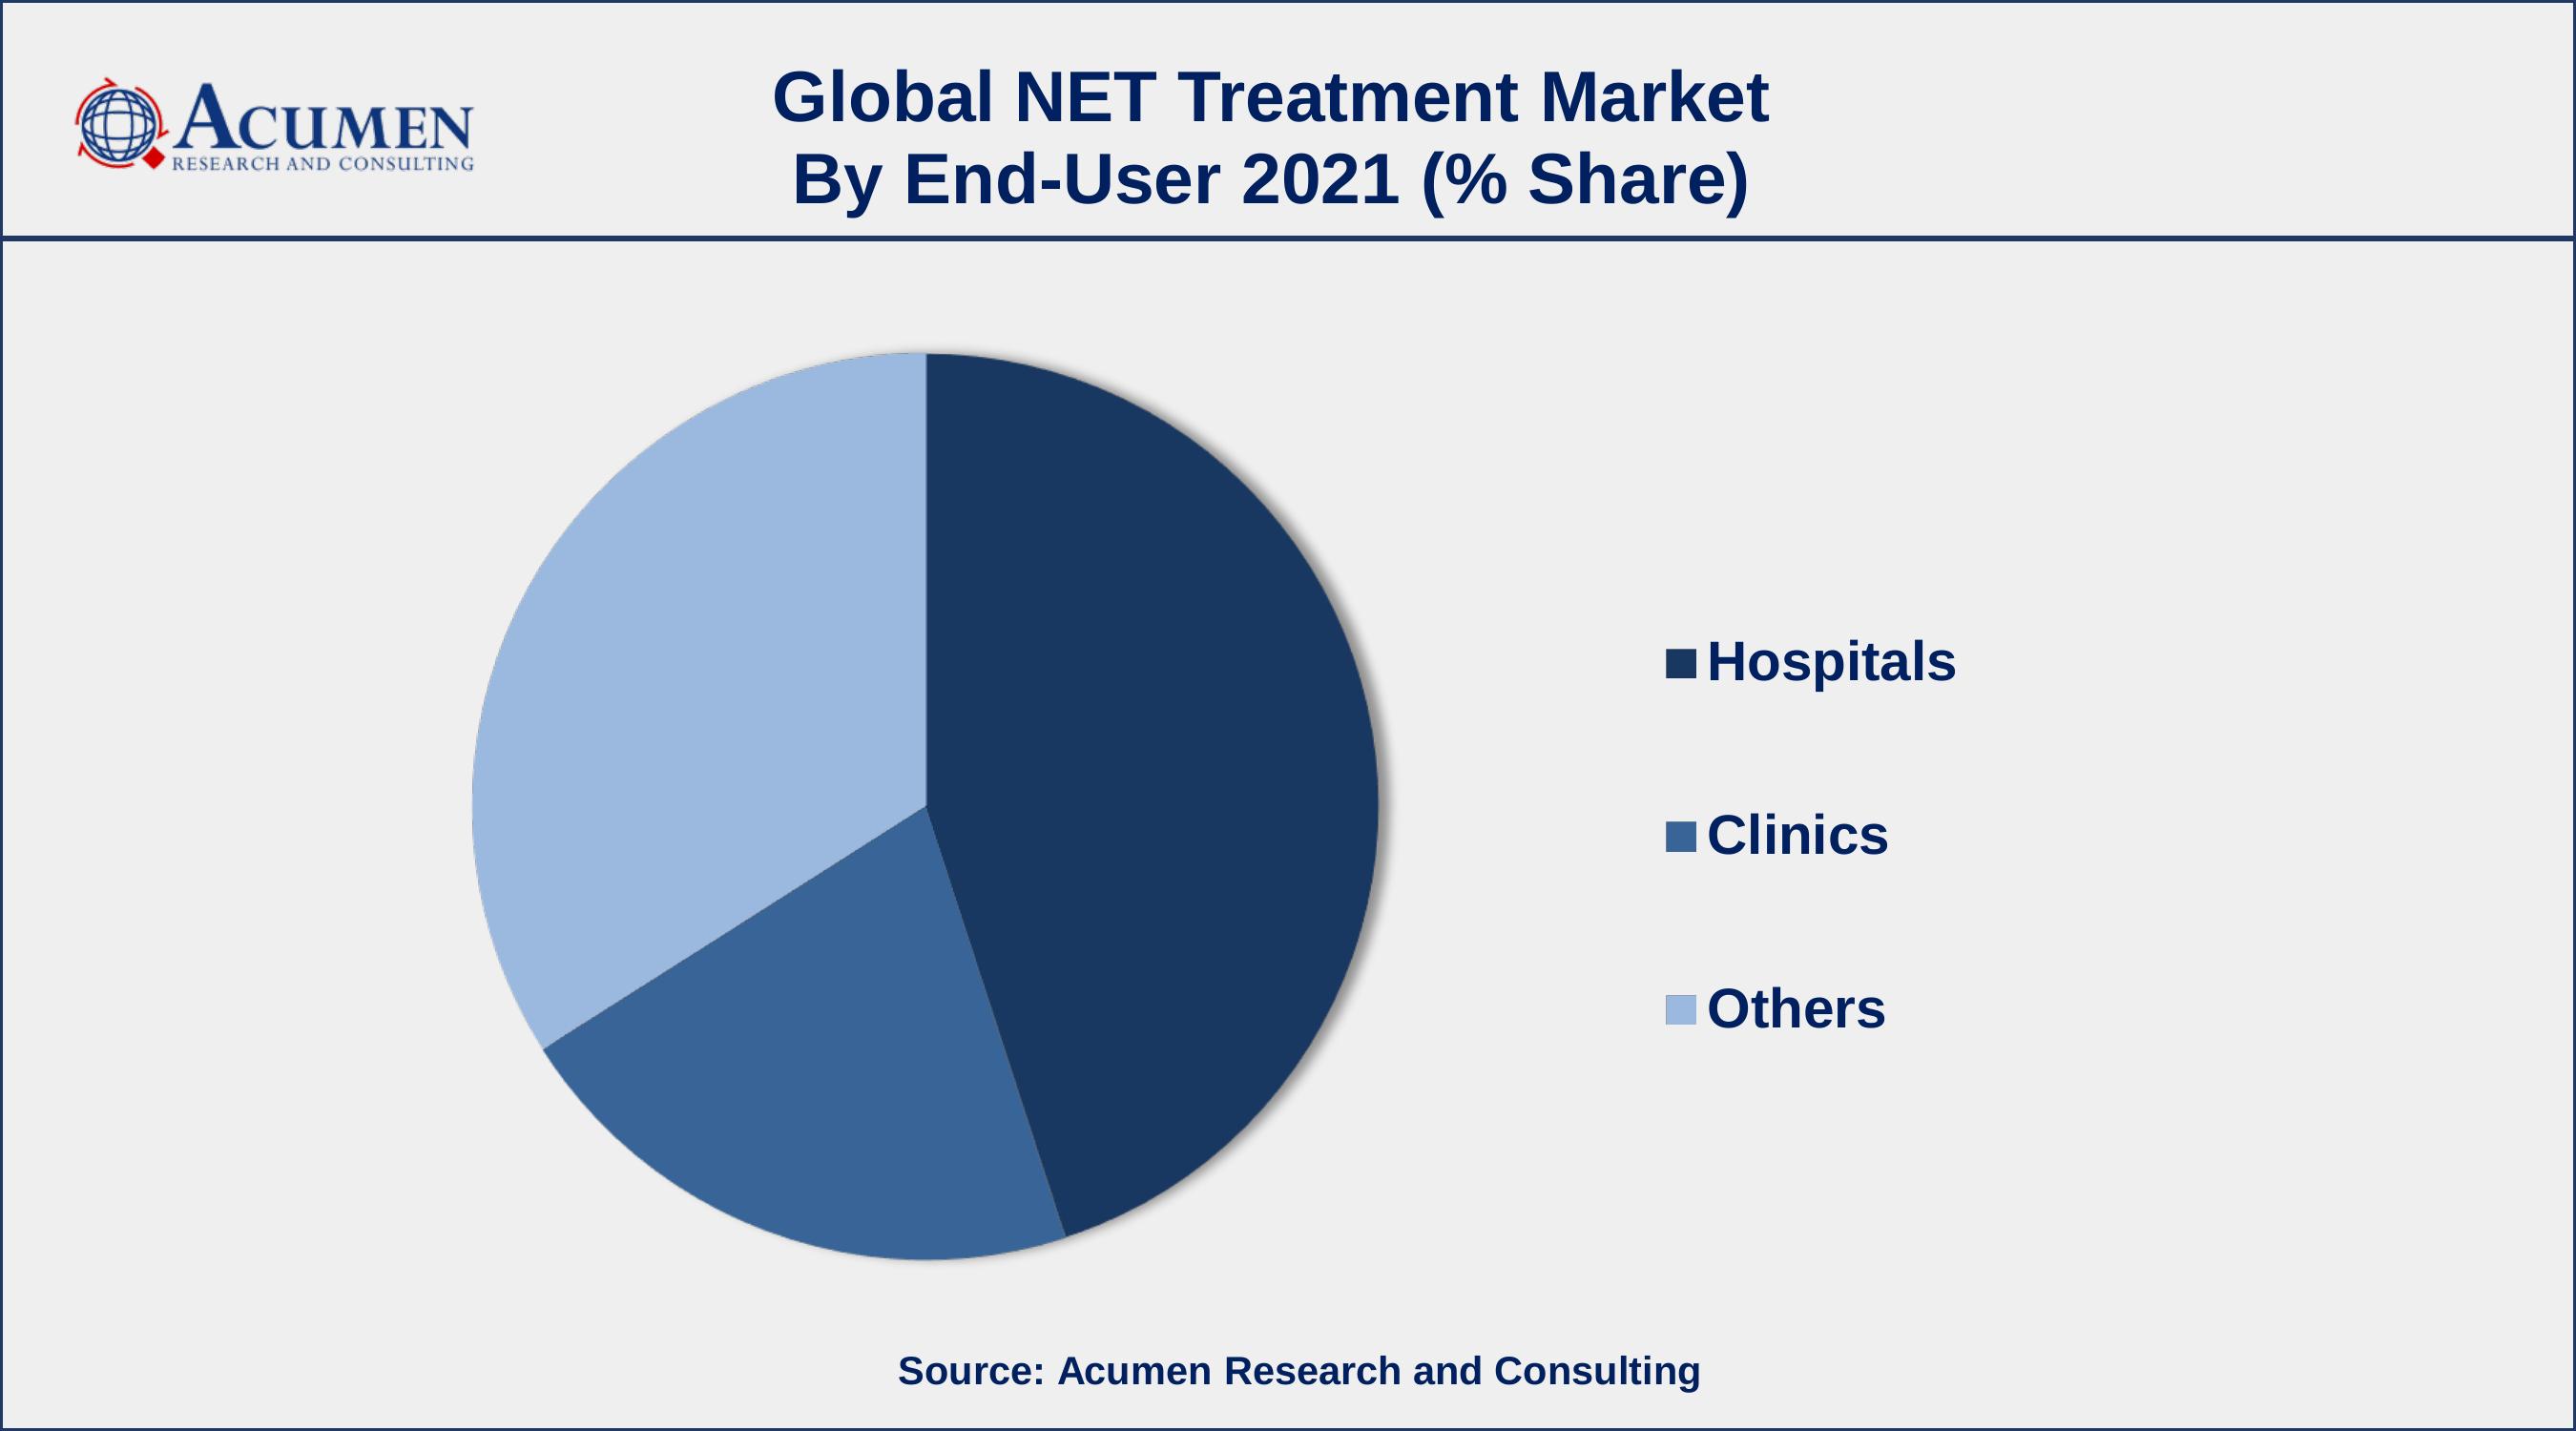
According to the NET treatment market forecast, the clinic segment will grow dramatically in the upcoming years. This is primarily due to the qualified surgeons and patient-centered therapy alternatives are readily available. The other sector, which comprises cancer research organizations and government agencies, is expected to offer significant opportunities for growth for the NET market over the next few years.
NET Treatment Market Regional Outlook
North America
- U.S.
- Canada
Europe
- U.K.
- Germany
- France
- Spain
- Rest of Europe
Asia-Pacific
- India
- Japan
- China
- Australia
- South Korea
- Rest of Asia-Pacific
Latin America
- Brazil
- Mexico
- Rest of Latin America
The Middle East & Africa
- South Africa
- GCC Countries
- Rest of the Middle East & Africa (ME&A)
North America Dominates, Europe and Asia-Pacific Records Fastest Growing CAGR In The Forthcoming Years For Global NET Treatment Market
North America leads the largest market share in 2021 and is expected to maintain its dominance in the future. The main parameter contributing to the development of this region comprises government support for high purchasing power parity, quality healthcare, availability of reimbursement, and the growing occurrence of cancers in Canada and the U.S.
During the projection period, Europe secured a considerable market share of the global Neuroendocrine tumors treatment market value. The greater extent of public funding in Europe’s healthcare system has backed this development. Furthermore, the occurrence of the target populace base paired with government support to control cancer captures significant development of this region. Such formation of bodies, for instance, the European Cancer Observatory, produced consciousness about cancer. Asia-Pacific is anticipated to observe profitable development forthcoming due to helpful government initiatives and improving healthcare infrastructure. Furthermore, economic growths in countries, for instance, China and India, are anticipated to aid drive market development. An enormous populace base with low per capita income in the region captures to high need for reasonable treatment options.
NET Treatment Market Players
Some of the top NET treatment market companies offered in the professional report include BoehringerIngelheim International GmbH, Hutchison MediPharma Limited, AVEO Oncology, Pfizer, Inc., Novartis AG, IpsenPharma, Tarveda Therapeutics, and Progenics Pharmaceuticals.
Frequently Asked Questions
What is the size of global NET treatment market in 2021?
The estimated value of global NET treatment market in 2021 was accounted to be USD 2,741 Million.
What is the CAGR of global NET treatment market during forecast period of 2022 to 2030?
The projected CAGR NET treatment market during the analysis period of 2022 to 2030 is 10%.
Which are the key players operating in the market?
The prominent players of the global NET treatment market are BoehringerIngelheim International GmbH, Hutchison MediPharma Limited, AVEO Oncology, Pfizer, Inc., Novartis AG, IpsenPharma, Tarveda Therapeutics, and Progenics Pharmaceuticals.
Which region held the dominating position in the global NET treatment market?
North America held the dominating NET treatment during the analysis period of 2022 to 2030.
Which region registered the fastest growing CAGR for the forecast period of 2022 to 2030?
Asia-Pacific region exhibited fastest growing CAGR for NET treatment during the analysis period of 2022 to 2030.
What are the current trends and dynamics in the global NET treatment market?
Increasing incidence of neuroendocrine tumors and rising government and public investment in R&D drives the growth of global NET treatment market.
By product segment, which sub-segment held the maximum share?
Based on product, somatostatin analogs (SSAs) segment is expected to hold the maximum share of the NET treatment market.


