Natural Chelating Agents Market Size - Global Industry, Share, Analysis, Trends and Forecast 2023 - 2032
Published :
Report ID:
Pages :
Format :
Natural Chelating Agents Market Size - Global Industry, Share, Analysis, Trends and Forecast 2023 - 2032
Report Coverage
- Industry Dynamics
- Market Size and Forecast Data
- Segment Analysis
- Competitive Landscape
- Regional Analysis with a Niche Focus on Country-Level Data
- High Level Analysis - Porter's, PESTEL, Value Chain, etc.
- Company Profiles of Key Players
- Option to Customize the Report As Per Your Specific Need
Request Sample Report
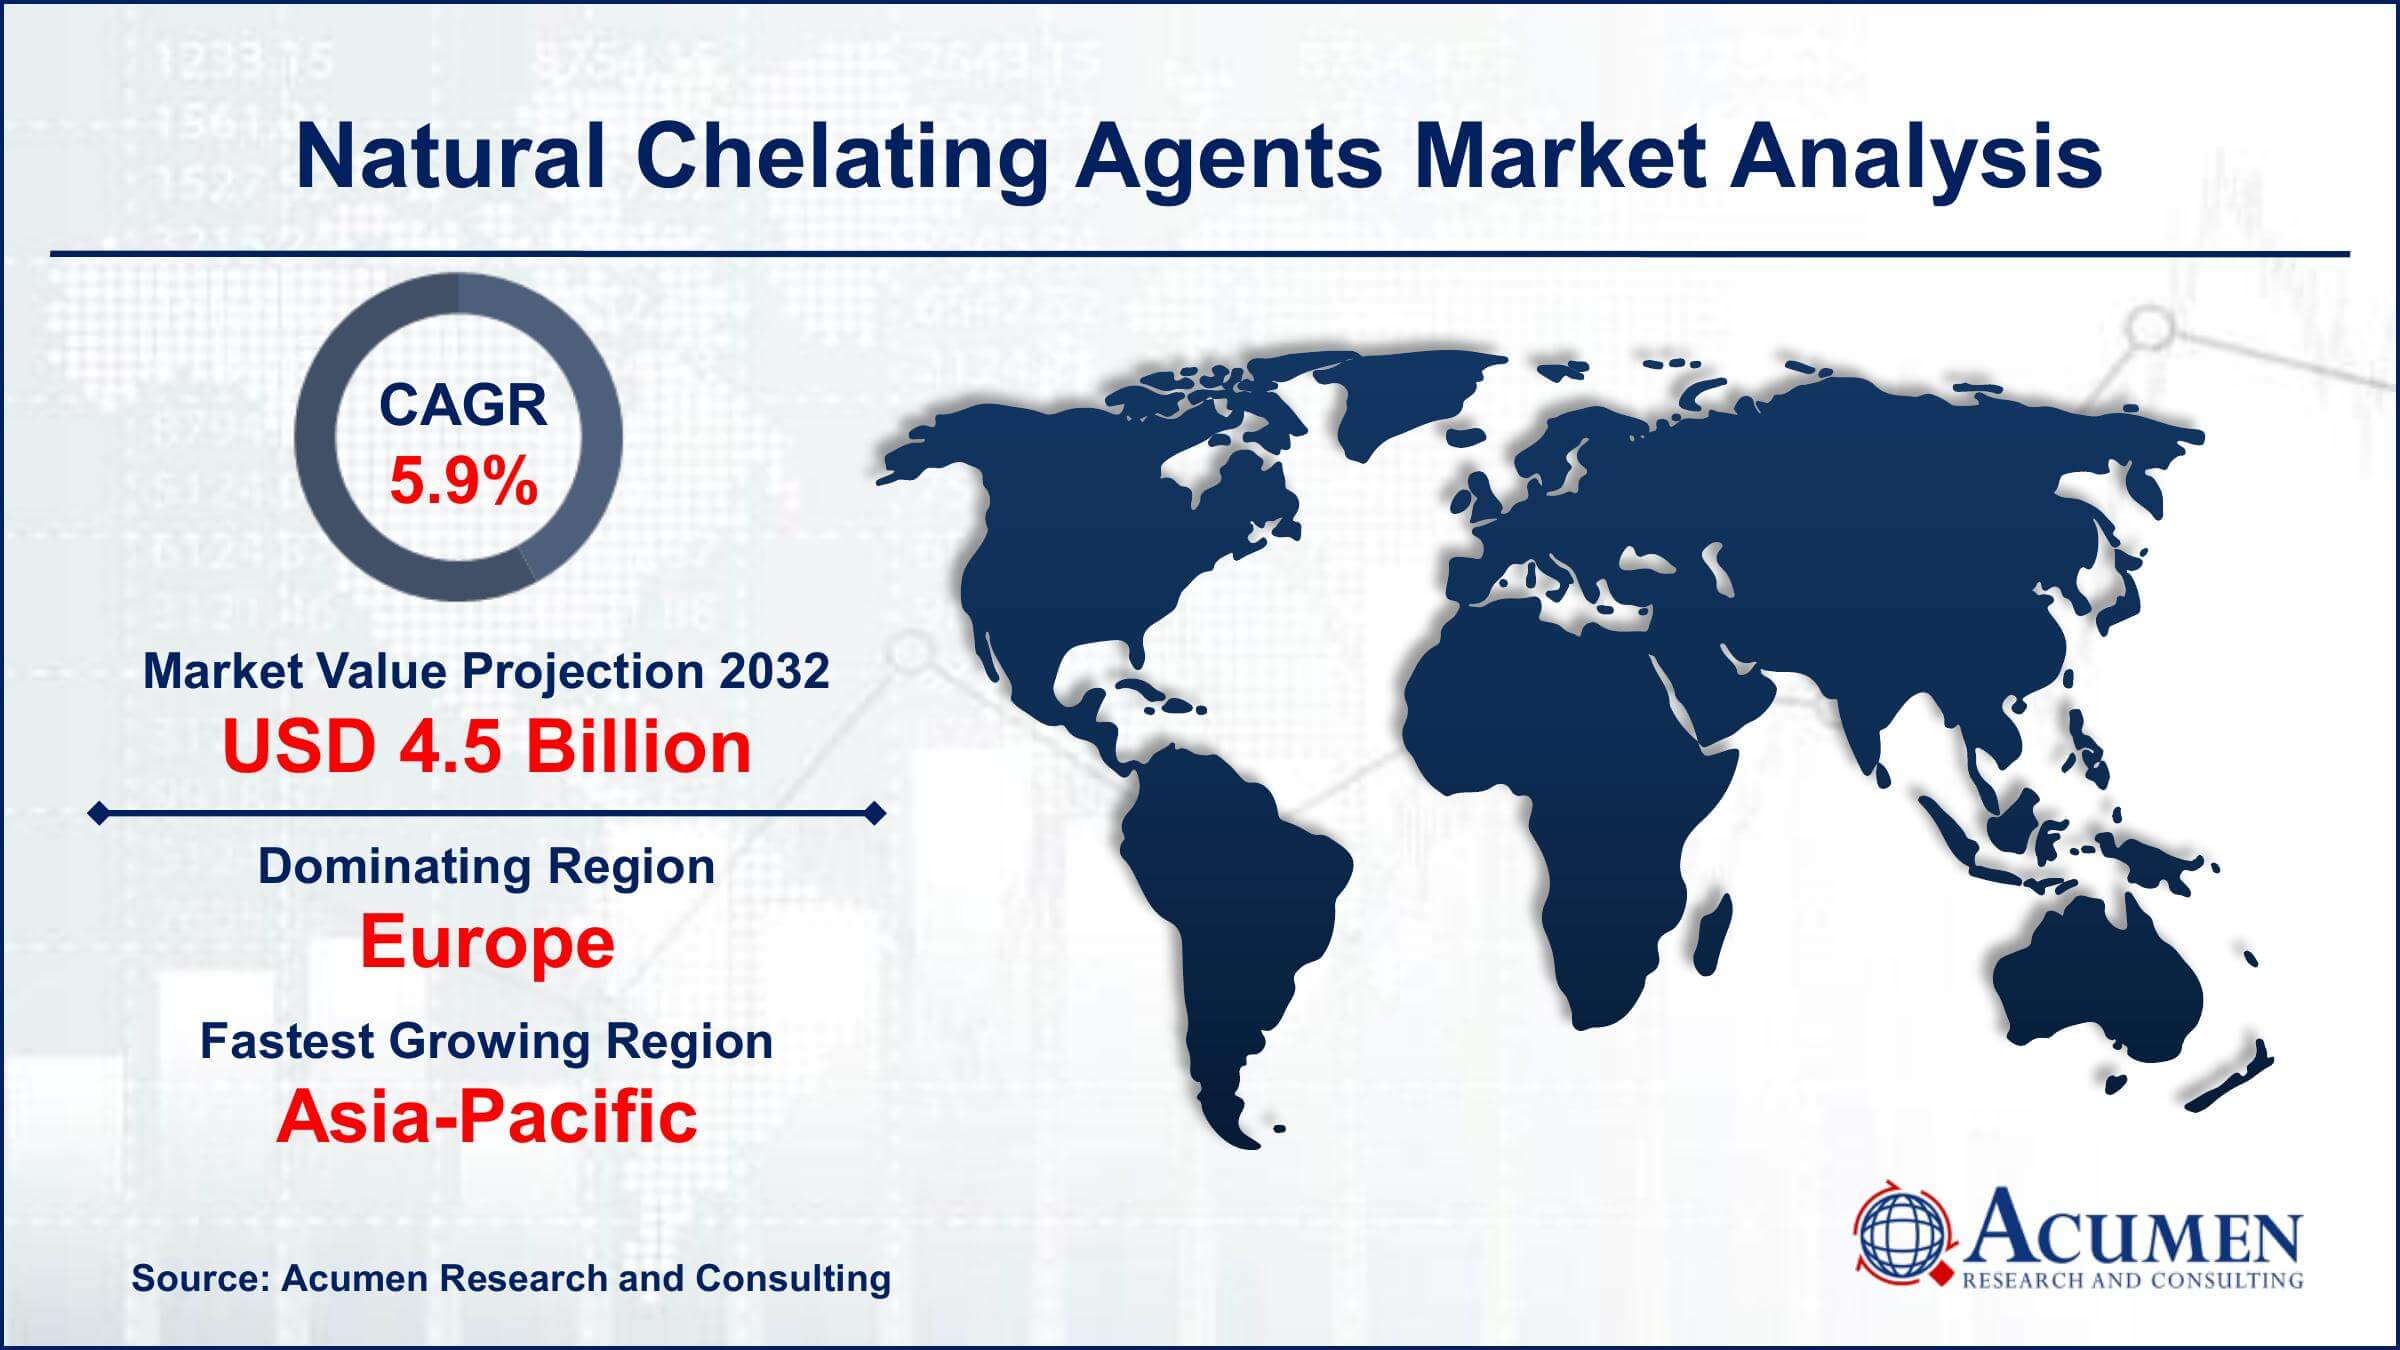
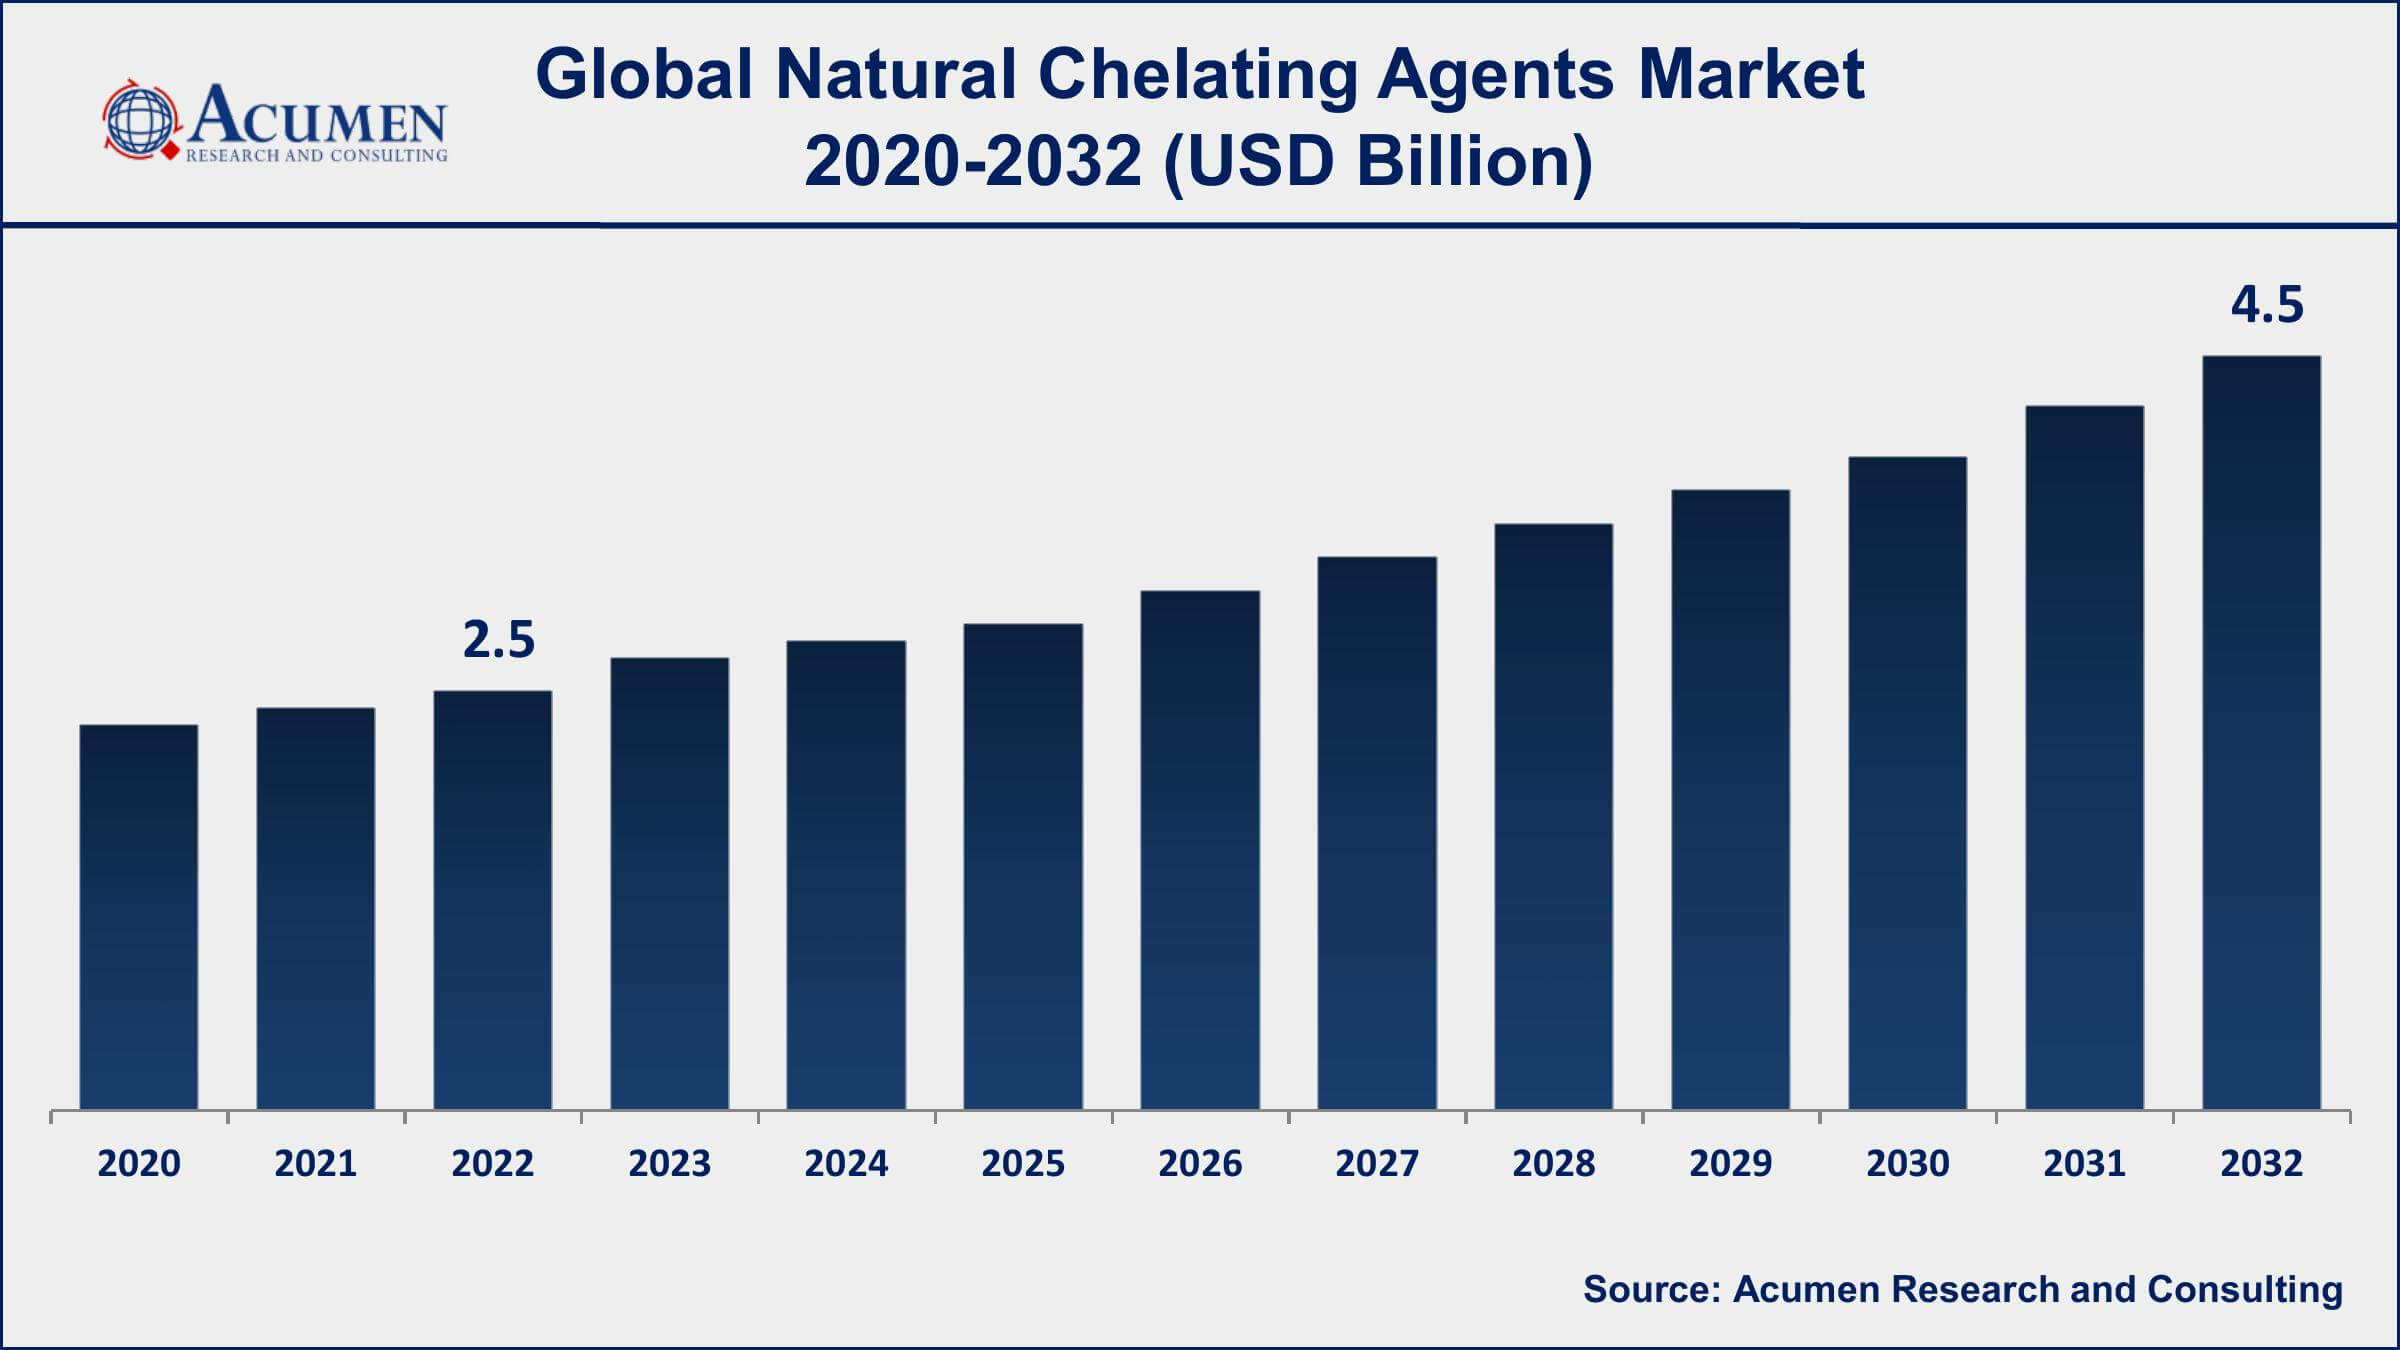
The Global Natural Chelating Agents Market Size accounted for USD 2.5 Billion in 2022 and is projected to achieve a market size of USD 4.5 Billion by 2032 growing at a CAGR of 5.9% from 2023 to 2032.
Natural Chelating Agents Market Highlights
- Global natural chelating agents market revenue is expected to increase by USD 4.5 Billion by 2032, with a 5.9% CAGR from 2023 to 2032
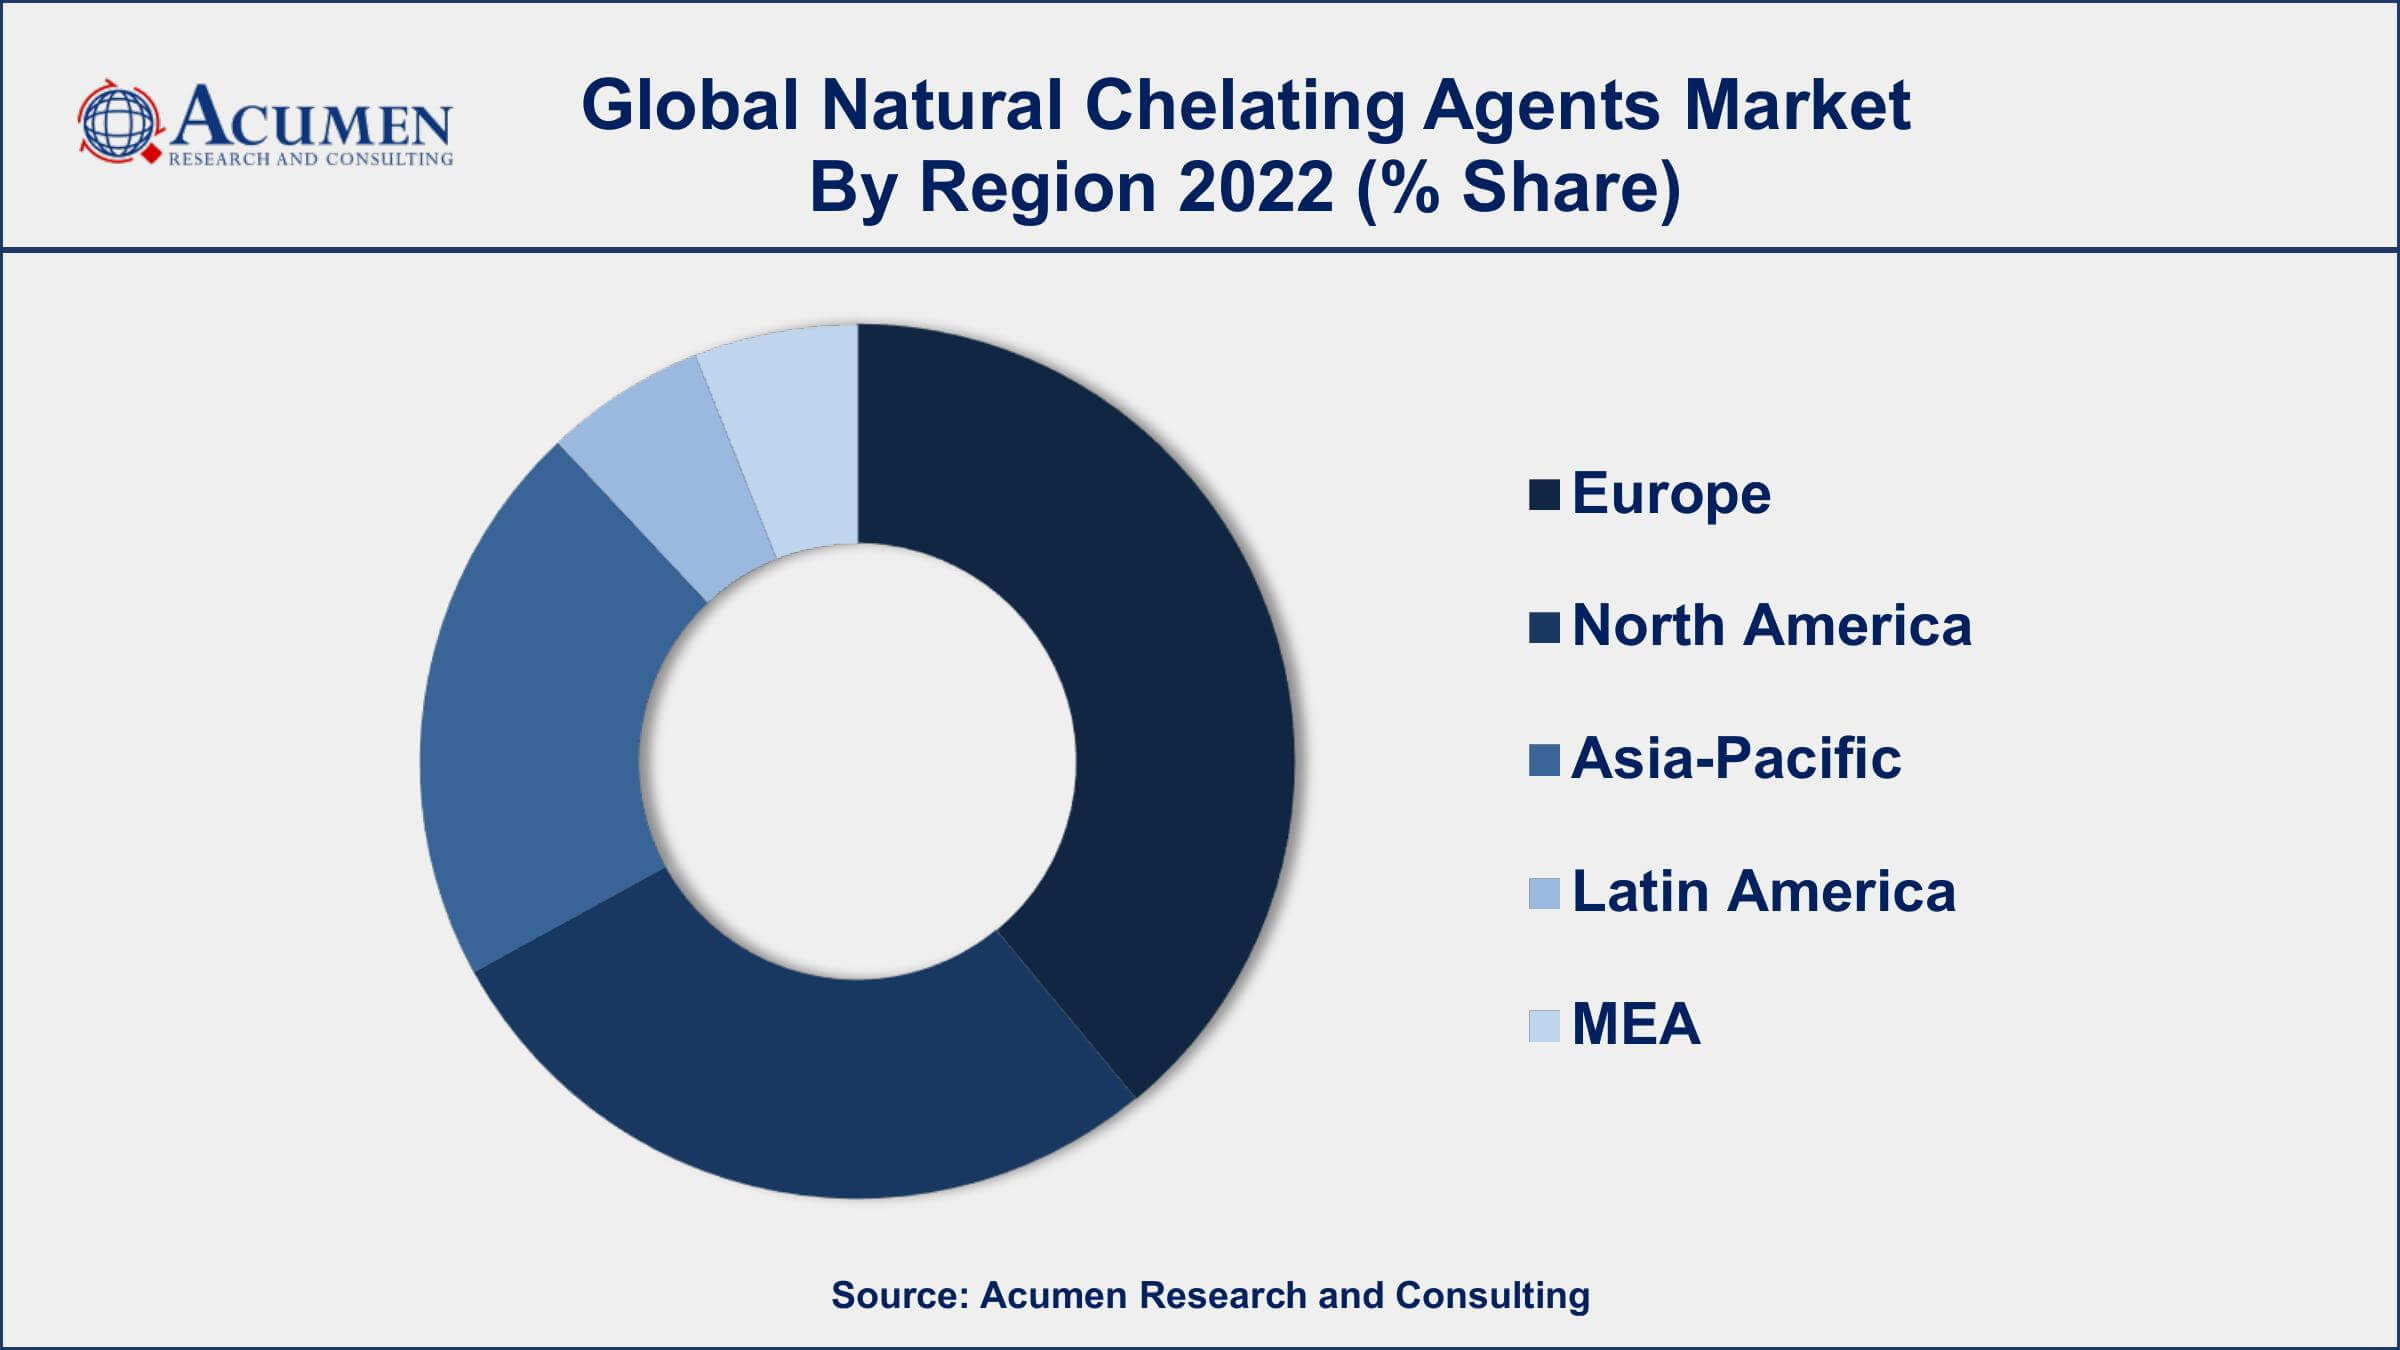
- Europe region led with more than 38% of natural chelating agents market share in 2022
- Asia-Pacific natural chelating agents market growth will record a CAGR of more than 6.5% from 2023 to 2032
- By product, the sodium gluconate segment accounted for the largest share of the market in 2022
- By application, the food and beverages segment is expected to grow at a CAGR of 6.7% from 2023 to 2032
- Rising demand in pharmaceutical and cosmetic, drives the natural chelating agents market value

Natural chelating agents are substances that have the ability to bind with metal ions, forming a stable complex that can be excreted from the body. They are commonly found in nature and are often used in various industries as a natural alternative to synthetic chelating agents. Natural chelating agents can be derived from plants, fruits, vegetables, and other natural sources, and are often used in the food and beverage, pharmaceutical, and cosmetic industries.
The market for natural chelating agents is expected to grow significantly in the coming years, due to the increasing demand for natural and organic products across various industries. The food and beverage industry is one of the major consumers of natural chelating agents, as they are used to prevent the oxidation of food products and to enhance their shelf life. In addition, the rising demand for natural cosmetics and personal care products is also driving the growth of the natural chelating agents market, as they are used as preservatives and stabilizers in these products.

Global Natural Chelating Agents Market Trends
Market Drivers
- Increasing demand for natural and organic products
- Growing awareness about the harmful effects of synthetic chelating agents
- Rising demand for chelating agents in various industries, such as food and beverage, pharmaceutical, and cosmetic
- Enhanced stability and shelf life of products due to the use of natural chelating agents
Market Restraints
- Limited availability of natural chelating agents
- High cost of natural chelating agents compared to synthetic chelating agents
Market Opportunities
- Development of new natural chelating agents with enhanced properties and efficacy
- Adoption of sustainable and environmentally friendly practices in various industries, leading to the increased use of natural chelating agents
Natural Chelating Agents Market Report Coverage
| Market | Natural Chelating Agents Market |
| Natural Chelating Agents Market Size 2022 | USD 2.5 Billion |
| Natural Chelating Agents Market Forecast 2032 | USD 4.5 Billion |
| Natural Chelating Agents Market CAGR During 2023 - 2032 | 5.9% |
| Natural Chelating Agents Market Analysis Period | 2020 - 2032 |
| Natural Chelating Agents Market Base Year | 2022 |
| Natural Chelating Agents Market Forecast Data | 2023 - 2032 |
| Segments Covered | By Product, By Source, By Application, And By Geography |
| Regional Scope | North America, Europe, Asia Pacific, Latin America, and Middle East & Africa |
| Key Companies Profiled | BASF SE, Archer Daniels Midland Company, Cargill, Incorporated, DuPont, DSM Nutritional Products AG, Akzo Nobel N.V., Ashland Global Holdings Inc., Innospec Inc., Sigma-Aldrich Corporation, The Dow Chemical Company, Ecolab Inc., and Solvay S.A. |
| Report Coverage |
Market Trends, Drivers, Restraints, Competitive Analysis, Player Profiling, Covid-19 Analysis, Regulation Analysis |
Natural chelating agents are recyclable materials that are used for cleaning and washing. Chelating agents are mainly used in surface care, laundry, home care, and detergents. Artificial chelating agents are non-recyclable and have an adverse effect on the environment as they are composed of heavy metals. These metals are very poisonous to soil and water. Unlike artificial chelating agents, natural chelating agents are produced through computational tools and biotechnological methods. Household and industrial cleaning are the two main uses of natural chelating agents. Laundry detergents, automatic dishwashing, surface cleaning, and hand dishwashing are the major areas of household cleaning, whereas equipment cleaning, mechanical dishwashing, and others are the applications of natural chelating agents under industrial cleaning.
The market growth for natural chelating agents is supported by the change in the shift of the manufacturing sector towards finding innovative, and environmentally friendly designs. Moreover, rigorous water and environment prevention regulations to minimize the adverse effects of chemicals on the environment also support the growth of the natural chelating agents market. In addition, the upsurge in the FMCG industry in developing economies boosts the demand for natural chelating agents. However, the high cost of natural chelating agents is the major restraining factor for the market. Moreover, the ease of availability of substitutes for natural chelating agents also hampers market growth. Nevertheless, research activity to develop newer recyclable agents offers opportunities for further development in the market.
Natural Chelating Agents Market Segmentation
The global natural chelating agents market segmentation is based on product, source, application, and geography.
Natural Chelating Agents Market By Product
- Sodium Gluconate
- Ethylene Diamine Disuccinate (EDDS)
- Sodium Iminodisuccinate
- Methylglycine Diacetic Acid (MGDA)
- Iminodisuccinic Acid (IDSA)
- Glutamic Acid Diacetate (GLDA)
- Others
According to the natural chelating agents industry analysis, the sodium gluconate segment accounted for the largest market share in 2022. Sodium gluconate is one of the most commonly used natural chelating agents, due to its ability to chelate a wide range of metal ions, including calcium, magnesium, and iron. It is derived from glucose, a natural sugar found in many fruits and vegetables. Sodium gluconate is widely used in the food and beverage industry, as it helps to prevent the oxidation of food products, and also acts as a preservative and stabilizer. The market for sodium gluconate as a natural chelating agent is expected to grow significantly in the coming years, due to the increasing demand for natural and organic products across various industries. In addition to its use in the food and beverage industry, sodium gluconate is also used in the pharmaceutical and cosmetic industries, as it helps to stabilize formulations and improve the efficacy of active ingredients.
Natural Chelating Agents Market By Source
- Microorganism
- Plants
In terms of sources, the microorganism segment is expected to witness significant growth in the coming years. Microorganisms such as bacteria and fungi are a potential source of natural chelating agents. They produce various organic acids, such as citric acid, oxalic acid, and gluconic acid, which have chelating properties. These organic acids can be produced through fermentation processes using microorganisms and can be used as natural chelating agents in various industries. The market for microorganism-based natural chelating agents is expected to grow in the coming years, due to the increasing demand for sustainable and environmentally friendly products. Microorganisms are a renewable resource, and their use as a source of natural chelating agents can help reduce the environmental impact of various industries.
Natural Chelating Agents Market By Application
- Detergents & Cleaning Agents
- Pulp and Paper
- Personal Care & Cosmetics
- Food and Beverage
- Agrichemicals
- Water Treatment
- Others
According to the natural chelating agents market forecast, the food and beverage segment is expected to witness significant growth in the coming years. Natural chelating agents such as citric acid, tartaric acid, and sodium gluconate are widely used in the food and beverage industry as preservatives, stabilizers, and anti-oxidants. They help prevent the oxidation of food products and also enhance the shelf life and quality of food products. The market for natural chelating agents in the food and beverage industry is expected to grow significantly in the coming years, due to the increasing demand for natural and organic food products. Consumers are becoming more conscious of the health and environmental impacts of the food they consume, and are seeking natural and organic alternatives to synthetic additives.
Natural Chelating Agents Market Regional Outlook
North America
- U.S.
- Canada
Europe
- U.K.
- Germany
- France
- Spain
- Rest of Europe
Asia-Pacific
- India
- Japan
- China
- Australia
- South Korea
- Rest of Asia-Pacific
Latin America
- Brazil
- Mexico
- Rest of Latin America
The Middle East & Africa
- South Africa
- GCC Countries
- Rest of the Middle East & Africa (ME&A)

Natural Chelating Agents Market Regional Analysis
Geographically, Europe is a dominant region in the natural chelating agents market, due to various factors such as stringent regulations, high awareness about sustainable practices, and the presence of leading manufacturers of natural chelating agents. The European Union has implemented regulations that restrict the use of synthetic chelating agents in various industries, which has led to the increasing demand for natural chelating agents. This has created a favorable market environment for the natural chelating agents industry in Europe. Moreover, Europe has a high level of awareness about sustainable practices and environmental protection, which has led to the increasing demand for natural and eco-friendly products. This has further driven the demand for natural chelating agents, which are biodegradable, non-toxic, and do not harm the environment. Consumers in Europe are willing to pay a premium for products that are sustainable and environmentally friendly, which has further boosted the growth of the natural chelating agents market in the region. Furthermore, Europe is home to several leading manufacturers of natural chelating agents, who have invested in research and development activities to develop new and innovative products.
Natural Chelating Agents Market Player
Some of the top natural chelating agents market companies offered in the professional report include BASF SE, Archer Daniels Midland Company, Cargill, Incorporated, DuPont, DSM Nutritional Products AG, Akzo Nobel N.V., Ashland Global Holdings Inc., Innospec Inc., Sigma-Aldrich Corporation, The Dow Chemical Company, Ecolab Inc., and Solvay S.A.
Frequently Asked Questions
What was the market size of the global natural chelating agents in 2022?
What was the market size of the global natural chelating agents in 2022?
What is the CAGR of the global natural chelating agents market from 2023 to 2032?
The CAGR of natural chelating agents is 5.9% during the analysis period of 2023 to 2032.
Which are the key players in the natural chelating agents market?
The key players operating in the global market are including BASF SE, Archer Daniels Midland Company, Cargill, Incorporated, DuPont, DSM Nutritional Products AG, Akzo Nobel N.V., Ashland Global Holdings Inc., Innospec Inc., Sigma-Aldrich Corporation, The Dow Chemical Company, Ecolab Inc., and Solvay S.A.
Which region dominated the global natural chelating agents market share?
Europe held the dominating position in natural chelating agents industry during the analysis period of 2023 to 2032.
Which region registered fastest CAGR from 2023 to 2032?
Asia-Pacific region exhibited fastest growing CAGR for market of natural chelating agents during the analysis period of 2023 to 2032.
What are the current trends and dynamics in the global natural chelating agents industry?
The current trends and dynamics in the natural chelating agents industry include increasing demand for natural and organic products, growing awareness about the harmful effects of synthetic chelating agents, and rising demand for chelating agents in various industries, such as food and beverage, pharmaceutical, and cosmetic.
Which source held the maximum share in 2022?
The sodium gluconate source held the maximum share of the natural chelating agents industry.


