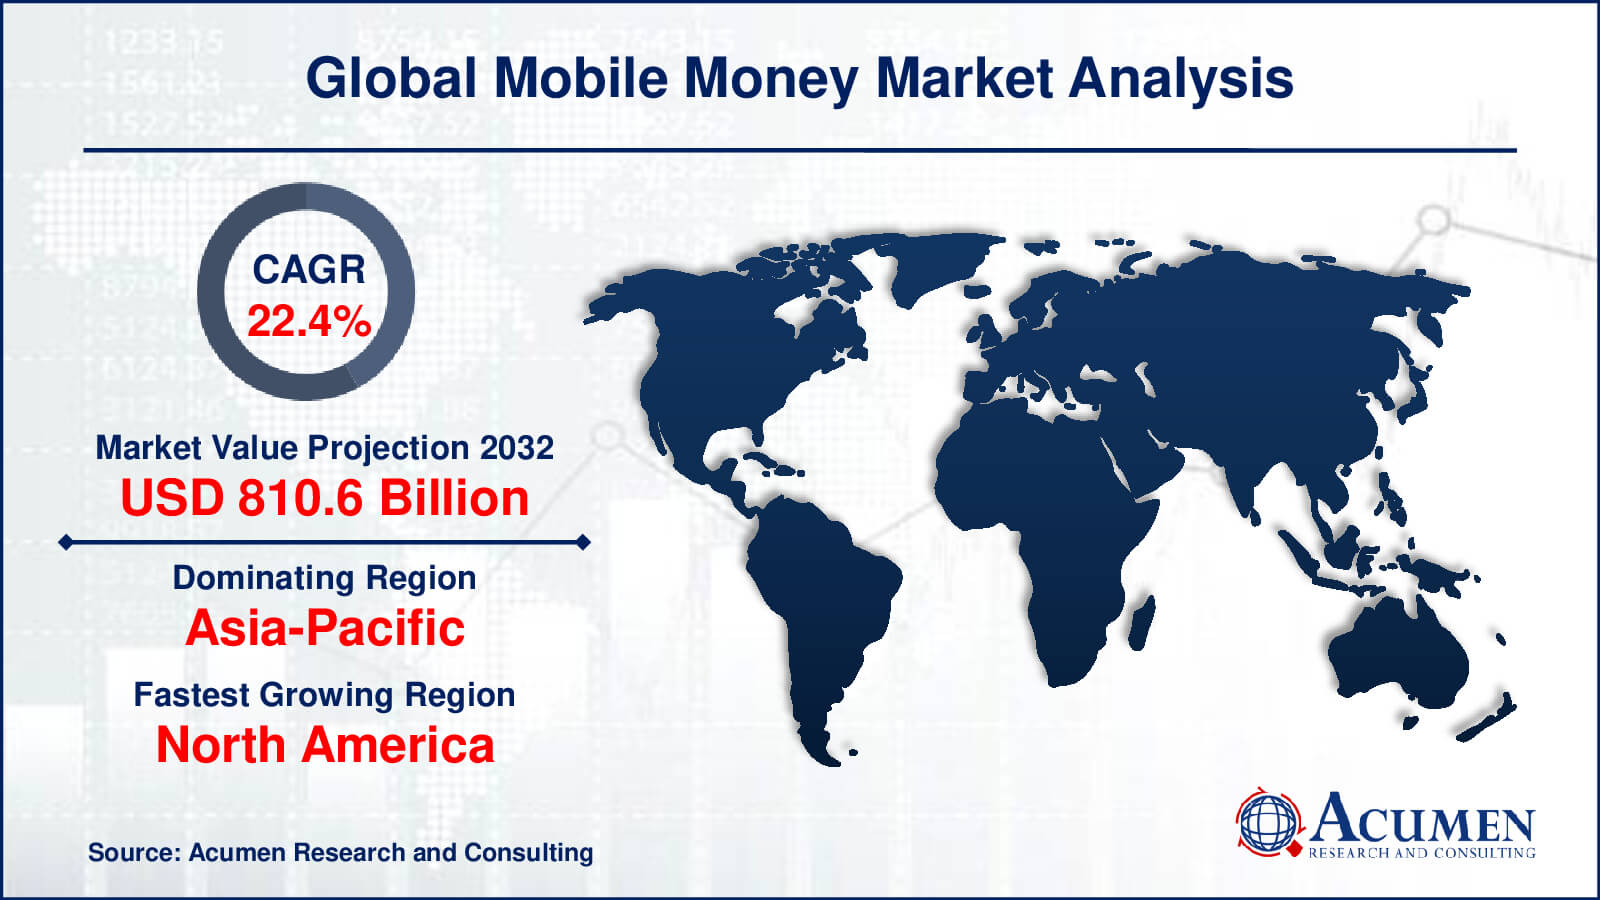
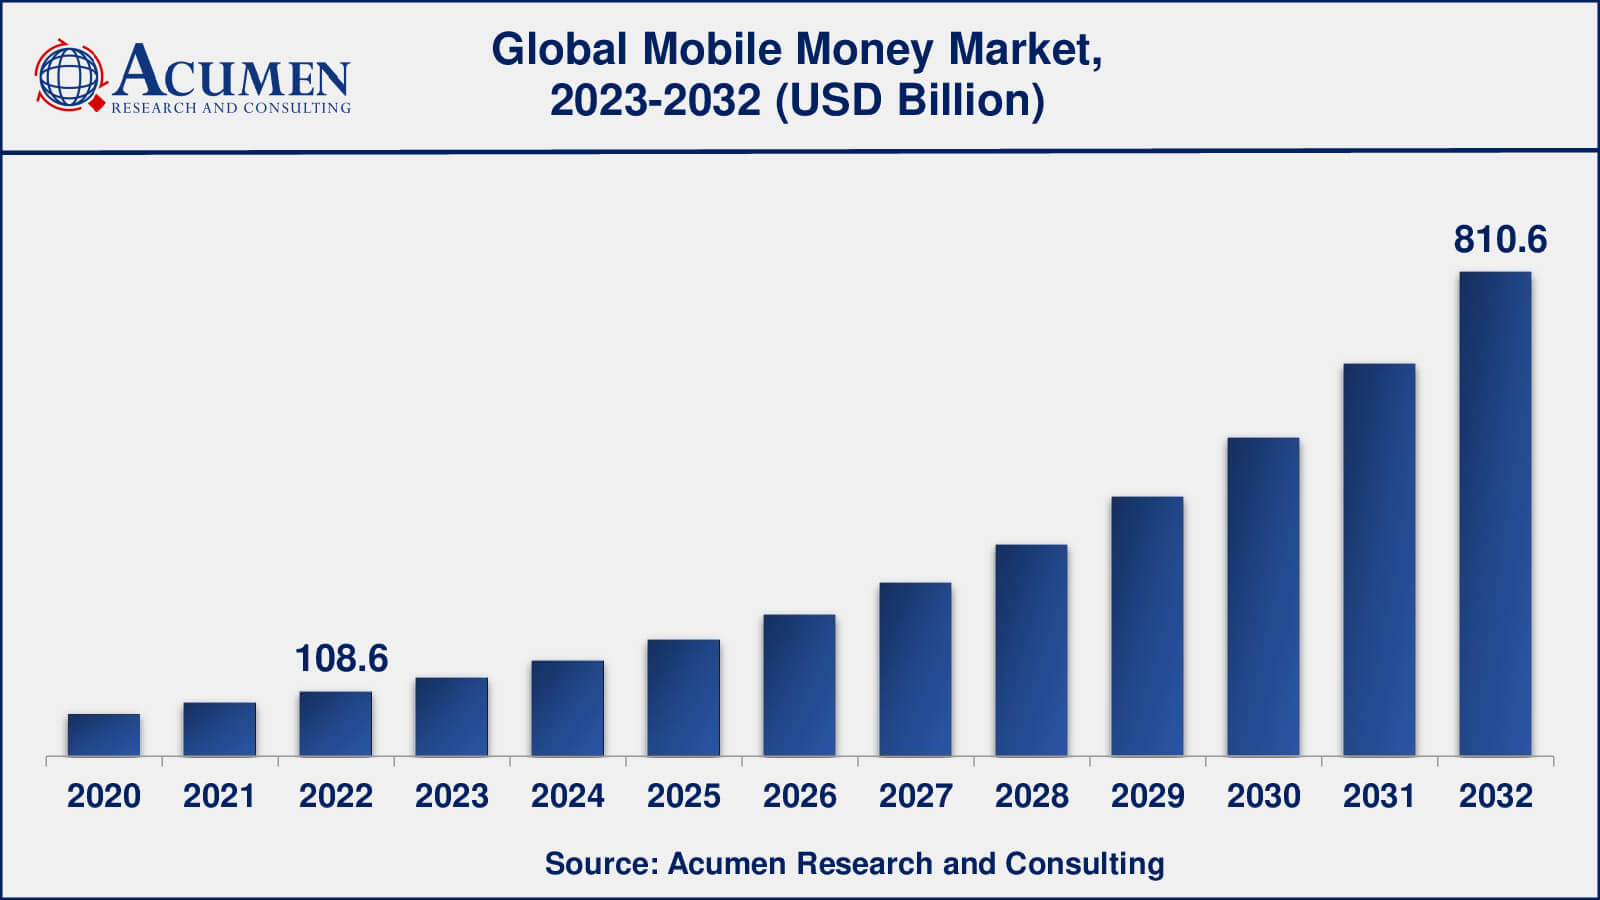
The Global Mobile Money Market Size collected USD 108.6 Billion in 2022 and is set to achieve a market size of USD 810.6 Billion in 2032 growing at a CAGR of 22.4% from 2023 to 2032.
Mobile Money Market Report Statistics
- Global mobile money market revenue is estimated to reach USD 810.6 billion by 2032 with a CAGR of 22.4% from 2023 to 2032
- Asia-Pacific mobile money market value occupied more than USD 43 billion in 2022
- North America mobile money market growth will record a CAGR of more than 19% from 2023 to 2032
- Among types of payment, the proximity payments sub-segment generated around 55% share in 2022
- Based on industry vertical, the IT & telecom generated more than 40% share in 2022
- Integration with other financial services is a popular mobile money market trend that fuels the industry demand
The mobile money market is on the brink of a change of transformation with the key growths rapidly turning towards emerging economies such as India, China, Indonesia, Argentina, Russia, Poland, etc. The global mobile money market is anticipated to derive growth from various factors including real-time marketing to leverage mobile money as well as companies investing in context-based marketing. Owing to the increasing sale of smartphones and personal devices, especially in emerging countries along with an increasingly influenced consumer base, the demand for more efficient banking technologies is anticipated to boost the demand for mobile money services and related technologies. The aforementioned factors present a bright opportunity for market players such as Fortumo OÜ, Bango.net Limited, Judo Payments, and Paypal, Inc. among others. Services such as mobile banking, mobile commerce, mobile payments, and mobile wallet among others come under the scope of the global mobile money market. Most recently, various mobile money service providers are concentrating on cost-effective substitutes and alternatives to expect a relatively larger consumer base across the globe. However, customers are anticipated to continue to remain dicey about the privacy and security of mobile money services and this situation is compounded by a strict regulatory framework which is a key factor anticipated to hamper the long-term growth of the global mobile money market. Mobile money is a secure, affordable, and quick way of transferring money from one person to other, thus making payments and other related transactions using a smartphone.
Global Mobile Money Market Dynamics
Market Drivers
- Increased mobile phone penetration
- Growing adoption of digital payments
- Rising government support
- Expansion of digital financial services
- Emergence of mobile wallets
Market Restraints
- Limited financial literacy
- Lack of infrastructure
- Security concerns
Market Opportunities
- Innovative business models
- Growing demand for financial services
- Integration with e-commerce platforms
Mobile Money Market Report Coverage
Market |
Mobile Money Market |
Mobile Money Market Size 2022 |
USD 108.6 Billion |
Mobile Money Market Forecast 2032 |
USD 810.6 Billion |
Mobile Money Market CAGR During 2023 - 2032 |
22.4% |
Mobile Money Market Analysis Period |
2020 - 2032 |
Mobile Money Market Base Year |
2022 |
Mobile Money Market Forecast Data |
2023 - 2032 |
Segments Covered |
By Transaction Mode, By Nature Of Payment, By Type of Payments, By Application, By Industry Vertical, And By Geography
|
Regional Scope |
North America, Europe, Asia Pacific, Latin America, and Middle East & Africa |
Key Companies Profiled |
Bango.net Limited, Dwolla, Inc., Google, Boku, Inc., Judo Payments, Mastercard, Square, Inc., Gemalto, Paypal, Inc., PAYTM, VISA, and WePay, Inc.
|
Report Coverage
|
Market Trends, Drivers, Restraints, Competitive Analysis, Player Profiling, Covid-19 Analysis, Regulation Analysis |
Mobile Money Market Growth Factors
Advancements in technology in mobile devices as well as rapidly increasing requirements to cater to ubiquitous access to financial solutions coupled with increasing employment of non-cash payments, evolving demographic needs across regions, creation of new business avenues for stakeholders and rising use of mobile money services across various businesses are some of the key factors fuelling the growth of global mobile money market. Furthermore, the ever-changing technology coupled with innovations in new product lines is some of the major aspects accelerating the growth of the global mobile money market.
Mobile Money Market Segmentation
The worldwide mobile money market is categorized based on transaction mode, nature of payment, type of payments, application, industry vertical, and geography.
Mobile Money Market By Transaction Mode
- NFC/Smart Card
- Direct Mobile Billing
- Mobile Web/WAP Payments
- SMS
- STK/USSD
- Mobile Apps
- IVRS
- QR Codes
- Others
According to the mobile money market forecast, mobile apps and USSD/STK (Unstructured Supplementary Service Data/SIM Toolkit) are currently the most widely used transaction modes in the mobile money market, generating the largest share of mobile money transactions. Mobile apps are popular due to their ease of use and the variety of features they provide, such as balance inquiries, money transfers, bill payments, and other financial services. USSD/STK is a menu-based system that allows users to access mobile money services via their phones without the use of a smartphone or a data connection.
However, the popularity of transaction modes varies according to region and use case. NFC/Smart Card, for example, may be more prevalent in markets with a strong payment infrastructure, whereas SMS-based mobile money services may be more pervasive in markets with low smartphone penetration rates.
Mobile Money Market By Nature Of Payment
- Person to Person (P2P)
- Person to Business (P2B)
- Business to Person (B2P)
- Business to Business (B2B)
According to our mobile money industry research, person-to-person (P2P) payments currently account for the largest share of mobile money transactions, followed by person-to-business (P2B) payments. P2P payments are popular because they allow people to quickly and easily transfer money to friends and family without the need for cash or bank accounts. This type of payment is especially useful in areas where traditional banking services are unavailable.
P2B payments are also becoming more popular as more businesses accept mobile payments. P2B payments can be used for a variety of services, including bill payment, purchasing goods and services, and topping up mobile airtime. Business-to-person (B2P) and business-to-business (B2B) payments are less common in the mobile money market, but they are becoming more popular as more businesses use mobile money for payroll processing and other financial services
Mobile Money Market By Type of Payments
- Remote Payments
- Proximity Payments
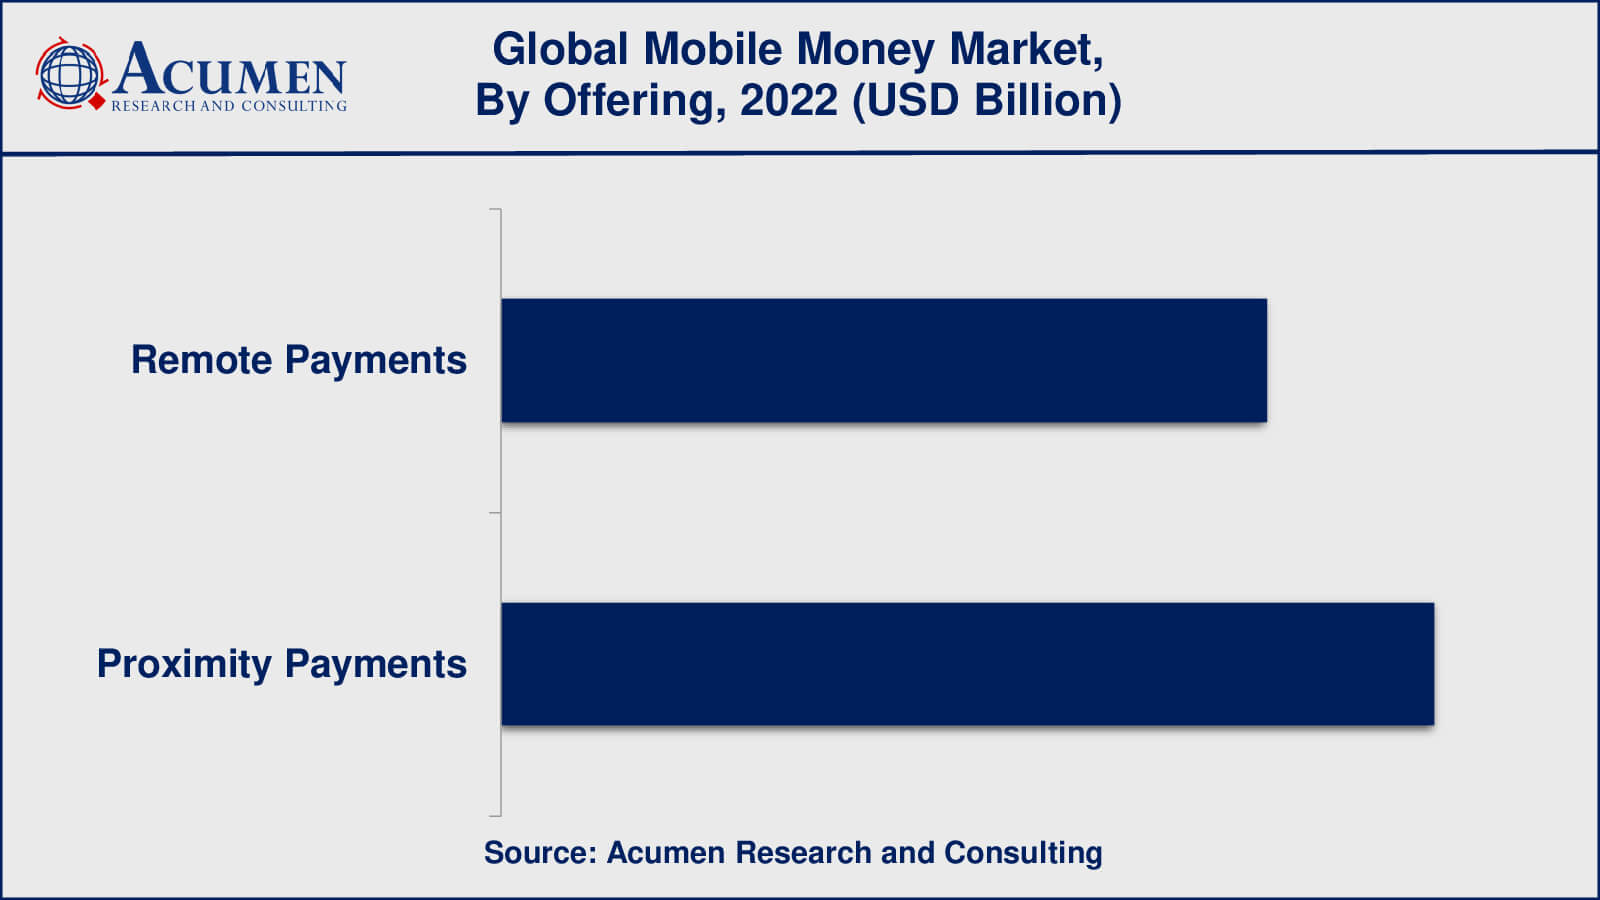
In the mobile money market, both remote payments and proximity payments are popular, and the proportion of transactions generated by each payment type varies depending on region and market conditions.
Remote payments, also known as online or e-commerce payments are internet-based transactions that are initiated and authorized using a mobile device or computer. Remote payments, which can be made from anywhere with an internet connection, are popular for online shopping and bill payments.
Proximity payments, also known as in-person or point-of-sale (POS) payments are transactions conducted between a customer and a merchant or service provider. Contactless payments utilizing NFC (Near Field Communication) technology, QR codes, and mobile wallet payments are examples of proximity payments. Proximity payments are common for in-store purchases, public transportation, and other services that necessitate a physical presence.
Mobile Money Market By Application
- Money transfers
- Bill Payments
- Airtime Transfer and Top-Ups
- Travel and Ticketing
- Merchandise
- Coupons
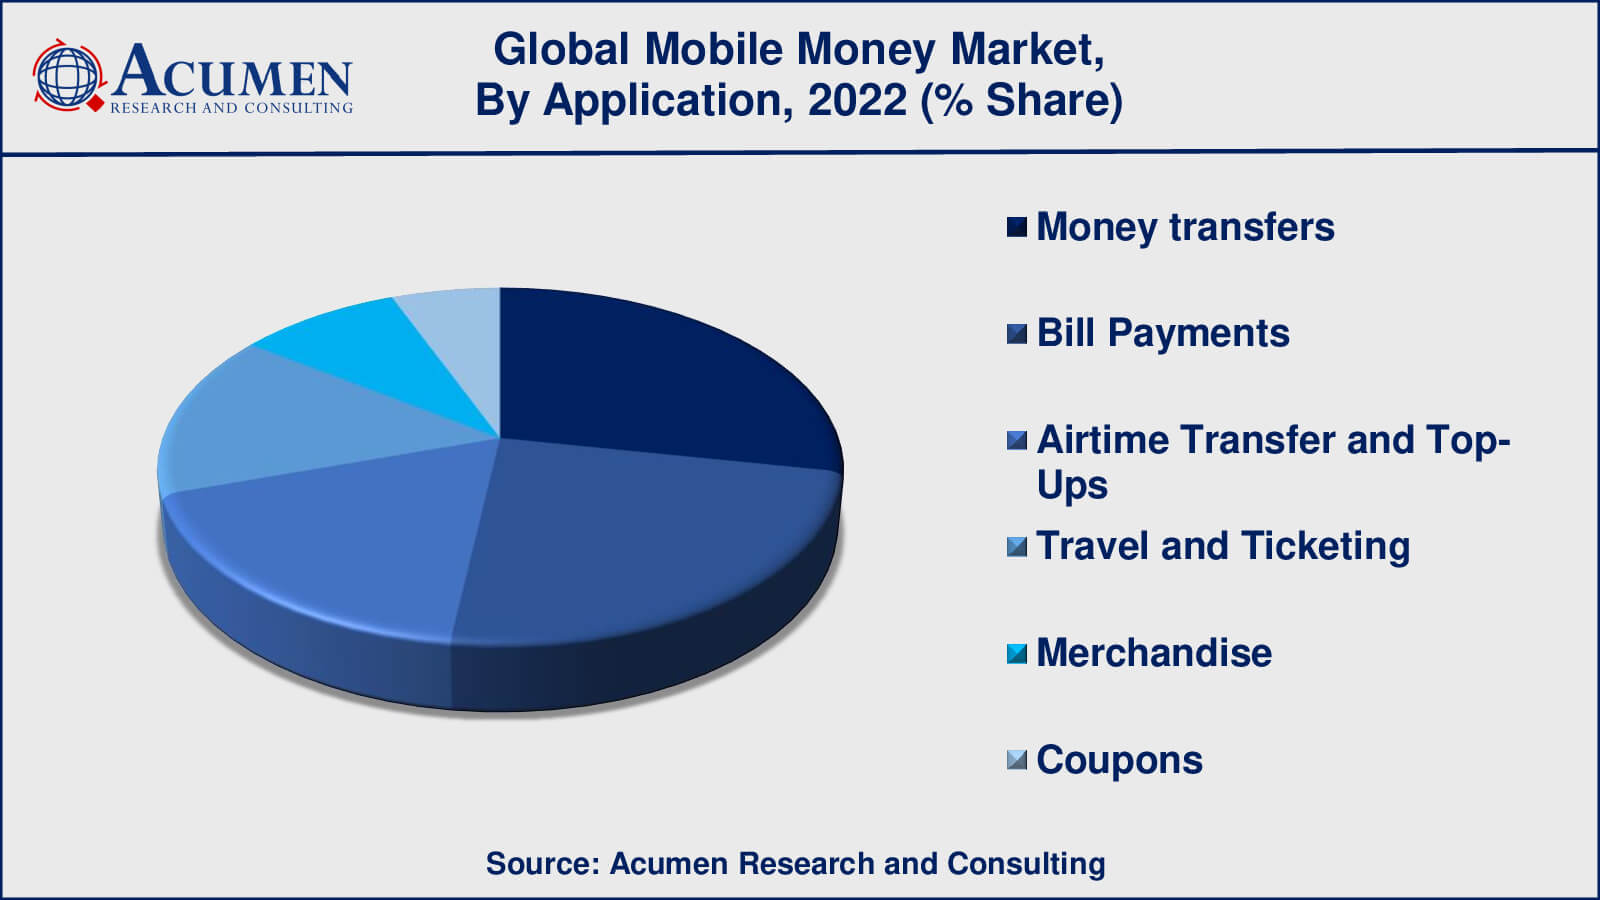
Money transfers and bill payments are the most commonly used mobile money applications, accounting for the majority of mobile money transactions in 2022. Money transfers are a crucial component of mobile money because they make it simple and quick for people to send and receive money without a bank account. Mobile money providers provide a variety of transfer options, including P2P transfers, international remittances, and merchant payments. Bill payments are also popular because they allow people to pay their bills quickly and easily without the use of cash or checks. Bill payment services are provided by mobile money providers for a variety of bills, including utilities, insurance premiums, and loan repayments.
Mobile Money Market By Industry Vertical
- BFSI
- Telecom and IT
- Media and entertainment
- Healthcare
- Retail
- Travel and hospitality
- Transportation and logistics
- Energy and utilities
- Others
As telecom companies have been at the forefront of mobile money innovation, the telecom and IT industry vertical is a major player in the mobile money market. Telecom companies have a significant advantage in the mobile money market because they already have a customer base and infrastructure in place. Along with the telecom and IT sectors, mobile money has experienced rapid expansion in the BFSI (banking, financial services, and insurance), retail, healthcare, travel and hospitality, and transportation and logistics sectors.
BFSI firms are increasingly entering the mobile money market, seeing it as a way to reach underserved populations and grow their customer base. Retailers are also embracing mobile money to simplify payments and improve the customer experience. Mobile money is used by healthcare providers for patient payments and medical reimbursements, while travel and hospitality companies use it for bookings and payments.
Mobile Money Market Regional Outlook
North America
Europe
- U.K.
- Germany
- France
- Spain
- Rest of Europe
Asia-Pacific
- India
- Japan
- China
- Australia
- South Korea
- Rest of Asia-Pacific
Latin America
- Brazil
- Mexico
- Rest of Latin America
The Middle East & Africa
- South Africa
- GCC Countries
- Rest of the Middle East & Africa (ME&A)
Mobile Money Market Regional Analysis
The Asia-Pacific region has a sizable mobile money market, with China and India leading the way. Mobile payments have become the dominant form of payment in China, with over 80% of urban Chinese consumers using them. With the launch of the government-backed Unified Payments Interface (UPI) in 2016, India has also seen rapid growth in mobile payments.
With over 400 million registered mobile money accounts, Africa has one of the world's largest and most active mobile money markets. Mobile money has had a significant impact on financial inclusion in Africa, especially in rural areas with limited access to traditional banking services. Kenya, Tanzania, and Uganda are among the countries with the highest rates of mobile money adoption, while Nigeria and South Africa are emerging as key players in the mobile money market.
While mobile money adoption in Europe and North America is lower than in other regions, there is still significant growth potential. In Europe, countries such as Sweden, Denmark, and the Netherlands were early adopters of mobile payments, whereas in North America, mobile payments are getting momentum with the pervasive adoption of digital wallets and contactless payments.
Mobile Money Market Players
Some of the global mobile money companies profiled in the report include Bango.net Limited, Dwolla, Inc., Google, Boku, Inc., Judo Payments, Mastercard, Square, Inc., Gemalto, Paypal, Inc., PAYTM, VISA, and WePay, Inc.
CHAPTER 1. Industry Overview of Mobile Money Market
1.1. Definition and Scope
1.1.1. Definition of Mobile Money
1.1.2. Market Segmentation
1.1.3. Years Considered for the Study
1.1.4. Assumptions and Acronyms Used
1.1.4.1. Market Assumptions and Market Forecast
1.1.4.2. Acronyms Used in Global Mobile Money Market
1.2. Summary
1.2.1. Executive Summary
1.2.2. Mobile Money Market By Transaction Mode
1.2.3. Mobile Money Market By Nature Of Payment
1.2.4. Mobile Money Market By Type of Payments
1.2.5. Mobile Money Market By Application
1.2.6. Mobile Money Market By Industry Vertical
1.2.7. Mobile Money Market By Region
CHAPTER 2. Research Approach
2.1. Methodology
2.1.1. Research Programs
2.1.2. Market Size Estimation
2.1.3. Market Breakdown and Data Triangulation
2.2. Data Source
2.2.1. Secondary Sources
2.2.2. Primary Sources
CHAPTER 3. Market Dynamics And Competition Analysis
3.1. Market Drivers
3.1.1. Driver 1
3.1.2. Driver 2
3.2. Restraints and Challenges
3.2.1. Restraint 1
3.2.2. Restraint 2
3.3. Growth Opportunities
3.3.1. Opportunity 1
3.3.2. Opportunity 2
3.4. Porter’s Five Forces Analysis
3.4.1. Bargaining Power of Suppliers
3.4.2. Bargaining Power of Buyers
3.4.3. Threat of Substitute
3.4.4. Threat of New Entrants
3.4.5. Degree of Competition
3.5. Market Concentration Ratio and Market Maturity Analysis of Mobile Money Market
3.5.1. Go To Market Strategy
3.5.1.1. Introduction
3.5.1.2. Growth
3.5.1.3. Maturity
3.5.1.4. Saturation
3.5.1.5. Possible Development
3.6. Technological Roadmap for Mobile Money Market
3.7. Value Chain Analysis
3.7.1. List of Key Manufacturers
3.7.2. List of Customers
3.7.3. Level of Integration
3.8. Regulatory Compliance
3.9. Competitive Landscape, 2022
3.9.1. Player Positioning Analysis
3.9.2. Key Strategies Adopted By Leading Players
CHAPTER 4. Flooring & Wall Panels Plant Analysis
4.1. Manufacturing Plant Location and Establish Date of Major Manufacturers in 2022
4.2. R&D Status of Major Manufacturers in 2022
CHAPTER 5. Mobile Money Market By Transaction Mode
5.1. Introduction
5.2. Mobile Money Market Revenue By Transaction Mode
5.2.1. Mobile Money Market Revenue (USD Billion) and Forecast, By Transaction Mode, 2020-2032
5.2.2. NFC/Smart Card
5.2.2.1. NFC/Smart Card Market Revenue (USD Billion) and Growth Rate (%), 2020-2032
5.2.3. Direct Mobile Billing
5.2.3.1. Direct Mobile Billing Market Revenue (USD Billion) and Growth Rate (%), 2020-2032
5.2.4. Mobile Web/WAP Payments
5.2.4.1. Mobile Web/WAP Payments Market Revenue (USD Billion) and Growth Rate (%), 2020-2032
5.2.5. SMS
5.2.5.1. SMS Market Revenue (USD Billion) and Growth Rate (%), 2020-2032
5.2.6. STK/USSD
5.2.6.1. STK/USSD Market Revenue (USD Billion) and Growth Rate (%), 2020-2032
5.2.7. Mobile Apps
5.2.7.1. Mobile Apps Market Revenue (USD Billion) and Growth Rate (%), 2020-2032
5.2.8. IVRS
5.2.8.1. IVRS Market Revenue (USD Billion) and Growth Rate (%), 2020-2032
5.2.9. QR Codes
5.2.9.1. QR Codes Market Revenue (USD Billion) and Growth Rate (%), 2020-2032
5.2.10. Others
5.2.10.1. Others Market Revenue (USD Billion) and Growth Rate (%), 2020-2032
CHAPTER 6. Mobile Money Market By Nature Of Payment
6.1. Introduction
6.2. Mobile Money Market Revenue By Nature Of Payment
6.2.1. Mobile Money Market Revenue (USD Billion) and Forecast, By Nature Of Payment, 2020-2032
6.2.2. Person to Person (P2P)
6.2.2.1. Person to Person (P2P) Market Revenue (USD Billion) and Growth Rate (%), 2020-2032
6.2.3. Person to Business (P2B)
6.2.3.1. Person to Business (P2B) Market Revenue (USD Billion) and Growth Rate (%), 2020-2032
6.2.4. Business to Person (B2P)
6.2.4.1. Business to Person (B2P) Market Revenue (USD Billion) and Growth Rate (%), 2020-2032
6.2.5. Business to Business (B2B)
6.2.5.1. Business to Business (B2B) Market Revenue (USD Billion) and Growth Rate (%), 2020-2032
CHAPTER 7. Mobile Money Market By Type of Payments
7.1. Introduction
7.2. Mobile Money Market Revenue By Type of Payments
7.2.1. Mobile Money Market Revenue (USD Billion) and Forecast, By Type of Payments, 2020-2032
7.2.2. Remote Payments
7.2.2.1. Remote Payments Market Revenue (USD Billion) and Growth Rate (%), 2020-2032
7.2.3. Proximity Payments
7.2.3.1. Proximity Payments Market Revenue (USD Billion) and Growth Rate (%), 2020-2032
CHAPTER 8. Mobile Money Market By Application
8.1. Introduction
8.2. Mobile Money Market Revenue By Application
8.2.1. Mobile Money Market Revenue (USD Billion) and Forecast, By Application, 2020-2032
8.2.2. Money Transfers
8.2.2.1. Money Transfers Market Revenue (USD Billion) and Growth Rate (%), 2020-2032
8.2.3. Bill Payments
8.2.3.1. Bill Payments Market Revenue (USD Billion) and Growth Rate (%), 2020-2032
8.2.4. Airtime Transfer and Top-Ups
8.2.4.1. Airtime Transfer and Top-Ups Market Revenue (USD Billion) and Growth Rate (%), 2020-2032
8.2.5. Travel and Ticketing
8.2.5.1. Travel and Ticketing Market Revenue (USD Billion) and Growth Rate (%), 2020-2032
8.2.6. Merchandise
8.2.6.1. Merchandise Market Revenue (USD Billion) and Growth Rate (%), 2020-2032
8.2.7. Coupons
8.2.7.1. Coupons Market Revenue (USD Billion) and Growth Rate (%), 2020-2032
CHAPTER 9. Mobile Money Market By Industry Vertical
9.1. Introduction
9.2. Mobile Money Market Revenue By Industry Vertical
9.2.1. Mobile Money Market Revenue (USD Billion) and Forecast, By Industry Vertical, 2020-2032
9.2.2. BFSI
9.2.2.1. BFSI Market Revenue (USD Billion) and Growth Rate (%), 2020-2032
9.2.3. Telecom and IT
9.2.3.1. Telecom and IT Market Revenue (USD Billion) and Growth Rate (%), 2020-2032
9.2.4. Media and Entertainment
9.2.4.1. Media and Entertainment Market Revenue (USD Billion) and Growth Rate (%), 2020-2032
9.2.5. Healthcare
9.2.5.1. Healthcare Market Revenue (USD Billion) and Growth Rate (%), 2020-2032
9.2.6. Travel & Hospitality
9.2.6.1. Travel & Hospitality Market Revenue (USD Billion) and Growth Rate (%), 2020-2032
9.2.7. Retail
9.2.7.1. Retail Market Revenue (USD Billion) and Growth Rate (%), 2020-2032
9.2.8. Transportation and Logistics
9.2.8.1. Transportation and Logistics Market Revenue (USD Billion) and Growth Rate (%), 2020-2032
9.2.9. Energy and Utilities
9.2.9.1. Energy and Utilities Market Revenue (USD Billion) and Growth Rate (%), 2020-2032
9.2.10. Others
9.2.10.1. Others Market Revenue (USD Billion) and Growth Rate (%), 2020-2032
CHAPTER 10. North America Mobile Money Market By Country
10.1. North America Mobile Money Market Overview
10.2. U.S.
10.2.1. U.S. Mobile Money Market Revenue (USD Billion) and Forecast By Transaction Mode, 2020-2032
10.2.2. U.S. Mobile Money Market Revenue (USD Billion) and Forecast By Nature Of Payment, 2020-2032
10.2.3. U.S. Mobile Money Market Revenue (USD Billion) and Forecast By Type of Payments, 2020-2032
10.2.4. U.S. Mobile Money Market Revenue (USD Billion) and Forecast By Application, 2020-2032
10.2.5. U.S. Mobile Money Market Revenue (USD Billion) and Forecast By Industry Vertical, 2020-2032
10.3. Canada
10.3.1. Canada Mobile Money Market Revenue (USD Billion) and Forecast By Transaction Mode, 2020-2032
10.3.2. Canada Mobile Money Market Revenue (USD Billion) and Forecast By Nature Of Payment, 2020-2032
10.3.3. Canada Mobile Money Market Revenue (USD Billion) and Forecast By Type of Payments, 2020-2032
10.3.4. Canada Mobile Money Market Revenue (USD Billion) and Forecast By Application, 2020-2032
10.3.5. Canada Mobile Money Market Revenue (USD Billion) and Forecast By Industry Vertical, 2020-2032
10.4. North America PEST Analysis
CHAPTER 11. Europe Mobile Money Market By Country
11.1. Europe Mobile Money Market Overview
11.2. U.K.
11.2.1. U.K. Mobile Money Market Revenue (USD Billion) and Forecast By Transaction Mode, 2020-2032
11.2.2. U.K. Mobile Money Market Revenue (USD Billion) and Forecast By Nature Of Payment, 2020-2032
11.2.3. U.K. Mobile Money Market Revenue (USD Billion) and Forecast By Type of Payments, 2020-2032
11.2.4. U.K. Mobile Money Market Revenue (USD Billion) and Forecast By Application, 2020-2032
11.2.5. U.K. Mobile Money Market Revenue (USD Billion) and Forecast By Industry Vertical, 2020-2032
11.3. Germany
11.3.1. Germany Mobile Money Market Revenue (USD Billion) and Forecast By Transaction Mode, 2020-2032
11.3.2. Germany Mobile Money Market Revenue (USD Billion) and Forecast By Nature Of Payment, 2020-2032
11.3.3. Germany Mobile Money Market Revenue (USD Billion) and Forecast By Type of Payments, 2020-2032
11.3.4. Germany Mobile Money Market Revenue (USD Billion) and Forecast By Application, 2020-2032
11.3.5. Germany Mobile Money Market Revenue (USD Billion) and Forecast By Industry Vertical, 2020-2032
11.4. France
11.4.1. France Mobile Money Market Revenue (USD Billion) and Forecast By Transaction Mode, 2020-2032
11.4.2. France Mobile Money Market Revenue (USD Billion) and Forecast By Nature Of Payment, 2020-2032
11.4.3. France Mobile Money Market Revenue (USD Billion) and Forecast By Type of Payments, 2020-2032
11.4.4. France Mobile Money Market Revenue (USD Billion) and Forecast By Application, 2020-2032
11.4.5. France Mobile Money Market Revenue (USD Billion) and Forecast By Industry Vertical, 2020-2032
11.5. Spain
11.5.1. Spain Mobile Money Market Revenue (USD Billion) and Forecast By Transaction Mode, 2020-2032
11.5.2. Spain Mobile Money Market Revenue (USD Billion) and Forecast By Nature Of Payment, 2020-2032
11.5.3. Spain Mobile Money Market Revenue (USD Billion) and Forecast By Type of Payments, 2020-2032
11.5.4. Spain Mobile Money Market Revenue (USD Billion) and Forecast By Application, 2020-2032
11.5.5. Spain Mobile Money Market Revenue (USD Billion) and Forecast By Industry Vertical, 2020-2032
11.6. Rest of Europe
11.6.1. Rest of Europe Mobile Money Market Revenue (USD Billion) and Forecast By Transaction Mode, 2020-2032
11.6.2. Rest of Europe Mobile Money Market Revenue (USD Billion) and Forecast By Nature Of Payment, 2020-2032
11.6.3. Rest of Europe Mobile Money Market Revenue (USD Billion) and Forecast By Type of Payments, 2020-2032
11.6.4. Rest of Europe Mobile Money Market Revenue (USD Billion) and Forecast By Application, 2020-2032
11.6.5. Rest of Europe Mobile Money Market Revenue (USD Billion) and Forecast By Industry Vertical, 2020-2032
11.7. Europe PEST Analysis
CHAPTER 12. Asia-Pacific Mobile Money Market By Country
12.1. Asia-Pacific Mobile Money Market Overview
12.2. China
12.2.1. China Mobile Money Market Revenue (USD Billion) and Forecast By Transaction Mode, 2020-2032
12.2.2. China Mobile Money Market Revenue (USD Billion) and Forecast By Nature Of Payment, 2020-2032
12.2.3. China Mobile Money Market Revenue (USD Billion) and Forecast By Type of Payments, 2020-2032
12.2.4. China Mobile Money Market Revenue (USD Billion) and Forecast By Application, 2020-2032
12.2.5. China Mobile Money Market Revenue (USD Billion) and Forecast By Industry Vertical, 2020-2032
12.3. Japan
12.3.1. Japan Mobile Money Market Revenue (USD Billion) and Forecast By Transaction Mode, 2020-2032
12.3.2. Japan Mobile Money Market Revenue (USD Billion) and Forecast By Nature Of Payment, 2020-2032
12.3.3. Japan Mobile Money Market Revenue (USD Billion) and Forecast By Type of Payments, 2020-2032
12.3.4. Japan Mobile Money Market Revenue (USD Billion) and Forecast By Application, 2020-2032
12.3.5. Japan Mobile Money Market Revenue (USD Billion) and Forecast By Industry Vertical, 2020-2032
12.4. India
12.4.1. India Mobile Money Market Revenue (USD Billion) and Forecast By Transaction Mode, 2020-2032
12.4.2. India Mobile Money Market Revenue (USD Billion) and Forecast By Nature Of Payment, 2020-2032
12.4.3. India Mobile Money Market Revenue (USD Billion) and Forecast By Type of Payments, 2020-2032
12.4.4. India Mobile Money Market Revenue (USD Billion) and Forecast By Application, 2020-2032
12.4.5. India Mobile Money Market Revenue (USD Billion) and Forecast By Industry Vertical, 2020-2032
12.5. Australia
12.5.1. Australia Mobile Money Market Revenue (USD Billion) and Forecast By Transaction Mode, 2020-2032
12.5.2. Australia Mobile Money Market Revenue (USD Billion) and Forecast By Nature Of Payment, 2020-2032
12.5.3. Australia Mobile Money Market Revenue (USD Billion) and Forecast By Type of Payments, 2020-2032
12.5.4. Australia Mobile Money Market Revenue (USD Billion) and Forecast By Application, 2020-2032
12.5.5. Australia Mobile Money Market Revenue (USD Billion) and Forecast By Industry Vertical, 2020-2032
12.6. South Korea
12.6.1. South Korea Mobile Money Market Revenue (USD Billion) and Forecast By Transaction Mode, 2020-2032
12.6.2. South Korea Mobile Money Market Revenue (USD Billion) and Forecast By Nature Of Payment, 2020-2032
12.6.3. South Korea Mobile Money Market Revenue (USD Billion) and Forecast By Type of Payments, 2020-2032
12.6.4. South Korea Mobile Money Market Revenue (USD Billion) and Forecast By Application, 2020-2032
12.6.5. South Korea Mobile Money Market Revenue (USD Billion) and Forecast By Industry Vertical, 2020-2032
12.7. Rest of Asia-Pacific
12.7.1. Rest of Asia-Pacific Mobile Money Market Revenue (USD Billion) and Forecast By Transaction Mode, 2020-2032
12.7.2. Rest of Asia-Pacific Mobile Money Market Revenue (USD Billion) and Forecast By Nature Of Payment, 2020-2032
12.7.3. Rest of Asia-Pacific Mobile Money Market Revenue (USD Billion) and Forecast By Type of Payments, 2020-2032
12.7.4. Rest of Asia-Pacific Mobile Money Market Revenue (USD Billion) and Forecast By Application, 2020-2032
12.7.5. Rest of Asia-Pacific Mobile Money Market Revenue (USD Billion) and Forecast By Industry Vertical, 2020-2032
12.8. Asia-Pacific PEST Analysis
CHAPTER 13. Latin America Mobile Money Market By Country
13.1. Latin America Mobile Money Market Overview
13.2. Brazil
13.2.1. Brazil Mobile Money Market Revenue (USD Billion) and Forecast By Transaction Mode, 2020-2032
13.2.2. Brazil Mobile Money Market Revenue (USD Billion) and Forecast By Nature Of Payment, 2020-2032
13.2.3. Brazil Mobile Money Market Revenue (USD Billion) and Forecast By Type of Payments, 2020-2032
13.2.4. Brazil Mobile Money Market Revenue (USD Billion) and Forecast By Application, 2020-2032
13.2.5. Brazil Mobile Money Market Revenue (USD Billion) and Forecast By Industry Vertical, 2020-2032
13.3. Mexico
13.3.1. Mexico Mobile Money Market Revenue (USD Billion) and Forecast By Transaction Mode, 2020-2032
13.3.2. Mexico Mobile Money Market Revenue (USD Billion) and Forecast By Nature Of Payment, 2020-2032
13.3.3. Mexico Mobile Money Market Revenue (USD Billion) and Forecast By Type of Payments, 2020-2032
13.3.4. Mexico Mobile Money Market Revenue (USD Billion) and Forecast By Application, 2020-2032
13.3.5. Mexico Mobile Money Market Revenue (USD Billion) and Forecast By Industry Vertical, 2020-2032
13.4. Rest of Latin America
13.4.1. Rest of Latin America Mobile Money Market Revenue (USD Billion) and Forecast By Transaction Mode, 2020-2032
13.4.2. Rest of Latin America Mobile Money Market Revenue (USD Billion) and Forecast By Nature Of Payment, 2020-2032
13.4.3. Rest of Latin America Mobile Money Market Revenue (USD Billion) and Forecast By Type of Payments, 2020-2032
13.4.4. Rest of Latin America Mobile Money Market Revenue (USD Billion) and Forecast By Application, 2020-2032
13.4.5. Rest of Latin America Mobile Money Market Revenue (USD Billion) and Forecast By Industry Vertical, 2020-2032
13.5. Latin America PEST Analysis
CHAPTER 14. Middle East & Africa Mobile Money Market By Country
14.1. Middle East & Africa Mobile Money Market Overview
14.2. GCC
14.2.1. GCC Mobile Money Market Revenue (USD Billion) and Forecast By Transaction Mode, 2020-2032
14.2.2. GCC Mobile Money Market Revenue (USD Billion) and Forecast By Nature Of Payment, 2020-2032
14.2.3. GCC Mobile Money Market Revenue (USD Billion) and Forecast By Type of Payments, 2020-2032
14.2.4. GCC Mobile Money Market Revenue (USD Billion) and Forecast By Application, 2020-2032
14.2.5. GCC Mobile Money Market Revenue (USD Billion) and Forecast By Industry Vertical, 2020-2032
14.3. South Africa
14.3.1. South Africa Mobile Money Market Revenue (USD Billion) and Forecast By Transaction Mode, 2020-2032
14.3.2. South Africa Mobile Money Market Revenue (USD Billion) and Forecast By Nature Of Payment, 2020-2032
14.3.3. South Africa Mobile Money Market Revenue (USD Billion) and Forecast By Type of Payments, 2020-2032
14.3.4. South Africa Mobile Money Market Revenue (USD Billion) and Forecast By Application, 2020-2032
14.3.5. South Africa Mobile Money Market Revenue (USD Billion) and Forecast By Industry Vertical, 2020-2032
14.4. Rest of Middle East & Africa
14.4.1. Rest of Middle East & Africa Mobile Money Market Revenue (USD Billion) and Forecast By Transaction Mode, 2020-2032
14.4.2. Rest of Middle East & Africa Mobile Money Market Revenue (USD Billion) and Forecast By Nature Of Payment, 2020-2032
14.4.3. Rest of Middle East & Africa Mobile Money Market Revenue (USD Billion) and Forecast By Type of Payments, 2020-2032
14.4.4. Rest of Middle East & Africa Mobile Money Market Revenue (USD Billion) and Forecast By Application, 2020-2032
14.4.5. Rest of Middle East & Africa Mobile Money Market Revenue (USD Billion) and Forecast By Industry Vertical, 2020-2032
14.5. Middle East & Africa PEST Analysis
CHAPTER 15. Player Analysis Of Mobile Money Market
15.1. Mobile Money Market Company Share Analysis
15.2. Competition Matrix
15.2.1. Competitive Benchmarking of key players by product, presence, market share, and R&D investment
15.2.2. New Product Launches and Product Enhancements
15.2.3. Mergers And Acquisition In Global Mobile Money Market
15.2.4. Partnership, Joint Ventures and Strategic Alliances/ Sales Agreements
CHAPTER 16. Company Profile
16.1. Bango.net Limited
16.1.1. Company Snapshot
16.1.2. Business Overview
16.1.3. Financial Overview
16.1.3.1. Revenue (USD Billion), 2022
16.1.3.2. Bango.net Limited 2022 Mobile Money Business Regional Distribution
16.1.4. Product /Service and Specification
16.1.5. Recent Developments & Business Strategy
16.2. Dwolla, Inc.
16.3. Google
16.4. Boku, Inc.
16.5. Judo Payments
16.6. Mastercard
16.7. Square, Inc.
16.8. Gemalto
16.9. Paypal, Inc.
16.10. PAYTM
16.11. VISA
16.12. WePay, Inc.