The Global Military Robots Market Size accounted for USD 17.1 Billion in 2021 and is estimated to garner a market size of USD 32.7 Billion by 2030 rising at a CAGR of 7.5% from 2022 to 2030. Increasing cases of lymphomas is the primary factors boosting the global military robots market value. In addition, the rising involvement of key players in the R&D leading to prominent pipeline of products is a major trend in the military robots market.
Military Robots Market Report Key Highlights
- Global military robots market revenue is estimated to reach USD 32.7 Billion by 2030 with a CAGR of 7.5% from 2022 to 2030
- North America military robots market accounted for over 35% regional shares in 2021
- According to the recent statistics, the number of robotic units sold in 2021 was 435,000
- Asia-Pacific military robots market will register fastest CAGR from 2022 to 2030
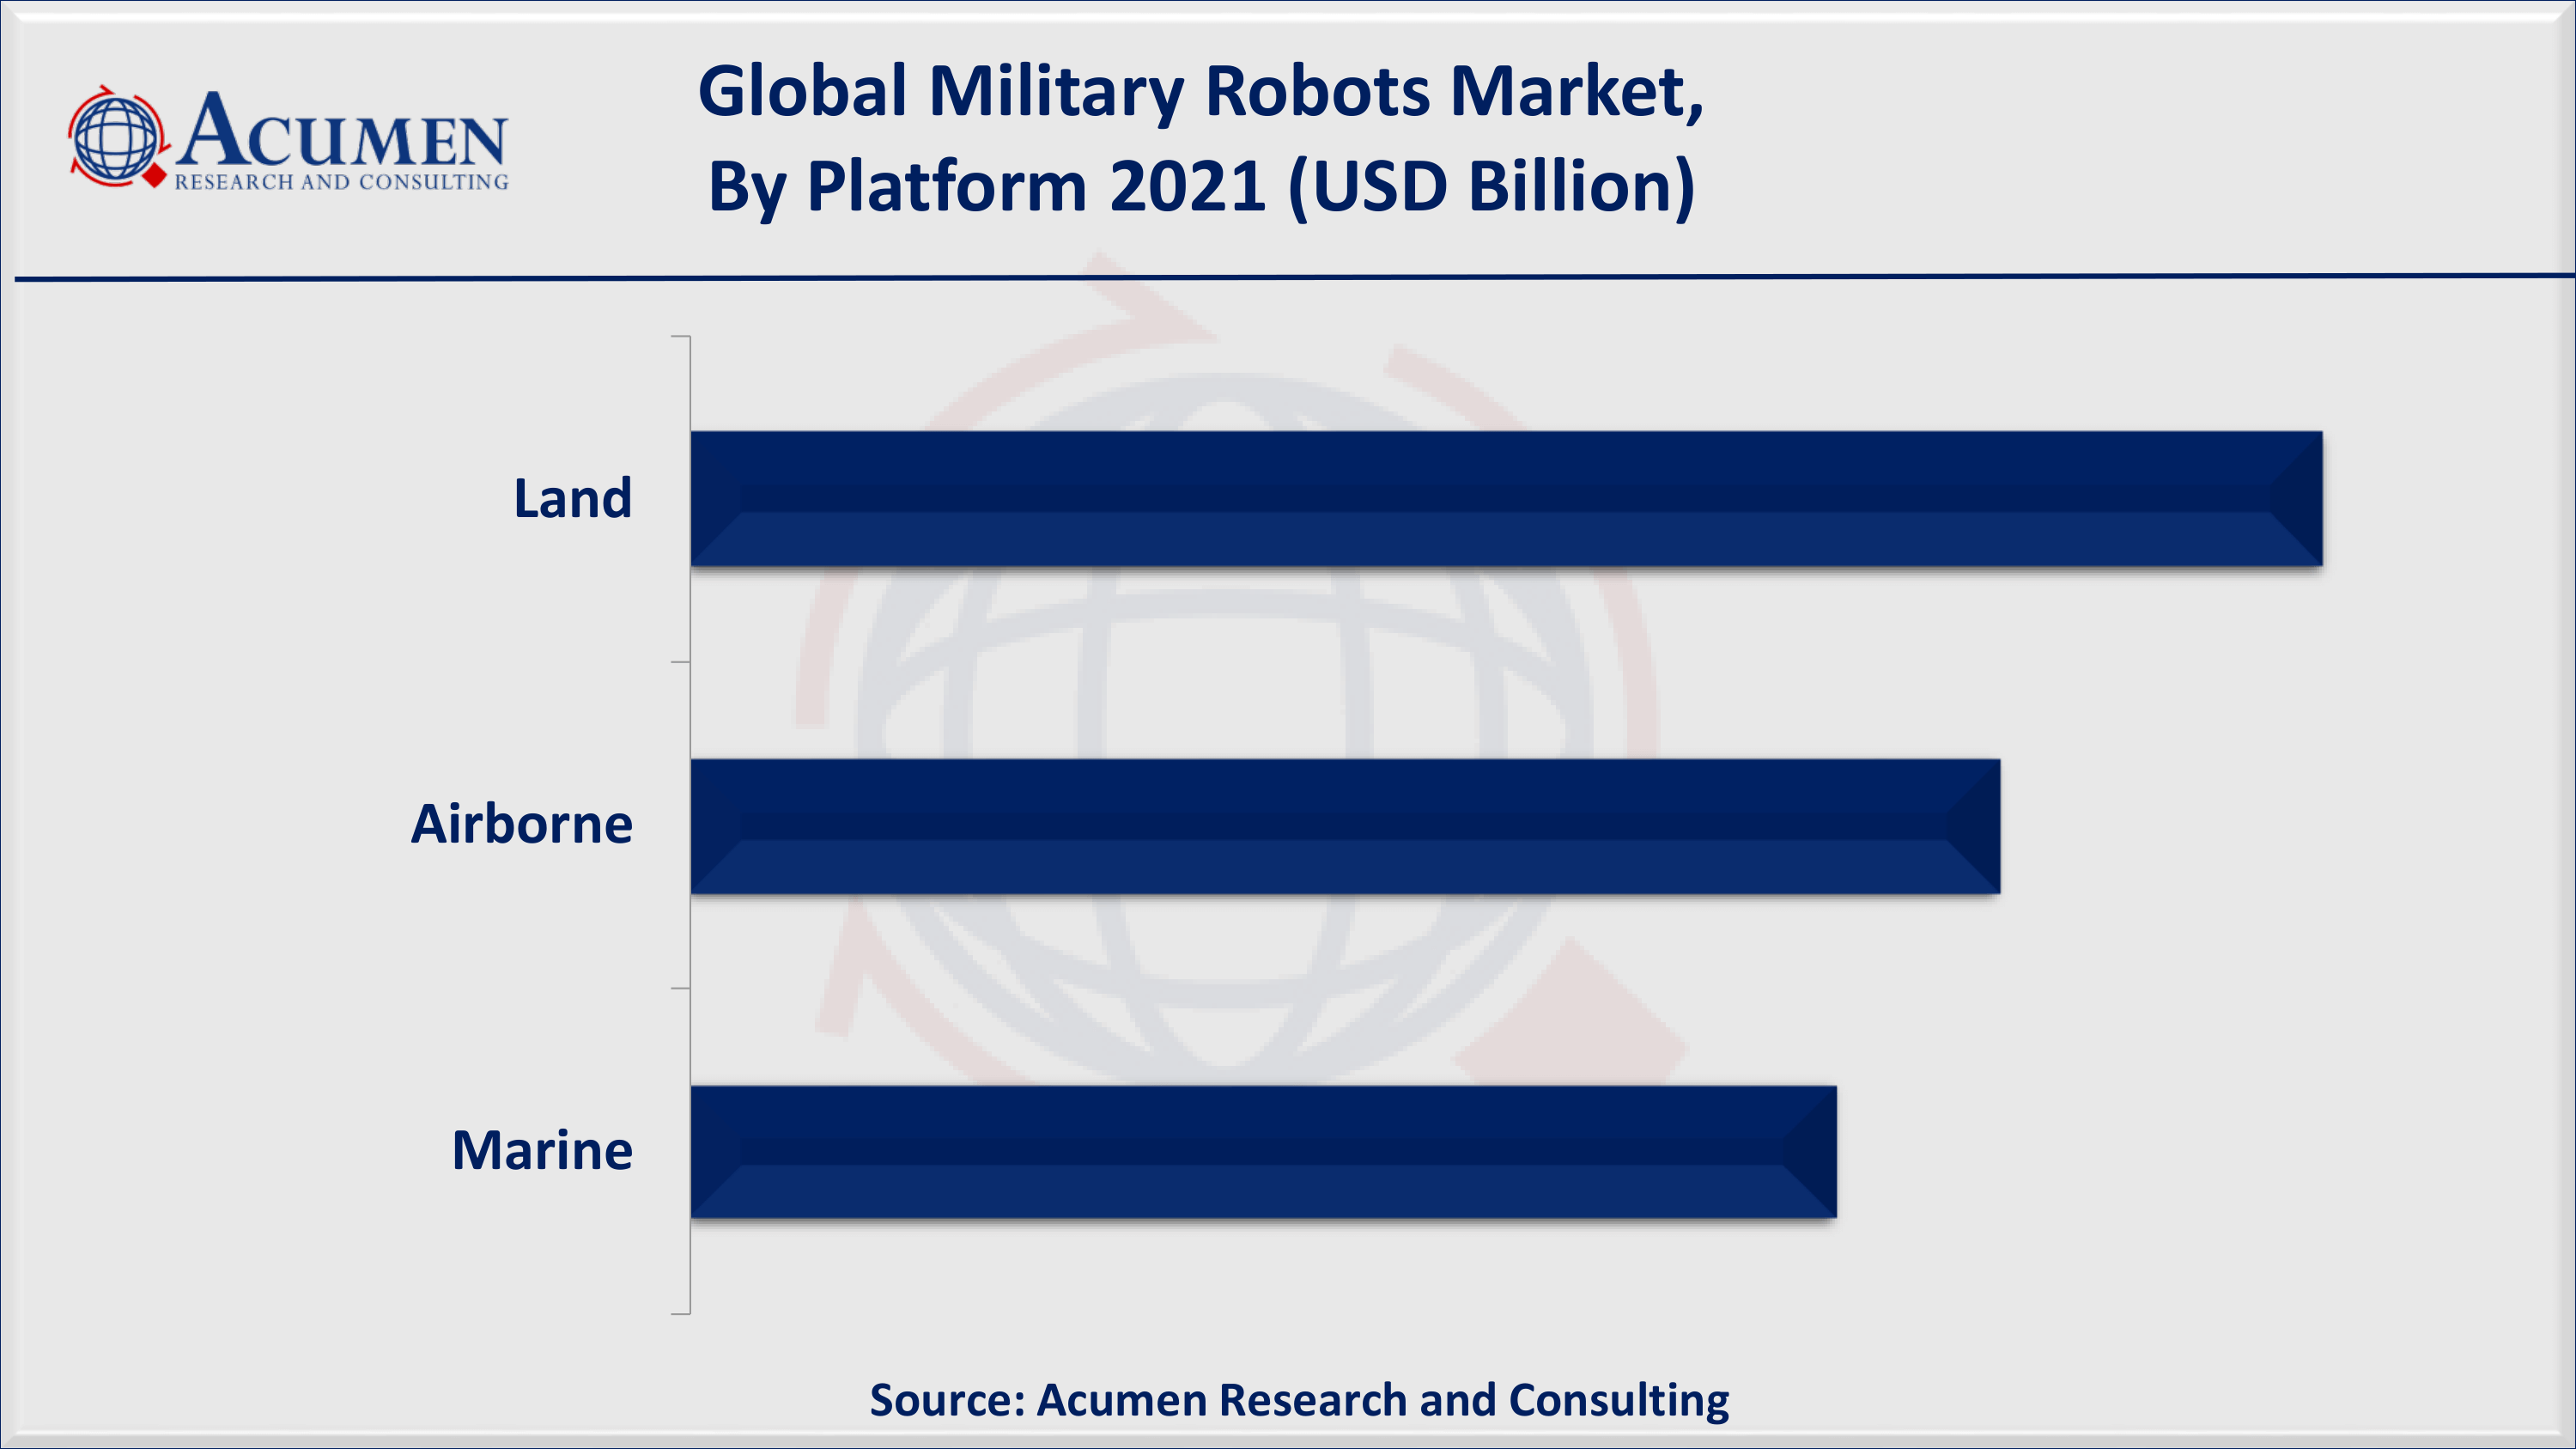
- Based on platform segment, land accounted 55% of the overall market share in 2021
- Growing military spending due to territorial conflicts propels the military robots market growth in coming years
- As per our military robots industry analysis, worldwide expenditure on military robotics will be USD 16.5 billion in 2025
Military robots are particularly designed for use in military applications; from transport to search & rescue and attack. Some of the systems are already in use, whereas many are under the research and development phase. These robots are usually employed within integrated systems that include video screens, sensors, grippers, and cameras. These are designed in different shapes and sizes as per the purpose. Military robots are designed with the purpose to monitor, destroy property, and killing people.
Global Military Robots Market Dynamics
Market Drivers
- Increasing demand for autonomous systems in the defense sector
- Rising use of robots in areas affected by CBRN attacks
- Growing adoption of UGVs for counter-insurgency operations
Market Restraints
- Lack of advanced visual capabilities in UGVs
- Lack of skilled & trained personnel to operate robots
Market Opportunities
- Development of fully autonomous UGVs and UAVs
- Growing defense budgets of major economies
Military Robots Market Report Coverage
Market |
Military Robots Market |
Military Robots Market Size 2021 |
USD 17.1 Billion |
Military Robots Market Forecast 2030 |
USD 32.7 Billion |
Military Robots Market CAGR During 2022 - 2030 |
7.5% |
Military Robots Market Analysis Period |
2018 - 2030 |
Military Robots Market Base Year |
2021 |
Military Robots Market Forecast Data |
2022 - 2030 |
Segments Covered |
By Platform, By Mode of Operation, By Propulsion, By Application, And By Geography
|
Regional Scope |
North America, Europe, Asia Pacific, Latin America, and Middle East & Africa |
Key Companies Profiled |
AeroVironment Inc., BAE Systems PLC, Cobham PLC, Elbit Systems Ltd, FLIR Systems Inc., General Dynamics Corporation, Israel Aerospace Industries Ltd, Lockheed Martin Corporation, Northrop Grumman Corporation, QinetiQ Group PLC, Saab AB, and Thales Group. |
Report Coverage
|
Market Trends, Drivers, Restraints, Competitive Analysis, Player Profiling, Regulation Analysis |
Market Dynamics
The increasing defense spending due to territorial conflicts between countries, subsequently increasing warfare at country borders are driving the market growth. The increasing deployment of robots for dangerous and hazardous missions in order to decrease human casualties is another factor boosting the demand for military robots across the countries. The rapid growth in the procurement of military robots for targeting, advanced monitoring, and common Interrupt Service Routine (ISR) functions among others is further boosting the market value. The increasing investment by the major countries in the development of advanced robot soldiers and AI-based unmanned ground, sea, and airborne vehicles are further expected to drive growth over the estimated period from 2022 to 2030.
On the other hand, high operational costs of autonomous underwater vehicle (AUVs) and low reliability of unmanned underwater vehicles (UUVs) is likely to restrict the growth over the forecast period from 2022 to 2030.
Military Robots Market Segmentation
The worldwide military robots market is split based on platform, mode of operation, propulsion, application, and geography.
Military Robots Market By Platform
According to our military robots industry analysis, land military robots accounted for over 55% of the total market share in 2021 and are likely to do so in the coming years. In 2021, airborne-based military robots also dominated the market with a significant revenue share (%). The availability of airborne robots includes small UAVs, tactical UAVs, strategic UAVs, and unmanned combat aerial vehicles (UCAVs). These are used for intelligence, surveillance, and reconnaissance (ISR), search and rescue, and to combat support. Additionally, these robots are designed with the installment of payloads, sensors, navigation systems, communication systems, propulsion systems, and power systems among others.
Military Robots Market By Mode of Operation
- Human Operated
- Fully Autonomous
- Semi-Autonomous
Based on the mode of operations segment, it is anticipated that human operated will be dominant and hold a sizable market share in the forecast period. Our military robots market forecast predicts that due to the development of robotics technology, autonomous mode of operation will experience significant growth in the upcoming years.
Military Robots Market By Propulsion
- Electric
- Hybrid
- Mechanical
In 2021, mechanical robots would generate a significant industry share in the military bots market. These robots are commonly used for long-range ground-based operations and are known as command control robots. Engines, thrusters, and other transmissions propel these robots. These robots navigate and communicate using a global positioning system (GPS) and 3G technology. On the other hand, electric propulsion sub-segment is anticipated to record the fastest growth rate in the comign years.
Military Robots Market By Application
- Combat Support
- Explosive Ordnance Disposal (EOD)
- Firefighting
- Intelligence, Surveillance, and Reconnaissance (ISR)
- Mine Clearance
- Search & Rescue
- Transportation
- Others
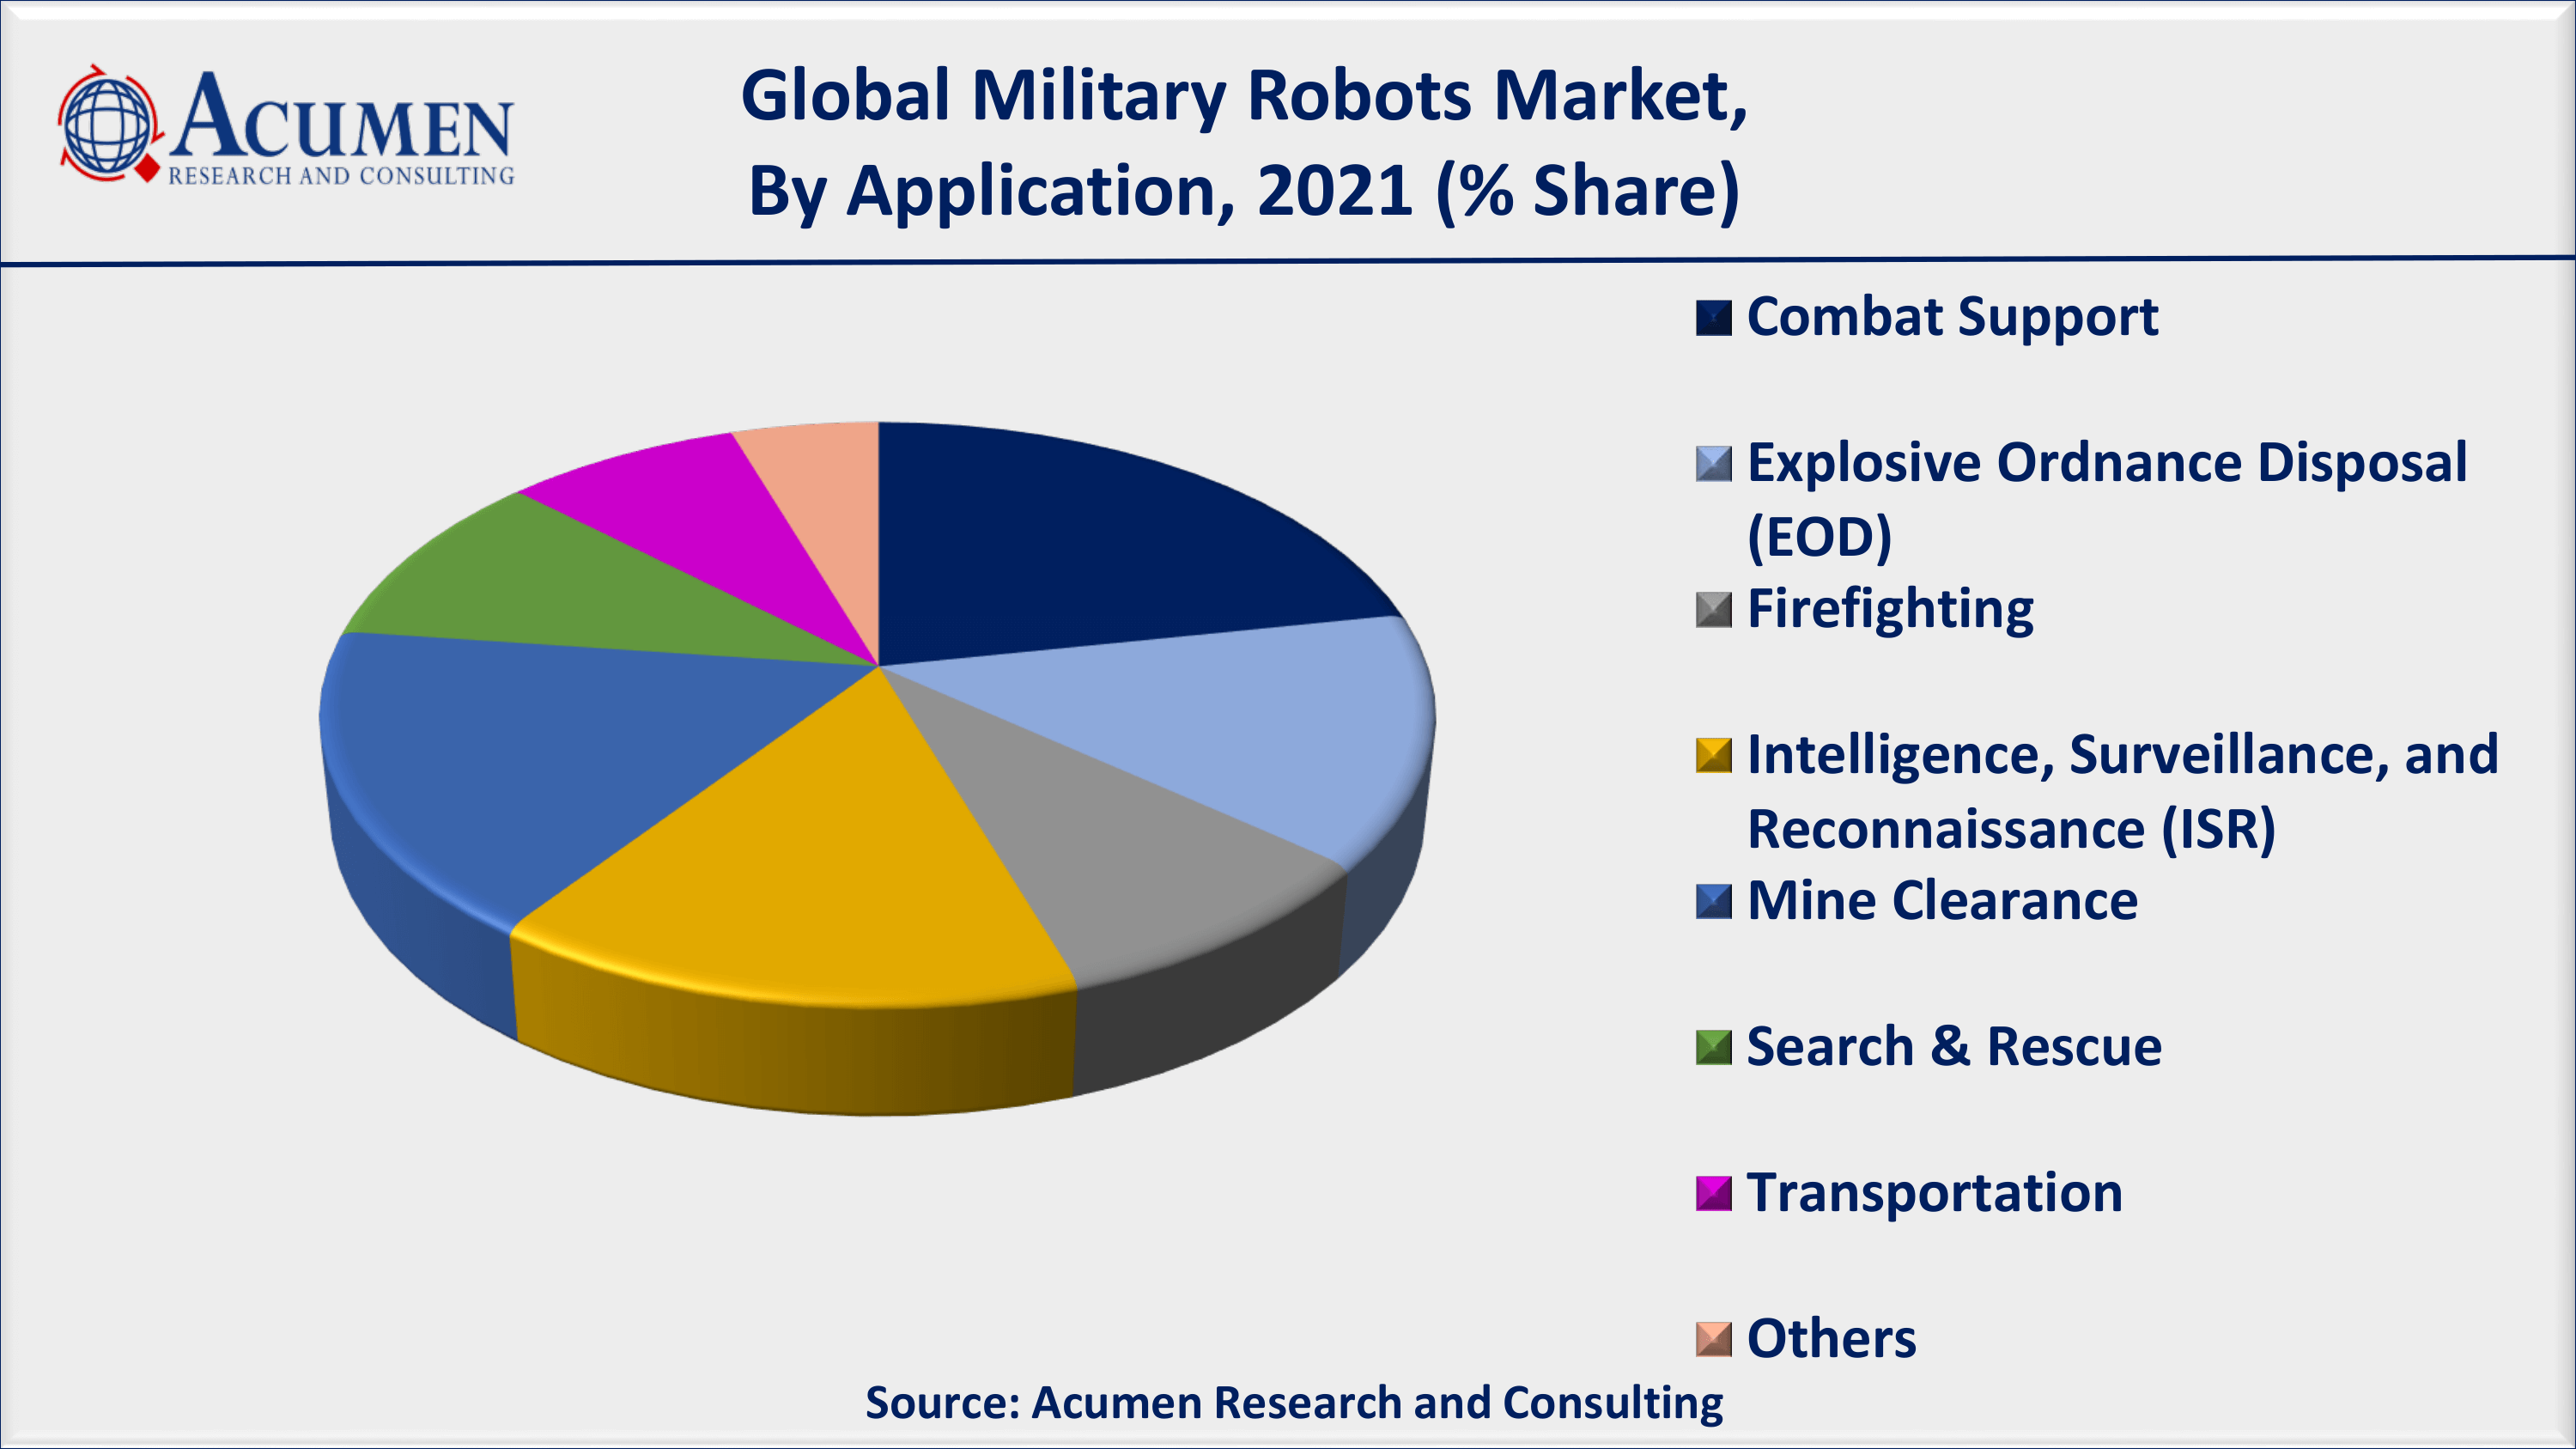
Based on application segment, combat support is expected to lead the market with majority of the share during the forecast period 2022 to 2030. Robotics technology for military applications is not new; it has long been utilized by armed forces across the world. Military robots can perform a wide range of combat tasks, including lethal combat operations, explosive disarmament, fire support, rescue, reconnaissance, logistics support, and more.
Military Robots Market Regional Outlook
North America
Europe
- U.K.
- Germany
- France
- Spain
- Rest of Europe
Latin America
- Mexico
- Brazil
- Rest of Latin America
Asia-Pacific
- India
- Japan
- China
- Australia
- South Korea
- Rest of Asia-Pacific
The Middle East & Africa (MEA)
- Gulf Cooperation Council (GCC)
- South Africa
- Rest of the Middle East & Africa
North America held the major share in the Military Robots Market of 2021
North America, along with its major economy (the US), is dominating the military robots market with maximum revenue share (%). The increasing investment in research and development activities in order to develop more advanced robots that can beat the limitations of existing ones is supporting the regional market value. The US military and law enforcement agencies are using these robots in various applications, including search and rescue operations, border security, crowd monitoring and control, and surveillance among others. The early adoption of advanced systems in the region is further supporting the regional market value. For instance, the US Mechatronics has developed a working automated sentry gun and is further developing its usage for commercial and military use.
Asia Pacific is anticipated to exhibit fastest growth over the forecast period
The prominent economies of Asia Pacific including China and India are majorly contributing to the fastest growth of the region. The increasing military and defense budget in the aforementioned countries is additionally supporting the regional market value. China's People's Liberation Army (PLA) has released footage of new and high-tech weapons & equipment in 2020 that notably include robot-Esque exoskeleton suit. The Chinese PLA has also inducted tiny missile-loading ground robots in 2020 that are armed with a machine gun, which can overcome the problem of human assistance when loading missiles.
Military Robots Market Players
The global military robots companies profiled in the report include AeroVironment Inc., BAE Systems PLC, Cobham PLC, Elbit Systems Ltd, FLIR Systems Inc., General Dynamics Corporation, Israel Aerospace Industries Ltd, Lockheed Martin Corporation, Northrop Grumman Corporation, QinetiQ Group PLC, Saab AB, and Thales Group.
CHAPTER 1. Industry Overview of Military Robots Market
1.1. Definition and Scope
1.1.1. Definition of Military Robots
1.1.2. Market Segmentation
1.1.3. Years Considered for the Study
1.1.4. Assumptions and Acronyms Used
1.1.4.1. Market Assumptions and Market Forecast
1.1.4.2. Acronyms Used in Global Military Robots Market
1.2. Summary
1.2.1. Executive Summary
1.2.2. Military Robots Market By Platform
1.2.3. Military Robots Market By Mode of Operation
1.2.4. Military Robots Market By Propulsion
1.2.5. Military Robots Market By Application
1.2.6. Military Robots Market By Region
CHAPTER 2. Research Approach
2.1. Methodology
2.1.1. Research Programs
2.1.2. Market Size Estimation
2.1.3. Market Breakdown and Data Triangulation
2.2. Data Source
2.2.1. Secondary Sources
2.2.2. Primary Sources
CHAPTER 3. Market Dynamics And Competition Analysis
3.1. Market Drivers
3.1.1. Driver 1
3.1.2. Driver 2
3.2. Restraints and Challenges
3.2.1. Restraint 1
3.2.2. Restraint 2
3.3. Growth Opportunities
3.3.1. Opportunity 1
3.3.2. Opportunity 2
3.4. Porter’s Five Forces Analysis
3.4.1. Bargaining Power of Suppliers
3.4.2. Bargaining Power of Buyers
3.4.3. Threat of Substitute
3.4.4. Threat of New Entrants
3.4.5. Degree of Competition
3.5. Market Concentration Ratio and Market Maturity Analysis of Military Robots Market
3.5.1. Go To Market Strategy
3.5.1.1. Introduction
3.5.1.2. Growth
3.5.1.3. Maturity
3.5.1.4. Saturation
3.5.1.5. Possible Development
3.6. Technological Roadmap for Military Robots Market
3.7. Value Chain Analysis
3.7.1. List of Key Manufacturers
3.7.2. List of Customers
3.7.3. Level of Integration
3.8. Cost Structure Analysis
3.8.1. Price Trend of Key Raw Materials
3.8.2. Raw Material Suppliers
3.8.3. Proportion of Manufacturing Cost Structure
3.8.3.1. Raw Material
3.8.3.2. Labor Cost
3.8.3.3. Manufacturing Expense
3.9. Regulatory Compliance
3.10. Competitive Landscape, 2021
3.10.1. Player Positioning Analysis
3.10.2. Key Strategies Adopted By Leading Players
CHAPTER 4. Manufacturing Plant Analysis
4.1. Manufacturing Plant Location and Establish Date of Major Manufacturers in 2021
4.2. R&D Status of Major Manufacturers in 2021
CHAPTER 5. Military Robots Market By Platform
5.1. Introduction
5.2. Military Robots Revenue By Platform
5.2.1. Military Robots Revenue (USD Billion) and Forecast, By Platform, 2018-2030
5.2.2. Marine
5.2.2.1. Marine Market Revenue (USD Billion) and Growth Rate (%), 2018-2030
5.2.3. Land
5.2.3.1. Land Market Revenue (USD Billion) and Growth Rate (%), 2018-2030
5.2.4. Airborne
5.2.4.1. Airborne Market Revenue (USD Billion) and Growth Rate (%), 2018-2030
CHAPTER 6. Military Robots Market By Mode of Operation
6.1. Introduction
6.2. Military Robots Revenue By Mode of Operation
6.2.1. Military Robots Revenue (USD Billion) and Forecast, By Mode of Operation, 2018-2030
6.2.2. Human Operated
6.2.2.1. Human Operated Market Revenue (USD Billion) and Growth Rate (%), 2018-2030
6.2.3. Fully Autonomous
6.2.3.1. Fully Autonomous Market Revenue (USD Billion) and Growth Rate (%), 2018-2030
6.2.4. Semi-Autonomous
6.2.4.1. Semi-Autonomous Market Revenue (USD Billion) and Growth Rate (%), 2018-2030
CHAPTER 7. Military Robots Market By Propulsion
7.1. Introduction
7.2. Military Robots Revenue By Propulsion
7.2.1. Military Robots Revenue (USD Billion) and Forecast, By Propulsion, 2018-2030
7.2.2. Electric
7.2.2.1. Electric Market Revenue (USD Billion) and Growth Rate (%), 2018-2030
7.2.3. Mechanical
7.2.3.1. Mechanical Market Revenue (USD Billion) and Growth Rate (%), 2018-2030
7.2.4. Hybrid
7.2.4.1. Hybrid Market Revenue (USD Billion) and Growth Rate (%), 2018-2030
CHAPTER 8. Military Robots Market By Application
8.1. Introduction
8.2. Military Robots Revenue By Application
8.2.1. Military Robots Revenue (USD Billion) and Forecast, By Application, 2018-2030
8.2.2. Search & Rescue
8.2.2.1. Search & Rescue Market Revenue (USD Billion) and Growth Rate (%), 2018-2030
8.2.3. Firefighting
8.2.3.1. Firefighting Market Revenue (USD Billion) and Growth Rate (%), 2018-2030
8.2.4. Explosive Ordnance Disposal (EOD)
8.2.4.1. Explosive Ordnance Disposal (EOD) Market Revenue (USD Billion) and Growth Rate (%), 2018-2030
8.2.5. Intelligence, Surveillance, and Reconnaissance (ISR)
8.2.5.1. Intelligence, Surveillance, and Reconnaissance (ISR) Market Revenue (USD Billion) and Growth Rate (%), 2018-2030
8.2.6. Mine Clearance
8.2.6.1. Mine Clearance Market Revenue (USD Billion) and Growth Rate (%), 2018-2030
8.2.7. Transportation
8.2.7.1. Transportation Market Revenue (USD Billion) and Growth Rate (%), 2018-2030
8.2.8. Combat Support
8.2.8.1. Combat Support Market Revenue (USD Billion) and Growth Rate (%), 2018-2030
8.2.9. Others
8.2.9.1. Others Market Revenue (USD Billion) and Growth Rate (%), 2018-2030
CHAPTER 9. North America Military Robots Market By Country
9.1. North America Military Robots Market Overview
9.2. U.S.
9.2.1. U.S. Military Robots Revenue (USD Billion) and Forecast By Platform, 2018-2030
9.2.2. U.S. Military Robots Revenue (USD Billion) and Forecast By Mode of Operation, 2018-2030
9.2.3. U.S. Military Robots Revenue (USD Billion) and Forecast By Propulsion, 2018-2030
9.2.4. U.S. Military Robots Revenue (USD Billion) and Forecast By Application, 2018-2030
9.3. Canada
9.3.1. Canada Military Robots Revenue (USD Billion) and Forecast By Platform, 2018-2030
9.3.2. Canada Military Robots Revenue (USD Billion) and Forecast By Mode of Operation, 2018-2030
9.3.3. Canada Military Robots Revenue (USD Billion) and Forecast By Propulsion, 2018-2030
9.3.4. Canada Military Robots Revenue (USD Billion) and Forecast By Application, 2018-2030
9.4. North America PEST Analysis
CHAPTER 10. Europe Military Robots Market By Country
10.1. Europe Military Robots Market Overview
10.2. U.K.
10.2.1. U.K. Military Robots Revenue (USD Billion) and Forecast By Platform, 2018-2030
10.2.2. U.K. Military Robots Revenue (USD Billion) and Forecast By Mode of Operation, 2018-2030
10.2.3. U.K. Military Robots Revenue (USD Billion) and Forecast By Propulsion, 2018-2030
10.2.4. U.K. Military Robots Revenue (USD Billion) and Forecast By Application, 2018-2030
10.3. Germany
10.3.1. Germany Military Robots Revenue (USD Billion) and Forecast By Platform, 2018-2030
10.3.2. Germany Military Robots Revenue (USD Billion) and Forecast By Mode of Operation, 2018-2030
10.3.3. Germany Military Robots Revenue (USD Billion) and Forecast By Propulsion, 2018-2030
10.3.4. Germany Military Robots Revenue (USD Billion) and Forecast By Application, 2018-2030
10.4. France
10.4.1. France Military Robots Revenue (USD Billion) and Forecast By Platform, 2018-2030
10.4.2. France Military Robots Revenue (USD Billion) and Forecast By Mode of Operation, 2018-2030
10.4.3. France Military Robots Revenue (USD Billion) and Forecast By Propulsion, 2018-2030
10.4.4. France Military Robots Revenue (USD Billion) and Forecast By Application, 2018-2030
10.5. Spain
10.5.1. Spain Military Robots Revenue (USD Billion) and Forecast By Platform, 2018-2030
10.5.2. Spain Military Robots Revenue (USD Billion) and Forecast By Mode of Operation, 2018-2030
10.5.3. Spain Military Robots Revenue (USD Billion) and Forecast By Propulsion, 2018-2030
10.5.4. Spain Military Robots Revenue (USD Billion) and Forecast By Application, 2018-2030
10.6. Rest of Europe
10.6.1. Rest of Europe Military Robots Revenue (USD Billion) and Forecast By Platform, 2018-2030
10.6.2. Rest of Europe Military Robots Revenue (USD Billion) and Forecast By Mode of Operation, 2018-2030
10.6.3. Rest of Europe Military Robots Revenue (USD Billion) and Forecast By Propulsion, 2018-2030
10.6.4. Rest of Europe Military Robots Revenue (USD Billion) and Forecast By Application, 2018-2030
10.7. Europe PEST Analysis
CHAPTER 11. Asia Pacific Military Robots Market By Country
11.1. Asia Pacific Military Robots Market Overview
11.2. China
11.2.1. China Military Robots Revenue (USD Billion) and Forecast By Platform, 2018-2030
11.2.2. China Military Robots Revenue (USD Billion) and Forecast By Mode of Operation, 2018-2030
11.2.3. China Military Robots Revenue (USD Billion) and Forecast By Propulsion, 2018-2030
11.2.4. China Military Robots Revenue (USD Billion) and Forecast By Application, 2018-2030
11.3. Japan
11.3.1. Japan Military Robots Revenue (USD Billion) and Forecast By Platform, 2018-2030
11.3.2. Japan Military Robots Revenue (USD Billion) and Forecast By Mode of Operation, 2018-2030
11.3.3. Japan Military Robots Revenue (USD Billion) and Forecast By Propulsion, 2018-2030
11.3.4. Japan Military Robots Revenue (USD Billion) and Forecast By Application, 2018-2030
11.4. India
11.4.1. India Military Robots Revenue (USD Billion) and Forecast By Platform, 2018-2030
11.4.2. India Military Robots Revenue (USD Billion) and Forecast By Mode of Operation, 2018-2030
11.4.3. India Military Robots Revenue (USD Billion) and Forecast By Propulsion, 2018-2030
11.4.4. India Military Robots Revenue (USD Billion) and Forecast By Application, 2018-2030
11.5. Australia
11.5.1. Australia Military Robots Revenue (USD Billion) and Forecast By Platform, 2018-2030
11.5.2. Australia Military Robots Revenue (USD Billion) and Forecast By Mode of Operation, 2018-2030
11.5.3. Australia Military Robots Revenue (USD Billion) and Forecast By Propulsion, 2018-2030
11.5.4. Australia Military Robots Revenue (USD Billion) and Forecast By Application, 2018-2030
11.6. South Korea
11.6.1. South Korea Military Robots Revenue (USD Billion) and Forecast By Platform, 2018-2030
11.6.2. South Korea Military Robots Revenue (USD Billion) and Forecast By Mode of Operation, 2018-2030
11.6.3. South Korea Military Robots Revenue (USD Billion) and Forecast By Propulsion, 2018-2030
11.6.4. South Korea Military Robots Revenue (USD Billion) and Forecast By Application, 2018-2030
11.7. Rest of Asia-Pacific
11.7.1. Rest of Asia-Pacific Military Robots Revenue (USD Billion) and Forecast By Platform, 2018-2030
11.7.2. Rest of Asia-Pacific Military Robots Revenue (USD Billion) and Forecast By Mode of Operation, 2018-2030
11.7.3. Rest of Asia-Pacific Military Robots Revenue (USD Billion) and Forecast By Propulsion, 2018-2030
11.7.4. Rest of Asia-Pacific Military Robots Revenue (USD Billion) and Forecast By Application, 2018-2030
11.8. Asia Pacific PEST Analysis
CHAPTER 12. Latin America Military Robots Market By Country
12.1. Latin America Military Robots Market Overview
12.2. Brazil
12.2.1. Brazil Military Robots Revenue (USD Billion) and Forecast By Platform, 2018-2030
12.2.2. Brazil Military Robots Revenue (USD Billion) and Forecast By Mode of Operation, 2018-2030
12.2.3. Brazil Military Robots Revenue (USD Billion) and Forecast By Propulsion, 2018-2030
12.2.4. Brazil Military Robots Revenue (USD Billion) and Forecast By Application, 2018-2030
12.3. Mexico
12.3.1. Mexico Military Robots Revenue (USD Billion) and Forecast By Platform, 2018-2030
12.3.2. Mexico Military Robots Revenue (USD Billion) and Forecast By Mode of Operation, 2018-2030
12.3.3. Mexico Military Robots Revenue (USD Billion) and Forecast By Propulsion, 2018-2030
12.3.4. Mexico Military Robots Revenue (USD Billion) and Forecast By Application, 2018-2030
12.4. Rest of Latin America
12.4.1. Rest of Latin America Military Robots Revenue (USD Billion) and Forecast By Platform, 2018-2030
12.4.2. Rest of Latin America Military Robots Revenue (USD Billion) and Forecast By Mode of Operation, 2018-2030
12.4.3. Rest of Latin America Military Robots Revenue (USD Billion) and Forecast By Propulsion, 2018-2030
12.4.4. Rest of Latin America Military Robots Revenue (USD Billion) and Forecast By Application, 2018-2030
12.5. Latin America PEST Analysis
CHAPTER 13. Middle East & Africa Military Robots Market By Country
13.1. Middle East & Africa Military Robots Market Overview
13.2. GCC
13.2.1. GCC Military Robots Revenue (USD Billion) and Forecast By Platform, 2018-2030
13.2.2. GCC Military Robots Revenue (USD Billion) and Forecast By Mode of Operation, 2018-2030
13.2.3. GCC Military Robots Revenue (USD Billion) and Forecast By Propulsion, 2018-2030
13.2.4. GCC Military Robots Revenue (USD Billion) and Forecast By Application, 2018-2030
13.3. South Africa
13.3.1. South Africa Military Robots Revenue (USD Billion) and Forecast By Platform, 2018-2030
13.3.2. South Africa Military Robots Revenue (USD Billion) and Forecast By Mode of Operation, 2018-2030
13.3.3. South Africa Military Robots Revenue (USD Billion) and Forecast By Propulsion, 2018-2030
13.3.4. South Africa Military Robots Revenue (USD Billion) and Forecast By Application, 2018-2030
13.4. Rest of Middle East & Africa
13.4.1. Rest of Middle East & Africa Military Robots Revenue (USD Billion) and Forecast By Platform, 2018-2030
13.4.2. Rest of Middle East & Africa Military Robots Revenue (USD Billion) and Forecast By Mode of Operation, 2018-2030
13.4.3. Rest of Middle East & Africa Military Robots Revenue (USD Billion) and Forecast By Propulsion, 2018-2030
13.4.4. Rest of Middle East & Africa Military Robots Revenue (USD Billion) and Forecast By Application, 2018-2030
13.5. Middle East & Africa PEST Analysis
CHAPTER 14. Player Analysis Of Military Robots Market
14.1. Military Robots Market Company Share Analysis
14.2. Competition Matrix
14.2.1. Competitive Benchmarking of key players by price, presence, market share, and R&D investment
14.2.2. New Product Launches and Product Enhancements
14.2.3. Mergers And Acquisition In Global Military Robots Market
14.2.4. Partnership, Joint Ventures and Strategic Alliances/ Sales Agreements
CHAPTER 15. Company Profile
15.1. AeroVironment Inc.
15.1.1. Company Snapshot
15.1.2. Business Overview
15.1.3. Financial Overview
15.1.3.1. Revenue (USD Billion), 2021
15.1.3.2. AeroVironment Inc. 2021 Military Robots Business Regional Distribution
15.1.4. Product /Service and Specification
15.1.5. Recent Developments & Business Strategy
15.2. BAE Systems PLC
15.3. Cobham PLC
15.4. Elbit Systems Ltd
15.5. FLIR Systems Inc.
15.6. General Dynamics Corporation
15.7. Israel Aerospace Industries Ltd
15.8. Lockheed Martin Corporation
15.9. Northrop Grumman Corporation
15.10. QinetiQ Group PLC
15.11. Saab AB
15.12. Thales Group