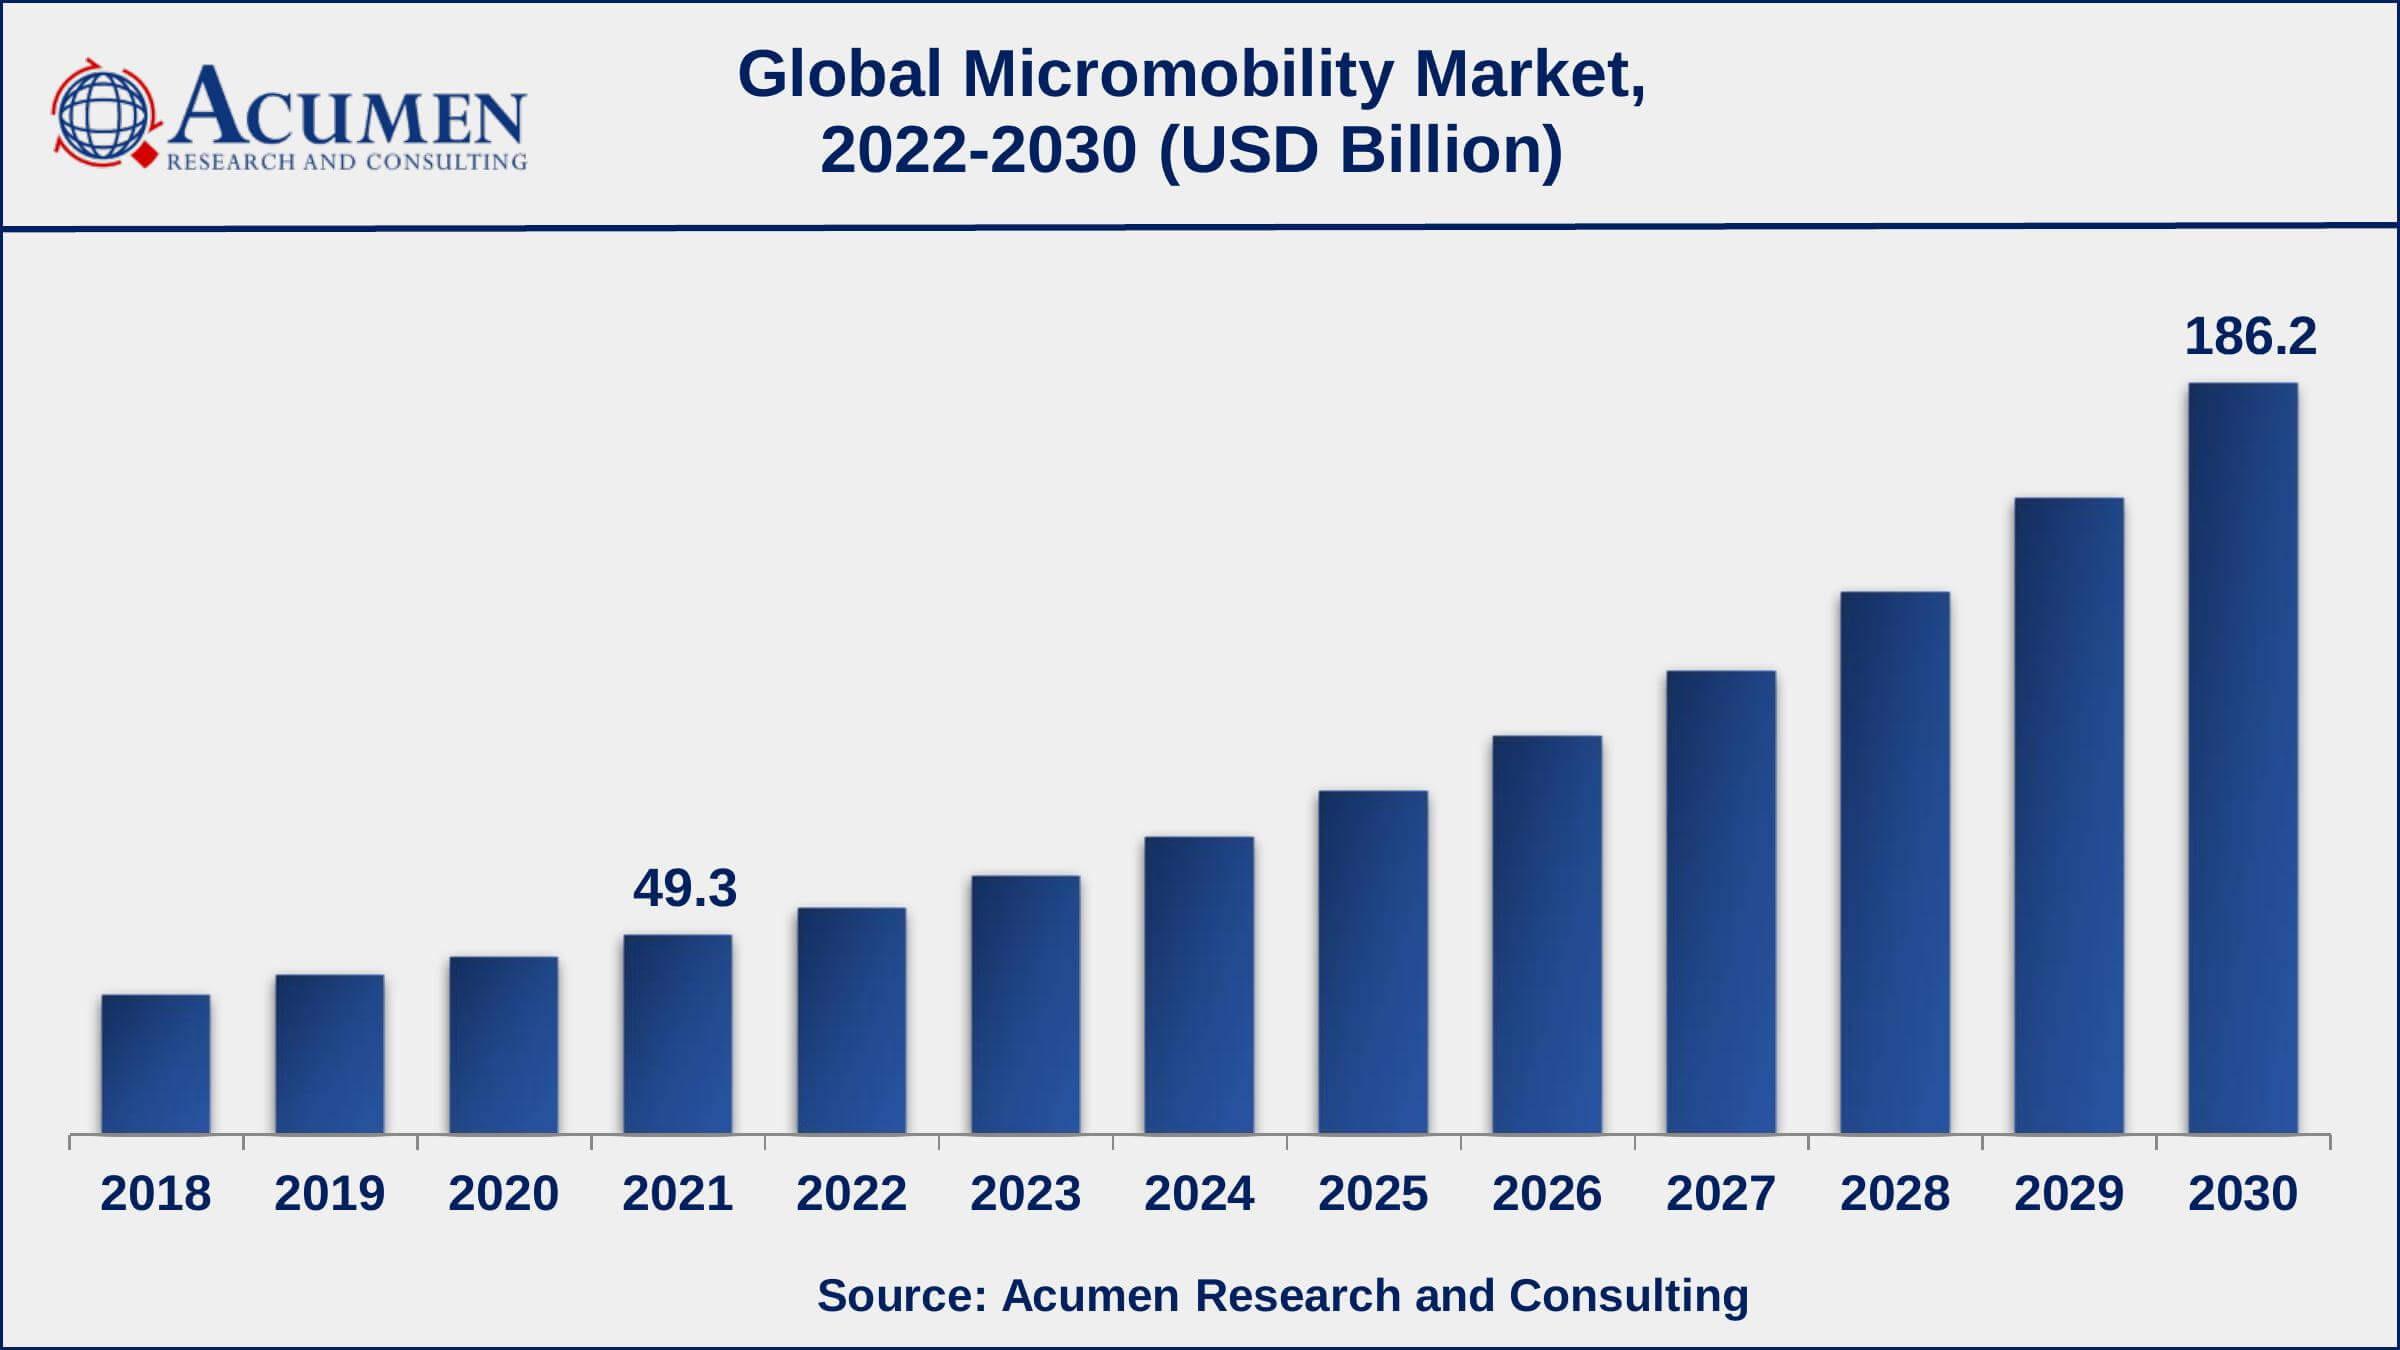
The Global Micromobility Market Size gathered USD 49.3 Billion in 2021 and is set to garner a market size of USD 186.2 Billion by 2030 growing at a CAGR of 16.2% from 2022 to 2030.
Micromobility refers to small, lightweight, and easily maneuverable vehicles designed for short trips in urban areas, such as electric scooters, bikes, and hoverboards. Micro-mobility vehicles are designed for short trips and provide urban commuters with a convenient, quick, and cost-effective mode of transportation. These vehicles run on electricity, which makes them more environmentally friendly and reduces carbon emissions when compared to traditional gas-powered vehicles. More people choosing micro-mobility vehicles can help reduce traffic congestion in urban areas while also improving overall mobility. They can improve access to transportation for people who live in cities but do not have a car, such as the elderly, low-income households, and disabled people. Furthermore, micro-mobility vehicles can aid in the development of smart cities by providing an efficient and sustainable transportation solution that can aid in the reduction of urban congestion, the improvement of air quality, and the promotion of a cleaner and healthier environment.
Micromobility Market Report Statistics
- Global micromobility market revenue is estimated to reach USD 186.2 Billion by 2030 with a CAGR of 16.2% from 2022 to 2030
- Asia-Pacific micromobility market value gathered more than USD 22.2 Billion in 2021
- North America micromobility market growth will record a CAGR of more than 16% from 2022 to 2030
- Among propulsion type, the electrically powered sub-segment collected a 56% share in 2021
- Based on vehicle type, the bicycles sub-segment achieved US$ 20.7 billion in revenue in 2021
- The increased focus on sustainability is a popular micromobility market trend that drives the industry demand
Global Micromobility Market Dynamics
Market Drivers
- Rapid urbanization
- Increased environmental concerns
- Favorable government support
- Development of new technologies
Market Restraints
- Regulation and legal challenges
- Infrastructure challenges
- Limited range and battery life
Market Opportunities
- Expansion into new geographies
- Integration with public transportation
- Rising demand for last-mile transportation
Micromobility Market Report Coverage
Market |
Micromobility Market |
Micromobility Market Size 2021 |
USD 49.3 Billion |
Micromobility Market Forecast 2030 |
USD 186.2 Billion |
Micromobility Market CAGR During 2022 - 2030 |
16.2% |
Micromobility Market Analysis Period |
2018 - 2030 |
Micromobility Market Base Year |
2021 |
Micromobility Market Forecast Data |
2022 - 2030 |
Segments Covered |
By Propulsion type, By Vehicle Type, By Sharing Type, By Age Group, And By Geography
|
Regional Scope |
North America, Europe, Asia Pacific, Latin America, and Middle East & Africa |
Key Companies Profiled |
Beijing Mobike Technology Co. Ltd, Bird Rides Inc., Boosted USA, DoorDash, Dynamic Bicycles, Easymile SAS, GoBike, GoJek, Lime, Micro Mobility Systems, Scoot Network, SEGWAY INC., Skip Transportation, and SWAGTRON.
|
Report Coverage
|
Market Trends, Drivers, Restraints, Competitive Analysis, Player Profiling, Covid-19 Analysis, Regulation Analysis |
Micromobility Market Growth Factors
Increasing urbanization is a key factor that is driving the global micro-mobility market value. As cities continue to grow, there is an increased need for convenient, quick, and eco-friendly modes of transportation, leading to growth in the micro-mobility market. Environmental concerns are another factor that is boosting the micro-mobility industry. The increasing awareness about the impact of traditional modes of transportation on the environment is leading to a shift towards sustainable and eco-friendly modes of transportation, such as electric scooters and bikes. Governments in many countries are providing incentives and support for the adoption of micro-mobility vehicles, contributing to market growth.
Regulation and legal challenges are one of the restraining factors in the market. Different countries have different regulations and legal challenges related to the use of micro-mobility vehicles, which can limit their adoption and growth. In addition, many cities lack adequate infrastructure, such as bike lanes and charging stations, to support the widespread use of micro-mobility vehicles, which can hinder market growth. Besides that, there are safety concerns associated with the use of micro-mobility vehicles, such as accidents and injuries, which also restrict their adoption and growth.
Furthermore, advancements in technology, such as the development of lightweight and durable materials, have made micro-mobility vehicles more accessible and affordable, leading to an increase in demand. Finally, micro-mobility vehicles offer improved access to transportation for people who live in urban areas but don't have access to a car, such as the elderly, low-income households, and disabled individuals. This factor is expected to generate numerous growth opportunities for the market in the coming years.
Micromobility Market Segmentation
The worldwide micromobility market is categorized based on propulsion type, vehicle type, sharing type, age group, and geography.
Micromobility Market By Propulsion type
- Electrically Powered
- Human Powered
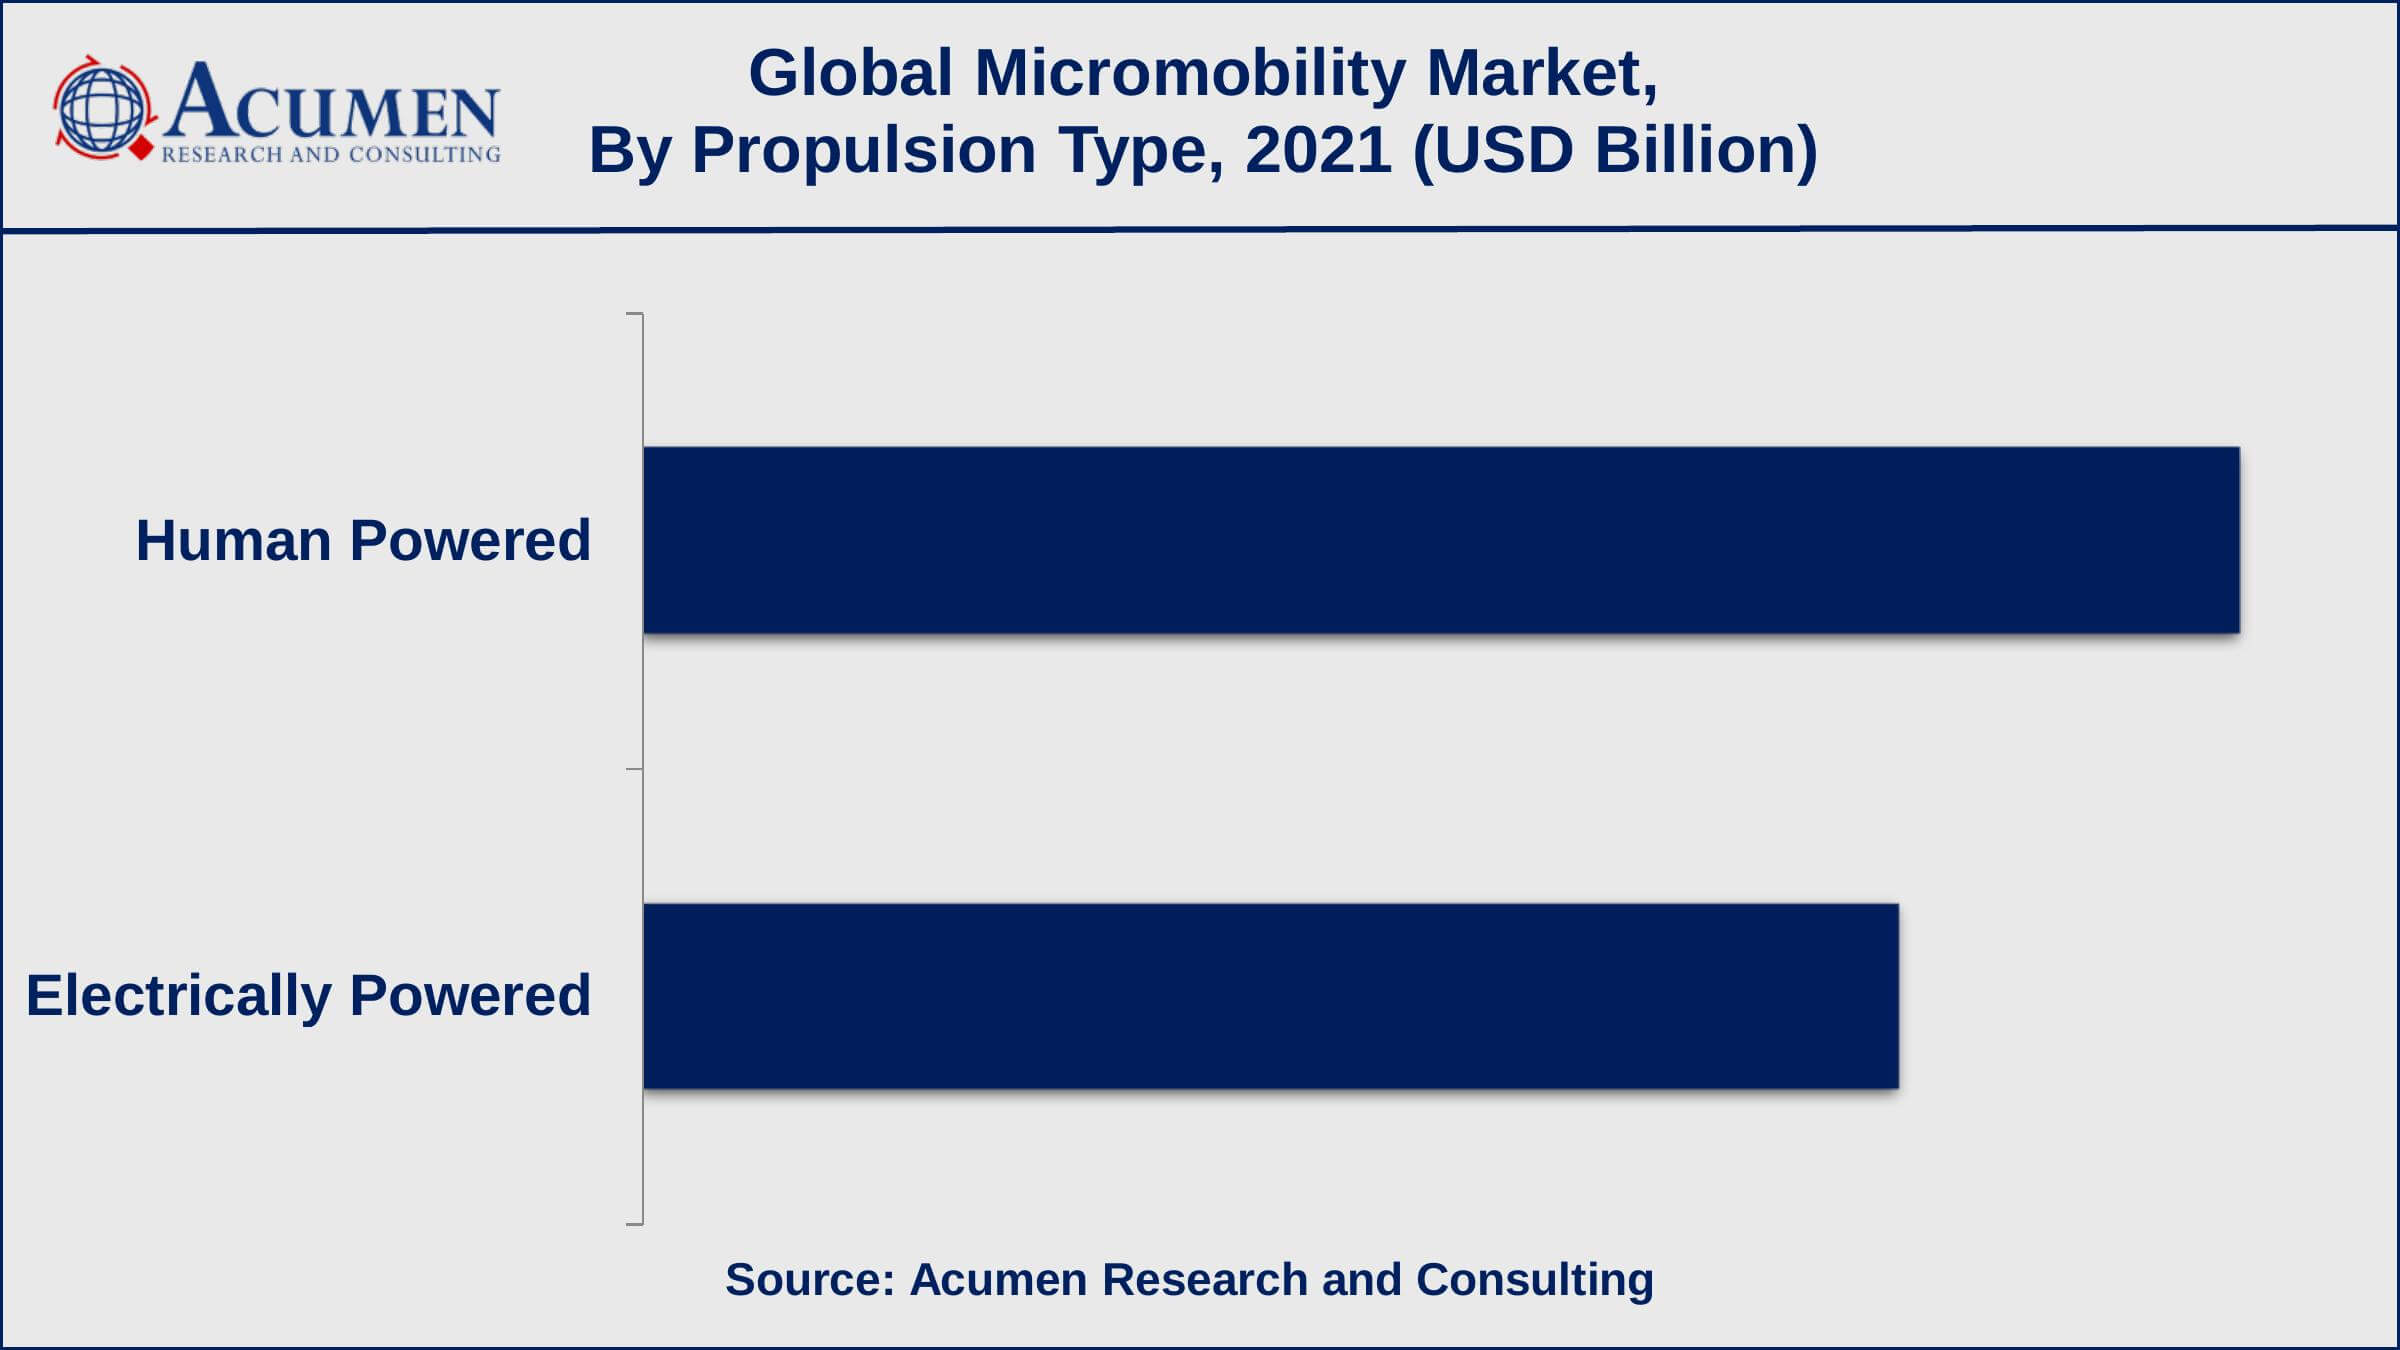
According to a micro-mobility industry analysis, the electrically powered sub-segment will have the greatest market share in 2021. This is due to a variety of factors, including their environmental friendliness, cost-effectiveness, and ease of use when compared to traditional modes of transportation. Furthermore, technological advancements such as longer-range batteries and improved charging infrastructure make electrically powered micro-mobility vehicles more accessible and convenient for urban commuters. The growing emphasis on sustainability and lowering carbon emissions is also driving the adoption of electrically powered micro-mobility vehicles, which is contributing to their market share growth.
Micromobility Market By Vehicle Type
- Bicycles
- E-Kick Scooters
- Hoverboard
- Low Speed EVs
- Skateboards
- Segway
- Mopeds and Scooters
In terms of vehicle type, the bicycle sub-segment is expected to account for a sizable market share in 2021. Bicycles have been around for a long time and are commonly used for transportation and recreation. The popularity of bicycles in the micro-mobility market has grown due to the rise of bike-sharing programmes and the growing demand for eco-friendly and cost-effective modes of transportation. Bicycles are also relatively inexpensive and simple to maintain, making them an appealing option for urban commuters. Furthermore, the growing emphasis on sustainability and reducing carbon emissions is driving bicycle adoption, contributing to their growing market share in the micro-mobility market.
Micromobility Market By Sharing Type
The docked sharing type captured the most market share in the micro-mobility market. Docked sharing is a bike-sharing system in which bikes are rented from and returned to specific stations. This type of sharing system is popular because of its convenience and accessibility, as users can rent and return bikes from a variety of locations throughout the city. Furthermore, docked sharing systems typically have larger fleets and more established infrastructure, making them more convenient and dependable for users. The continued growth of eco-friendly and cost-effective transportation methods in urban areas has also contributed to the popularity of docked-sharing systems.
Micromobility Market By Age Group
According to the micromobility market forecast, the 35-54 age group is expected to hold the largest share from 2022 to 2030. The 35-54 age groups have a higher level of disposable income, which allows them to try new and innovative modes of transportation like micro-mobility vehicles. Additionally, this age group is often seeking convenient and eco-friendly transportation options for commuting or leisure activities, which aligns with the benefits offered by micro-mobility vehicles. Furthermore, the 15-35 age group is often referred to as the millennial or Gen Z population and they have been found to have the highest adoption rate of micro-mobility vehicles, such as electric scooters, bicycles, and e-bikes.
Micromobility Market Regional Outlook
North America
Europe
- U.K.
- Germany
- France
- Spain
- Rest of Europe
Asia-Pacific
- India
- Japan
- China
- Australia
- South Korea
- Rest of Asia-Pacific
Latin America
- Brazil
- Mexico
- Rest of Latin America
The Middle East & Africa
- South Africa
- GCC Countries
- Rest of the Middle East & Africa (ME&A)
Micromobility Market Regional Analysis
The Asia-Pacific region was a major micromobility market with significant growth potential. China, Japan, and India were three of the leading countries in the Asia-Pacific micro-mobility market, driven by rising urbanization and a desire for more convenient, environmentally friendly and cost-effective modes of transportation. Bicycles and electric scooters were the most popular vehicle types in the Asia-Pacific micro-mobility market, owing to their popularity, low cost, and environmental friendliness. Factors such as increasing urbanization, a growing emphasis on sustainability, and increasing adoption for last-mile transportation solutions are driving the Asia-Pacific micro-mobility market. The region is also expected to witness a substantial growth rate in the coming years. In addition, North America and Europe were significant market for micro-mobility, with a growing demand for convenient and eco-friendly modes of transportation.
Micromobility Market Players
Some of the leading micromobility companies include Beijing Mobike Technology Co. Ltd, Bird Rides Inc., Boosted USA, DoorDash, Dynamic Bicycles, Easymile SAS, GoBike, GoJek, Lime, Micro Mobility Systems, Scoot Network, SEGWAY INC., Skip Transportation, and SWAGTRON.
CHAPTER 1. Industry Overview of Micromobility Market
1.1. Definition and Scope
1.1.1. Definition of Micromobility
1.1.2. Market Segmentation
1.1.3. Years Considered for the Study
1.1.4. Assumptions and Acronyms Used
1.1.4.1. Market Assumptions and Market Forecast
1.1.4.2. Acronyms Used in Global Micromobility Market
1.2. Summary
1.2.1. Executive Summary
1.2.2. Micromobility Market By Propulsion Type
1.2.3. Micromobility Market By Vehicle Type
1.2.4. Micromobility Market By Sharing Type
1.2.5. Micromobility Market By Age Group
1.2.6. Micromobility Market By Region
CHAPTER 2. Research Approach
2.1. Methodology
2.1.1. Research Programs
2.1.2. Market Size Estimation
2.1.3. Market Breakdown and Data Triangulation
2.2. Data Source
2.2.1. Secondary Sources
2.2.2. Primary Sources
CHAPTER 3. Market Dynamics And Competition Analysis
3.1. Market Drivers
3.1.1. Driver 1
3.1.2. Driver 2
3.2. Restraints and Challenges
3.2.1. Restraint 1
3.2.2. Restraint 2
3.3. Growth Opportunities
3.3.1. Opportunity 1
3.3.2. Opportunity 2
3.4. Porter’s Five Forces Analysis
3.4.1. Bargaining Power of Suppliers
3.4.2. Bargaining Power of Buyers
3.4.3. Threat of Substitute
3.4.4. Threat of New Entrants
3.4.5. Degree of Competition
3.5. Market Concentration Ratio and Market Maturity Analysis of Micromobility Market
3.5.1. Go To Market Strategy
3.5.1.1. Introduction
3.5.1.2. Growth
3.5.1.3. Maturity
3.5.1.4. Saturation
3.5.1.5. Possible Development
3.6. Technological Roadmap for Micromobility Market
3.7. Value Chain Analysis
3.7.1. List of Key Manufacturers
3.7.2. List of Customers
3.7.3. Level of Integration
3.8. Regulatory Compliance
3.9. Competitive Landscape, 2021
3.9.1. Player Positioning Analysis
3.9.2. Key Strategies Adopted By Leading Players
CHAPTER 4. Manufacturing Plant Analysis
4.1. Manufacturing Plant Location and Establish Date of Major Manufacturers in 2021
4.2. R&D Status of Major Manufacturers in 2021
CHAPTER 5. Micromobility Market By Propulsion Type
5.1. Introduction
5.2. Micromobility Market Revenue By Propulsion Type
5.2.1. Micromobility Market Revenue (USD Billion) and Forecast, By Propulsion Type, 2018-2030
5.2.2. Human Powered
5.2.2.1. Human Powered Market Revenue (USD Billion) and Growth Rate (%), 2018-2030
5.2.3. Electrically Powered
5.2.3.1. Electrically Powered Market Revenue (USD Billion) and Growth Rate (%), 2018-2030
CHAPTER 6. Micromobility Market By Vehicle Type
6.1. Introduction
6.2. Micromobility Market Revenue By Vehicle Type
6.2.1. Micromobility Market Revenue (USD Billion) and Forecast, By Vehicle Type, 2018-2030
6.2.2. E-Kick Scooters
6.2.2.1. E-Kick Scooters Market Revenue (USD Billion) and Growth Rate (%), 2018-2030
6.2.3. Bicycles
6.2.3.1. Bicycles Market Revenue (USD Billion) and Growth Rate (%), 2018-2030
6.2.4. Skateboards
6.2.4.1. Skateboards Market Revenue (USD Billion) and Growth Rate (%), 2018-2030
6.2.5. Hoverboards
6.2.5.1. Hoverboards Market Revenue (USD Billion) and Growth Rate (%), 2018-2030
6.2.6. Low Speed EVs
6.2.6.1. Low Speed EVs Market Revenue (USD Billion) and Growth Rate (%), 2018-2030
6.2.7. Segway Moped and Scooters
6.2.7.1. Segway Moped and Scooters Market Revenue (USD Billion) and Growth Rate (%), 2018-2030
6.2.8. Moped and Scooters
6.2.8.1. Moped and Scooters Market Revenue (USD Billion) and Growth Rate (%), 2018-2030
CHAPTER 7. Micromobility Market By Sharing Type
7.1. Introduction
7.2. Micromobility Market Revenue By Sharing Type
7.2.1. Micromobility Market Revenue (USD Billion) and Forecast, By Sharing Type, 2018-2030
7.2.2. Dockless
7.2.2.1. Dockless Market Revenue (USD Billion) and Growth Rate (%), 2018-2030
7.2.3. Docked
7.2.3.1. Docked Market Revenue (USD Billion) and Growth Rate (%), 2018-2030
CHAPTER 8. Micromobility Market By Age Group
8.1. Introduction
8.2. Micromobility Market Revenue By Age Group
8.2.1. Micromobility Market Revenue (USD Billion) and Forecast, By Age Group, 2018-2030
8.2.2. 35-54
8.2.2.1. 35-54 Market Revenue (USD Billion) and Growth Rate (%), 2018-2030
8.2.3. 15-34
8.2.3.1. 15-34 Market Revenue (USD Billion) and Growth Rate (%), 2018-2030
8.2.4. 55 and Above
8.2.4.1. 55 and Above Market Revenue (USD Billion) and Growth Rate (%), 2018-2030
CHAPTER 9. North America Micromobility Market By Country
9.1. North America Micromobility Market Overview
9.2. U.S.
9.2.1. U.S. Micromobility Market Revenue (USD Billion) and Forecast By Propulsion Type, 2018-2030
9.2.2. U.S. Micromobility Market Revenue (USD Billion) and Forecast By Vehicle Type, 2018-2030
9.2.3. U.S. Micromobility Market Revenue (USD Billion) and Forecast By Sharing Type, 2018-2030
9.2.4. U.S. Micromobility Market Revenue (USD Billion) and Forecast By Age Group, 2018-2030
9.3. Canada
9.3.1. Canada Micromobility Market Revenue (USD Billion) and Forecast By Propulsion Type, 2018-2030
9.3.2. Canada Micromobility Market Revenue (USD Billion) and Forecast By Vehicle Type, 2018-2030
9.3.3. Canada Micromobility Market Revenue (USD Billion) and Forecast By Sharing Type, 2018-2030
9.3.4. Canada Micromobility Market Revenue (USD Billion) and Forecast By Age Group, 2018-2030
9.4. North America PEST Analysis
CHAPTER 10. Europe Micromobility Market By Country
10.1. Europe Micromobility Market Overview
10.2. U.K.
10.2.1. U.K. Micromobility Market Revenue (USD Billion) and Forecast By Propulsion Type, 2018-2030
10.2.2. U.K. Micromobility Market Revenue (USD Billion) and Forecast By Vehicle Type, 2018-2030
10.2.3. U.K. Micromobility Market Revenue (USD Billion) and Forecast By Sharing Type, 2018-2030
10.2.4. U.K. Micromobility Market Revenue (USD Billion) and Forecast By Age Group, 2018-2030
10.3. Germany
10.3.1. Germany Micromobility Market Revenue (USD Billion) and Forecast By Propulsion Type, 2018-2030
10.3.2. Germany Micromobility Market Revenue (USD Billion) and Forecast By Vehicle Type, 2018-2030
10.3.3. Germany Micromobility Market Revenue (USD Billion) and Forecast By Sharing Type, 2018-2030
10.3.4. Germany Micromobility Market Revenue (USD Billion) and Forecast By Age Group, 2018-2030
10.4. France
10.4.1. France Micromobility Market Revenue (USD Billion) and Forecast By Propulsion Type, 2018-2030
10.4.2. France Micromobility Market Revenue (USD Billion) and Forecast By Vehicle Type, 2018-2030
10.4.3. France Micromobility Market Revenue (USD Billion) and Forecast By Sharing Type, 2018-2030
10.4.4. France Micromobility Market Revenue (USD Billion) and Forecast By Age Group, 2018-2030
10.5. Spain
10.5.1. Spain Micromobility Market Revenue (USD Billion) and Forecast By Propulsion Type, 2018-2030
10.5.2. Spain Micromobility Market Revenue (USD Billion) and Forecast By Vehicle Type, 2018-2030
10.5.3. Spain Micromobility Market Revenue (USD Billion) and Forecast By Sharing Type, 2018-2030
10.5.4. Spain Micromobility Market Revenue (USD Billion) and Forecast By Age Group, 2018-2030
10.6. Rest of Europe
10.6.1. Rest of Europe Micromobility Market Revenue (USD Billion) and Forecast By Propulsion Type, 2018-2030
10.6.2. Rest of Europe Micromobility Market Revenue (USD Billion) and Forecast By Vehicle Type, 2018-2030
10.6.3. Rest of Europe Micromobility Market Revenue (USD Billion) and Forecast By Sharing Type, 2018-2030
10.6.4. Rest of Europe Micromobility Market Revenue (USD Billion) and Forecast By Age Group, 2018-2030
10.7. Europe PEST Analysis
CHAPTER 11. Asia-Pacific Micromobility Market By Country
11.1. Asia-Pacific Micromobility Market Overview
11.2. China
11.2.1. China Micromobility Market Revenue (USD Billion) and Forecast By Propulsion Type, 2018-2030
11.2.2. China Micromobility Market Revenue (USD Billion) and Forecast By Vehicle Type, 2018-2030
11.2.3. China Micromobility Market Revenue (USD Billion) and Forecast By Sharing Type, 2018-2030
11.2.4. China Micromobility Market Revenue (USD Billion) and Forecast By Age Group, 2018-2030
11.3. Japan
11.3.1. Japan Micromobility Market Revenue (USD Billion) and Forecast By Propulsion Type, 2018-2030
11.3.2. Japan Micromobility Market Revenue (USD Billion) and Forecast By Vehicle Type, 2018-2030
11.3.3. Japan Micromobility Market Revenue (USD Billion) and Forecast By Sharing Type, 2018-2030
11.3.4. Japan Micromobility Market Revenue (USD Billion) and Forecast By Age Group, 2018-2030
11.4. India
11.4.1. India Micromobility Market Revenue (USD Billion) and Forecast By Propulsion Type, 2018-2030
11.4.2. India Micromobility Market Revenue (USD Billion) and Forecast By Vehicle Type, 2018-2030
11.4.3. India Micromobility Market Revenue (USD Billion) and Forecast By Sharing Type, 2018-2030
11.4.4. India Micromobility Market Revenue (USD Billion) and Forecast By Age Group, 2018-2030
11.5. India Australia
11.5.1. Australia Micromobility Market Revenue (USD Billion) and Forecast By Propulsion Type, 2018-2030
11.5.2. Australia Micromobility Market Revenue (USD Billion) and Forecast By Vehicle Type, 2018-2030
11.5.3. Australia Micromobility Market Revenue (USD Billion) and Forecast By Sharing Type, 2018-2030
11.5.4. Australia Micromobility Market Revenue (USD Billion) and Forecast By Age Group, 2018-2030
11.6. South Korea
11.6.1. South Korea Micromobility Market Revenue (USD Billion) and Forecast By Propulsion Type, 2018-2030
11.6.2. South Korea Micromobility Market Revenue (USD Billion) and Forecast By Vehicle Type, 2018-2030
11.6.3. South Korea Micromobility Market Revenue (USD Billion) and Forecast By Sharing Type, 2018-2030
11.6.4. South Korea Micromobility Market Revenue (USD Billion) and Forecast By Age Group, 2018-2030
11.7. Rest of Asia-Pacific
11.7.1. Rest of Asia-Pacific Micromobility Market Revenue (USD Billion) and Forecast By Propulsion Type, 2018-2030
11.7.2. Rest of Asia-Pacific Micromobility Market Revenue (USD Billion) and Forecast By Vehicle Type, 2018-2030
11.7.3. Rest of Asia-Pacific Micromobility Market Revenue (USD Billion) and Forecast By Sharing Type, 2018-2030
11.7.4. Rest of Asia-Pacific Micromobility Market Revenue (USD Billion) and Forecast By Age Group, 2018-2030
11.8. Asia-Pacific PEST Analysis
CHAPTER 12. Latin America Micromobility Market By Country
12.1. Latin America Micromobility Market Overview
12.2. Brazil
12.2.1. Brazil Micromobility Market Revenue (USD Billion) and Forecast By Propulsion Type, 2018-2030
12.2.2. Brazil Micromobility Market Revenue (USD Billion) and Forecast By Vehicle Type, 2018-2030
12.2.3. Brazil Micromobility Market Revenue (USD Billion) and Forecast By Sharing Type, 2018-2030
12.2.4. Brazil Micromobility Market Revenue (USD Billion) and Forecast By Age Group, 2018-2030
12.3. Mexico
12.3.1. Mexico Micromobility Market Revenue (USD Billion) and Forecast By Propulsion Type, 2018-2030
12.3.2. Mexico Micromobility Market Revenue (USD Billion) and Forecast By Vehicle Type, 2018-2030
12.3.3. Mexico Micromobility Market Revenue (USD Billion) and Forecast By Sharing Type, 2018-2030
12.3.4. Mexico Micromobility Market Revenue (USD Billion) and Forecast By Age Group, 2018-2030
12.4. Rest of Latin America
12.4.1. Rest of Latin America Micromobility Market Revenue (USD Billion) and Forecast By Propulsion Type, 2018-2030
12.4.2. Rest of Latin America Micromobility Market Revenue (USD Billion) and Forecast By Vehicle Type, 2018-2030
12.4.3. Rest of Latin America Micromobility Market Revenue (USD Billion) and Forecast By Sharing Type, 2018-2030
12.4.4. Rest of Latin America Micromobility Market Revenue (USD Billion) and Forecast By Age Group, 2018-2030
12.5. Latin America PEST Analysis
CHAPTER 13. Middle East & Africa Micromobility Market By Country
13.1. Middle East & Africa Micromobility Market Overview
13.2. GCC
13.2.1. GCC Micromobility Market Revenue (USD Billion) and Forecast By Propulsion Type, 2018-2030
13.2.2. GCC Micromobility Market Revenue (USD Billion) and Forecast By Vehicle Type, 2018-2030
13.2.3. GCC Micromobility Market Revenue (USD Billion) and Forecast By Sharing Type, 2018-2030
13.2.4. GCC Micromobility Market Revenue (USD Billion) and Forecast By Age Group, 2018-2030
13.3. South Africa
13.3.1. South Africa Micromobility Market Revenue (USD Billion) and Forecast By Propulsion Type, 2018-2030
13.3.2. South Africa Micromobility Market Revenue (USD Billion) and Forecast By Vehicle Type, 2018-2030
13.3.3. South Africa Micromobility Market Revenue (USD Billion) and Forecast By Sharing Type, 2018-2030
13.3.4. South Africa Micromobility Market Revenue (USD Billion) and Forecast By Age Group, 2018-2030
13.4. Rest of Middle East & Africa
13.4.1. Rest of Middle East & Africa Micromobility Market Revenue (USD Billion) and Forecast By Propulsion Type, 2018-2030
13.4.2. Rest of Middle East & Africa Micromobility Market Revenue (USD Billion) and Forecast By Vehicle Type, 2018-2030
13.4.3. Rest of Middle East & Africa Micromobility Market Revenue (USD Billion) and Forecast By Sharing Type, 2018-2030
13.4.4. Rest of Middle East & Africa Micromobility Market Revenue (USD Billion) and Forecast By Age Group, 2018-2030
13.5. Middle East & Africa PEST Analysis
CHAPTER 14. Player Analysis Of Micromobility Market
14.1. Micromobility Market Company Share Analysis
14.2. Competition Matrix
14.2.1. Competitive Benchmarking of key players by price, presence, market share, and R&D investment
14.2.2. New Product Launches and Product Enhancements
14.2.3. Mergers And Acquisition In Global Micromobility Market
14.2.4. Partnership, Joint Ventures and Strategic Alliances/ Sales Agreements
CHAPTER 15. Company Profile
15.1. Beijing Mobike Technology Co. Ltd
15.1.1. Company Snapshot
15.1.2. Business Overview
15.1.3. Financial Overview
15.1.3.1. Revenue (USD Billion), 2021
15.1.3.2. Beijing Mobike Technology Co. Ltd 2021 Micromobility Business Regional Distribution
15.1.4. Product /Service and Specification
15.1.5. Recent Developments & Business Strategy
15.2. Bird Rides Inc.
15.3. Boosted USA
15.4. DoorDash
15.5. Dynamic Bicycles
15.6. Easymile SAS
15.7. GoBike
15.8. GoJek
15.9. Lime
15.10. Micro Mobility Systems
15.11. Scoot Network
15.12. SEGWAY INC.
15.13. Skip Transportation
15.14. SWAGTRON