Microfluidic Devices Market | Acumen Research and Consulting
Microfluidic Devices Market Size - Global Industry, Share, Analysis, Trends and Forecast 2023 - 2032
Published :
Report ID:
Pages :
Format : 
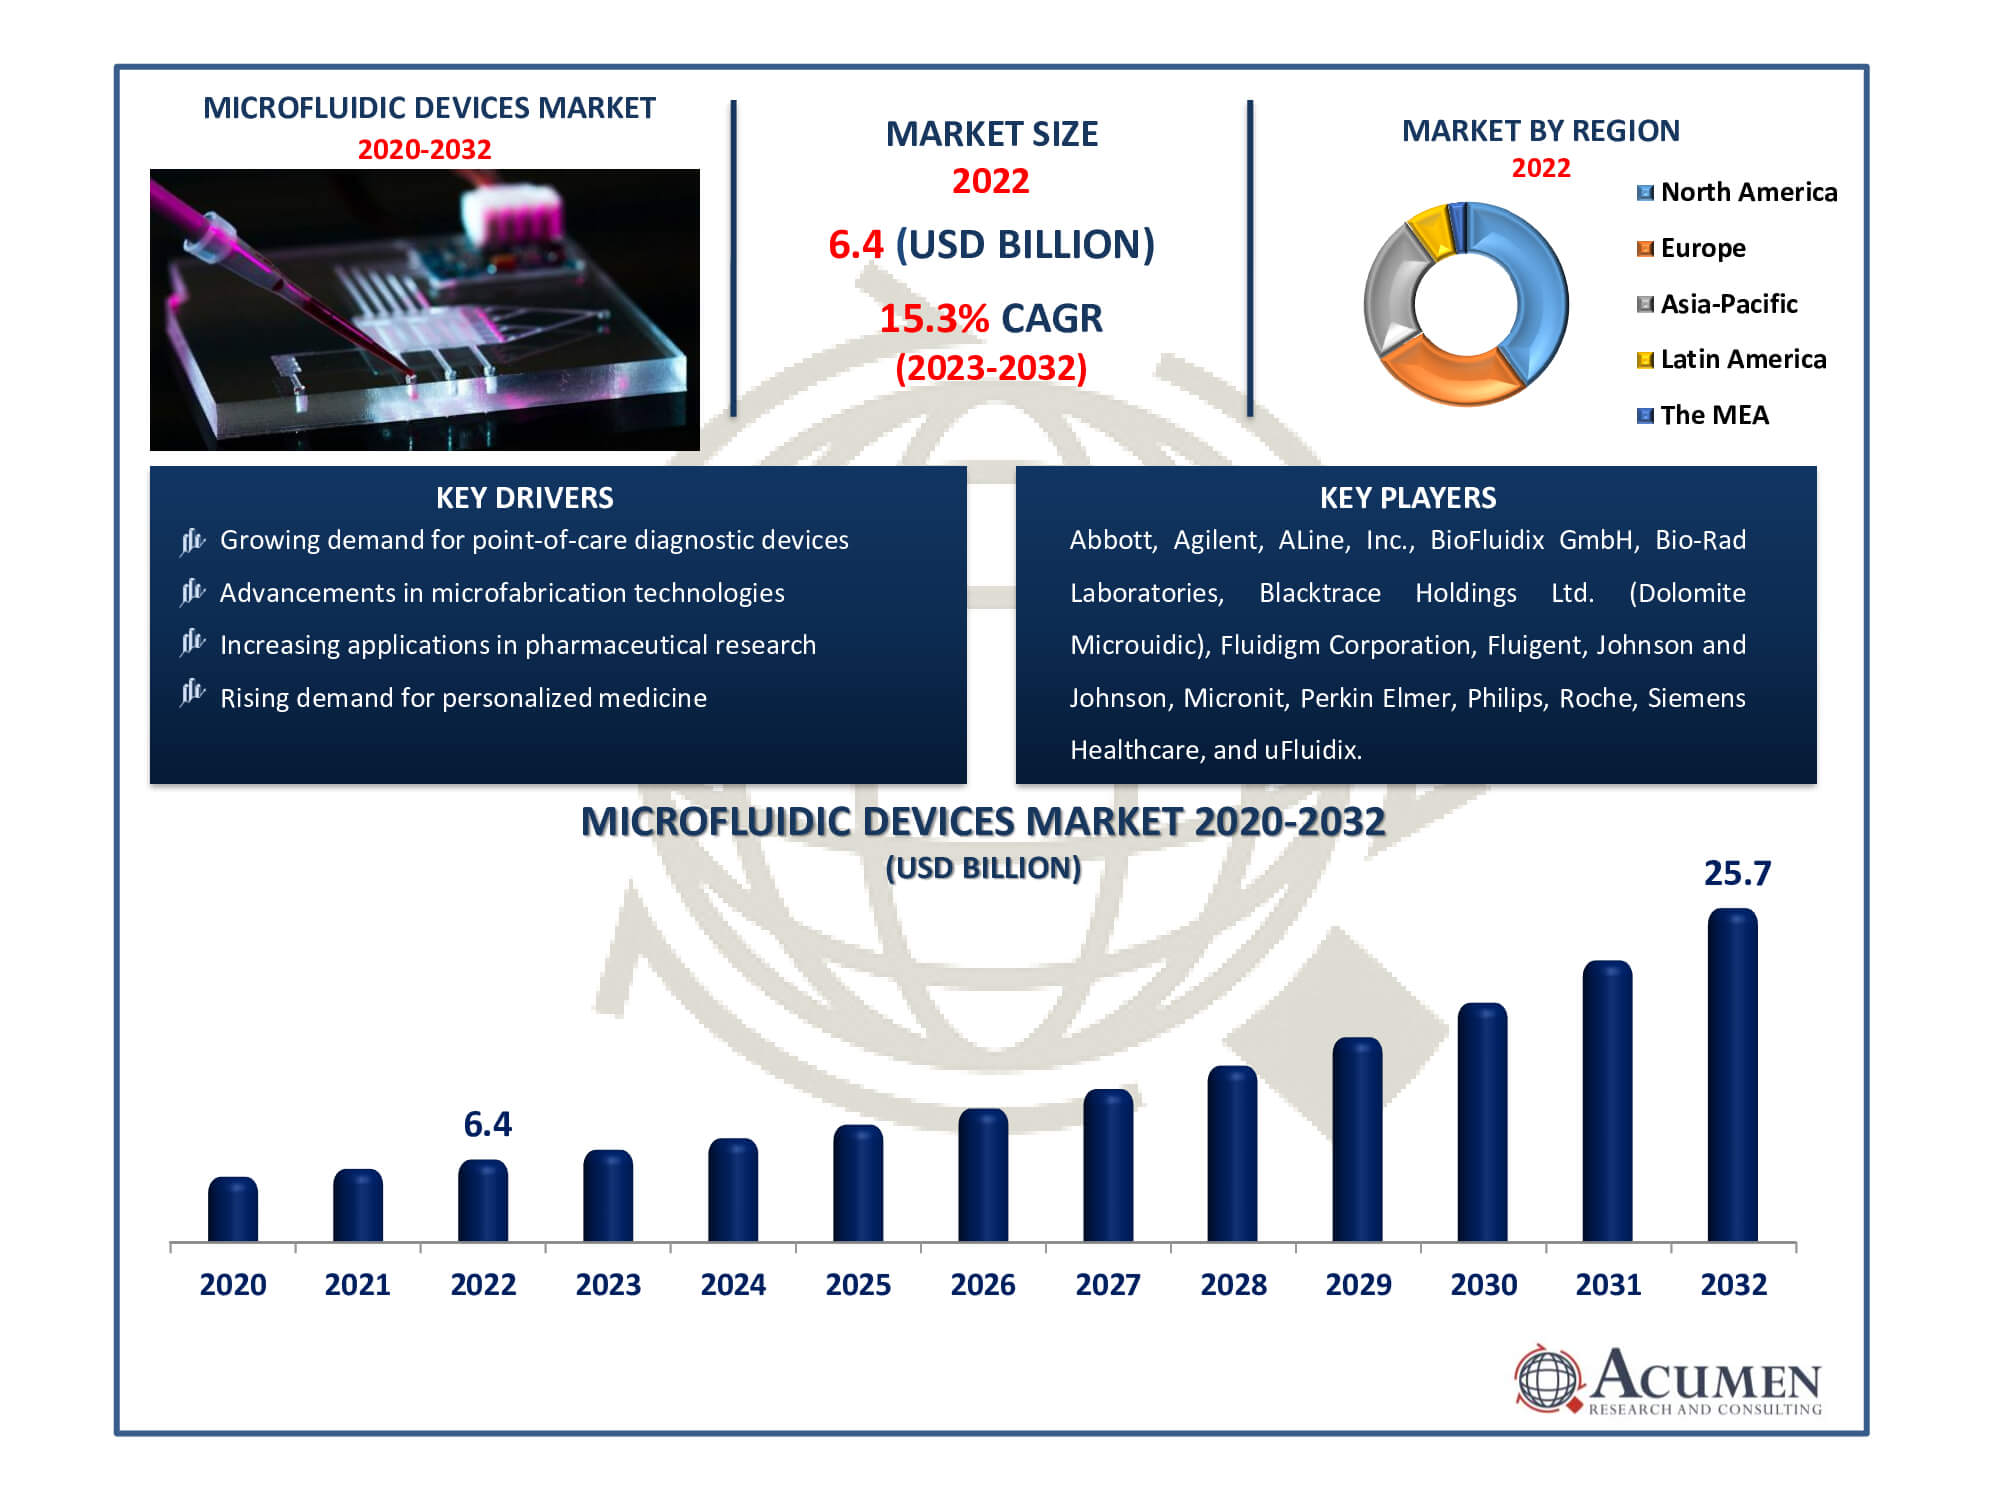
The Global Microfluidic Devices Market Size accounted for USD 6.4 Billion in 2022 and is estimated to achieve a market size of USD 25.7 Billion by 2032 growing at a CAGR of 15.3% from 2023 to 2032.
Microfluidic Devices Market Highlights
- Global microfluidic devices market revenue is poised to garner USD 25.7 billion by 2032 with a CAGR of 15.3% from 2023 to 2032
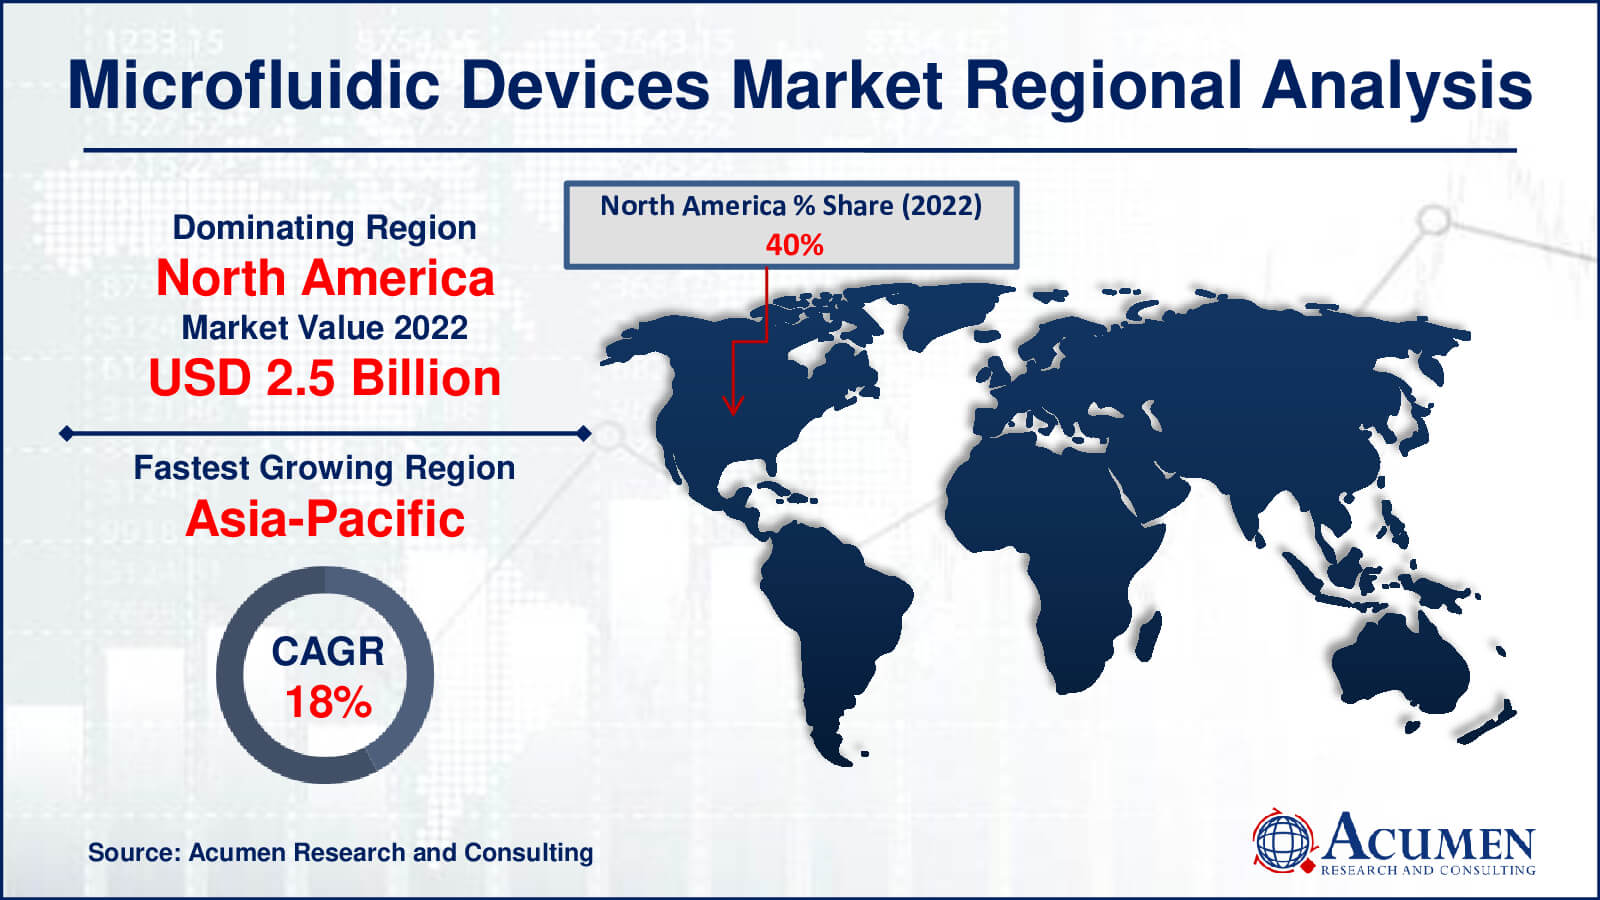
- North America microfluidic devices market value occupied around USD 2.5 billion in 2022
- Asia-Pacific microfluidic devices market growth will record a CAGR of more than 18% from 2023 to 2032
- Among device type, the chips sub-segment generated over US$ 5.4 billion revenue in 2022
- Based on application, the pharmaceutical and life science research sub-segment generated around 25% share in 2022
- Growth in the microfluidics for cell manipulation and single-cell analysis is a popular microfluidic devices market trend that fuels the industry demand

Microfluidics is the science and multidisciplinary field that involves engineering, physics, chemistry, biochemistry, nanotechnology, and biotechnology. It deals with the manipulation and controlling of fluids that are geometrically constrained to a small scale at which capillary penetration governs mass transport. It has emerged as the new area of research as it enables the manipulation of small volumes of fluid in a precise manner along with its application in various fields including chemistry, biology, medicine, and physical sciences. Microfluidic devices ease one-to-one interaction studies between microbes by mimicking and controlling features of the intricate microenvironment of natural microbial habitats. Microfluidic devices are referred to as “lab-on-a-chip” because biological reactions, which are traditionally carried out in laboratories, can now be performed on one chip. Additionally, the advantages associated with the microfluidic devices include shortened reaction time, integration of multiple reactions, and a reduced amount of sample and reagent on one chip. In addition, microfluidic devices have enabled the manipulation of single cells, which are difficult to handle with human hands.
Global Microfluidic Devices Market Dynamics
Market Drivers
- Growing demand for point-of-care diagnostic devices
- Advancements in microfabrication technologies
- Increasing applications in pharmaceutical research
- Rising demand for personalized medicine
- Expansion of the biotechnology and life sciences sector
Market Restraints
- High development and production costs
- Technical challenges in fluid handling and control
- Regulatory hurdles in healthcare applications
Market Opportunities
- Miniaturization of diagnostic devices for portability
- Expansion into emerging markets
- Integration of microfluidics in drug development
- Collaborations and partnerships for technology innovation
Microfluidic Devices Market Report Coverage
| Market | Vacuum Truck Market |
| Vacuum Truck Market Size 2022 | USD 6.4 Billion |
| Vacuum Truck Market Forecast 2032 | USD 25.7 Billion |
| Vacuum Truck Market CAGR During 2023 - 2032 | 15.3% |
| Vacuum Truck Market Analysis Period | 2020 - 2032 |
| Base Year |
2022 |
| Forecast Data | 2023 - 2032 |
| Segments Covered | By Device Type, By Material, By Application, By End-User, And By Geography |
| Regional Scope | North America, Europe, Asia Pacific, Latin America, and Middle East & Africa |
| Key Companies Profiled | Abbott, Agilent, ALine, Inc., BioFluidix GmbH, Bio-Rad Laboratories, Blacktrace Holdings Ltd. (Dolomite Microuidic), Fluidigm Corporation, Fluigent, Johnson and Johnson, Micronit, Perkin Elmer, Philips, Roche, Siemens Healthcare, and uFluidix. |
| Report Coverage |
Market Trends, Drivers, Restraints, Competitive Analysis, Player Profiling, Covid-19 Analysis, Regulation Analysis |
Microfluidic Devices Market Insights
The increasing focus on data precision and accuracy and fast returns on investment is accelerating the usage of these devices across the concerned industries. The advantages such as faster testing and improved portability through microfluidic chip miniaturization are further bolstering the demand in the market. Additionally, the entry of new players and the launch of new and advanced products is further propelling the market value. A number of important elements define the microfluidic devices market dynamics. One driving factor is the increase in demand for point-of-care testing, which eliminates the need for centralized laboratories by providing quick and on-site diagnoses. Furthermore, the creation of more complex microfluidic devices is being made possible by technological developments, particularly those related to materials and production methods.
For industries using these devices, data precision and speedy returns on investment are crucial factors, with a heavy emphasis on accurate outcomes. These gadgets become even more appealing thanks to the miniaturization of microfluidic chips, which improves portability. The market is seeing fierce competition as a result of the entry of new rivals and the continual production of innovative products. The market for microfluidic devices is flourishing and changing as a result of these factors, and it has the potential to grow much more as technology develops and its uses spread to new fields including healthcare, biotechnology, and diagnostics.
Microfluidic Devices Market Segmentation
The worldwide market for microfluidic devices is split based on device type, material, application, end-user, and geography.
Microfluidic Device Types
- Chips
- Sensors
- Others
According to the microfluidic devices industry analysis, chips sector has the biggest market share in 2022. These devices' core components are microfluidic chips, which offer platforms for fluid manipulation and analysis. Their adaptability and extensive usage across numerous sectors, including healthcare and the life sciences, support their market supremacy. Chip technology is constantly improving, further securing its dominant position since it enables accurate and effective fluid management and analysis across a wide range of applications.
Microfluidic Device Materials
- Polymer
- Glass
- Silicon
- Others
The polymer category expected to dominates the market for microfluidic devices since it is the most affordable, easiest to fabricate, and compatible with a variety of applications. Because of its outstanding optical qualities, glass comes in anticipate to the second as the largest segment, making it appropriate for applications requiring accurate measurement and observation. Glass maintains its position as the second-largest material segment in the market thanks to its chemical resistance and optical clarity, while polymer's versatility and cost-effectiveness fuel its domination.
Microfluidic Device Applications
- Pharmaceutical and Life Science Research
- Clinical and Veterinary Diagnostics
- Point of Care Diagnostics
- Analytical Devices
- Drug Delivery
- Environmental and Industrial
- Others
The pharmaceutical and life science research sector is the largest and second-largest in the microfluidic devices market. The reason for this domination is the vital role that microfluidic devices play in driving innovation and research in the life sciences and pharmaceutical industries. The greatest portion of these devices is employed extensively in drug development, genomics, and proteomics research. As it meets crucial healthcare needs and research requirements, its use in clinical diagnostics and veterinary testing also contributes to the segment's relevance, securing its position as the second-largest.
Microfluidic Device End-Users
- Hospitals & Diagnostic Centers
- Academic & Research Institutes
- Pharmaceutical & Biotechnology Companies
According to the microfluidic devices market forecast, hospitals & diagnostic centres is expected to dominate the market from 2023 to 2032. Rapid and accurate diagnostics are made possible by microfluidic technology, which is crucial in clinical and hospital settings. They are crucial instruments in diagnostic centres because they expedite testing procedures, shorten turnaround times, and improve patient care. The necessity for quick and precise diagnoses is driving up demand in the healthcare industry, which puts the hospitals & diagnostic centres section at the top of the market.
Microfluidic Devices Market Regional Outlook
North America
- U.S.
- Canada
Europe
- U.K.
- Germany
- France
- Spain
- Rest of Europe
Asia-Pacific
- India
- Japan
- China
- Australia
- South Korea
- Rest of Asia-Pacific
Latin America
- Brazil
- Mexico
- Rest of Latin America
The Middle East & Africa
- South Africa
- GCC Countries
- Rest of the Middle East & Africa (ME&A)

Microfluidic Devices Market Regional Analysis
In 2022, North America held the largest share of revenue (US$ Mn) in the microfluidic devices market, driven by the rising incidence of chronic diseases in the region. The demand for point-of-care testing (POC), increased academic and government investments in genomics and proteomics research, a growing need for high-quality research tools, and stakeholders' focus on projects related to proteins, associated biomolecules, and genes further contributed to the region's market dominance. Europe followed closely as the second-largest market.
The second-largest market for microfluidic devices is Europe, after North America. Similar to North America, Europe has a strong research environment that is highlighted by significant investments in the domains of genomics, proteomics, and other life sciences. The emphasis on genetic and protein-related research as well as the desire for high-quality research instruments all contributes to the regional market's growth. The development of microfluidic devices in this region is aided by the cooperative character of European research institutes and government initiatives.
The Asia-Pacific region, including major economies like China and India, is expected to experience the fastest growth from 2023 to 2032. The rapid development of these economies, coupled with increased healthcare investments and rising disposable income, is driving market growth. Additionally, a strong focus on technological advancement by industry players in the region is enhancing the market's value.
Microfluidic Devices Market Players
Some of the top microfluidic devices companies offered in our report includes Abbott, Agilent, ALine, Inc., BioFluidix GmbH, Bio-Rad Laboratories, Blacktrace Holdings Ltd. (Dolomite Microuidic), Fluidigm Corporation, Fluigent, Johnson and Johnson, Micronit, Perkin Elmer, Philips, Roche, Siemens Healthcare, and uFluidix.
Frequently Asked Questions
How big is the microfluidic devices market?
The microfluidic devices market was USD 6.4 billion in 2022.
What is the CAGR of the global microfluidic devices market from 2023 to 2032?
The CAGR of microfluidic devices is 15.3% during the analysis period of 2023 to 2032.
Which are the key players in the microfluidic devices market?
The key players operating in the global market are including Abbott, Agilent, ALine, Inc., BioFluidix GmbH, Bio-Rad Laboratories, Blacktrace Holdings Ltd. (Dolomite Microuidic), Fluidigm Corporation, Fluigent, Johnson and Johnson, Micronit, Perkin Elmer, Philips, Roche, Siemens Healthcare, and uFluidix.
Which region dominated the global microfluidic devices market share?
North America held the dominating position in microfluidic devices industry during the analysis period of 2023 to 2032.
Which region registered fastest CAGR from 2023 to 2032?
Asia-Pacific region exhibited fastest growing CAGR for market of microfluidic devices during the analysis period of 2023 to 2032.
What are the current trends and dynamics in the global microfluidic devices industry?
The current trends and dynamics in the microfluidic devices industry include growing demand for point-of-care diagnostic devices, advancements in microfabrication technologies, increasing applications in pharmaceutical research, rising demand for personalized medicine, and expansion of the biotechnology and life sciences sector.
Which type held the maximum share in 2022?
The chips type held the maximum share of the microfluidic devices industry.
Select Licence Type
Connect with our sales team
Why Acumen Research And Consulting
100%
Customer Satisfaction
24x7
Availability - we are always there when you need us
200+
Fortune 50 Companies trust Acumen Research and Consulting
80%
of our reports are exclusive and first in the industry
100%
more data and analysis
1000+
reports published till date


