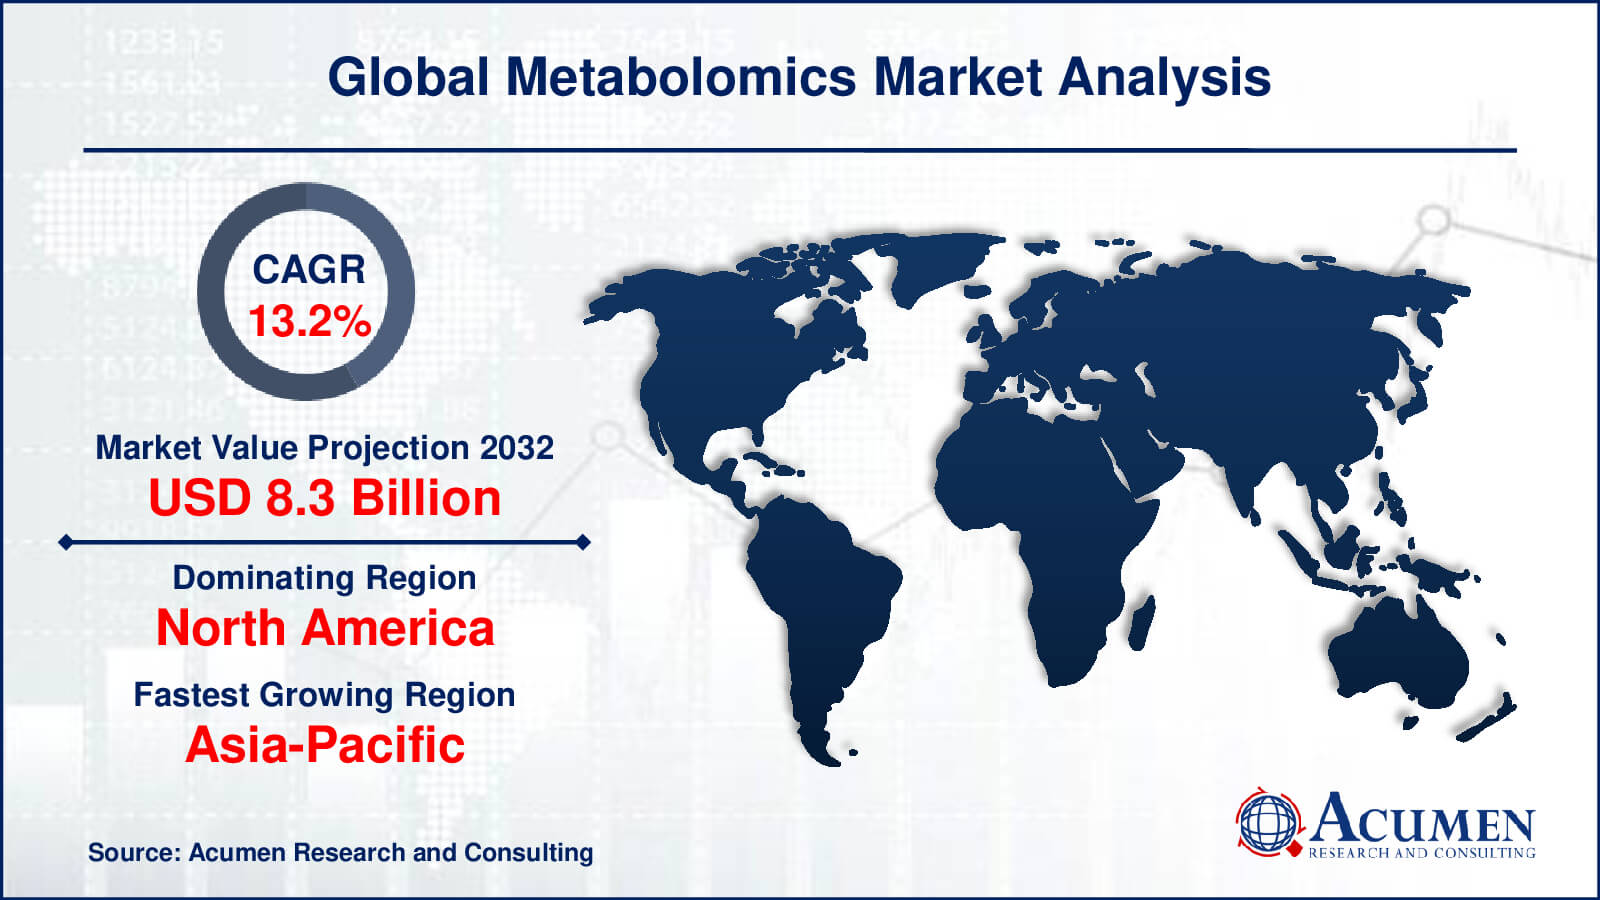
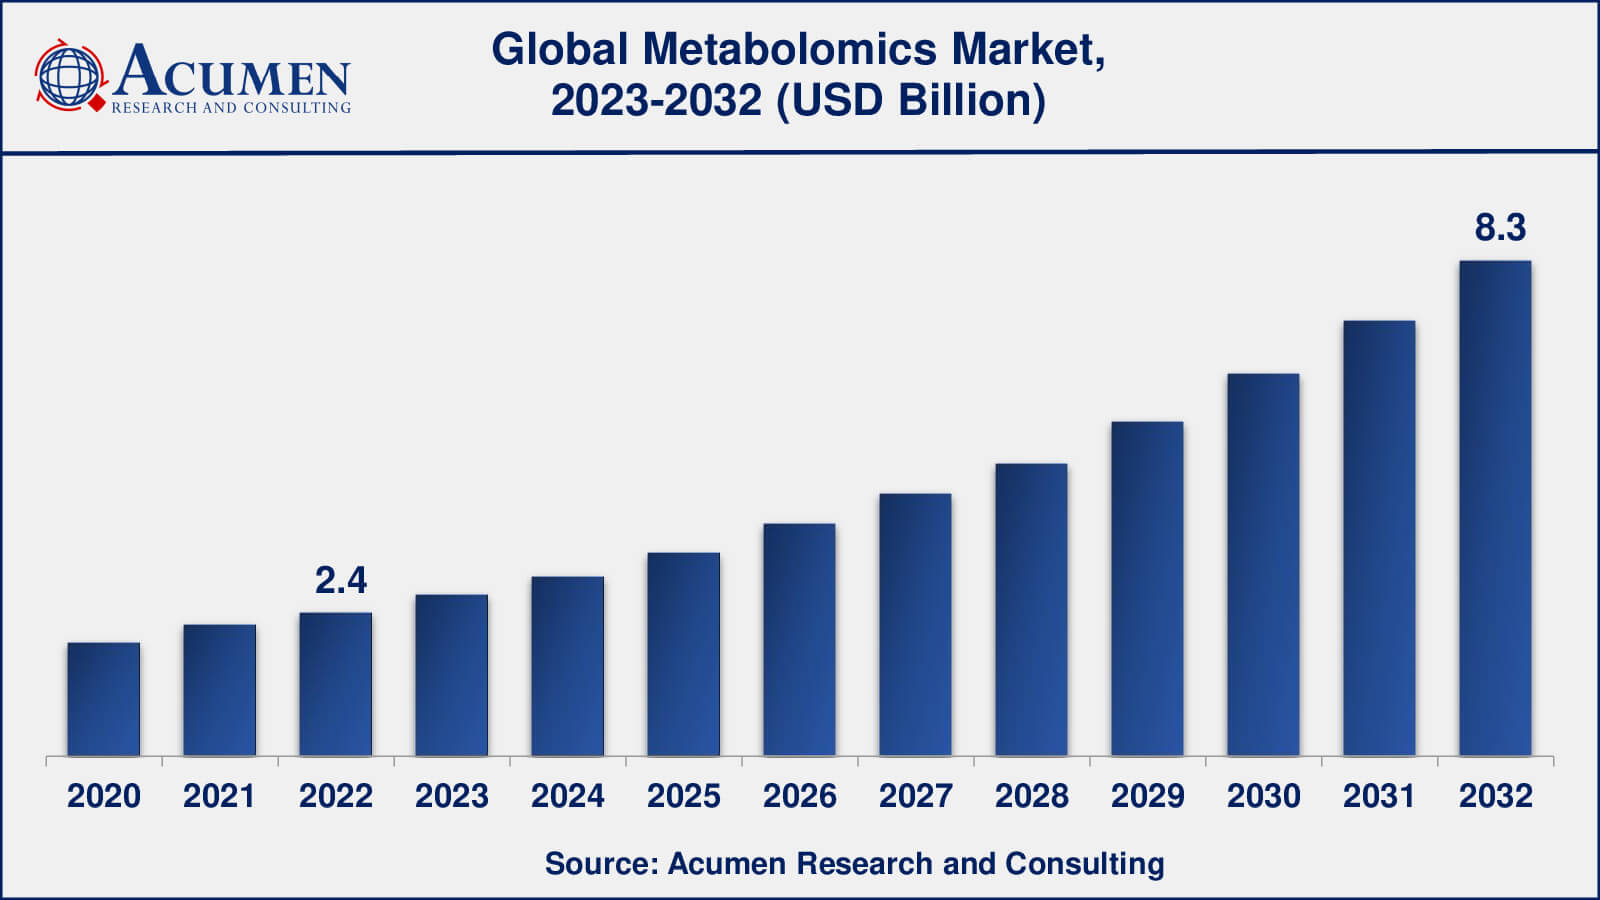
The Global Metabolomics Market Size collected USD 2.4 Billion in 2022 and is set to achieve a market size of USD 8.3 Billion in 2032 growing at a CAGR of 13.2% from 2023 to 2032.
Metabolomics Market Report Statistics
- Global metabolomics market revenue is estimated to reach USD 8.3 billion by 2032 with a CAGR of 13.2% from 2023 to 2032
- North America metabolomics market value occupied more than USD 1 billion in 2022
- Asia-Pacific metabolomics market growth will record a CAGR of around 13% from 2023 to 2032
- Among indication, the cancer sub-segment generated 40% share in 2022
- Based on application, the biomarker discovery generated more than US $ 744 million revenue in 2022
- Integration of artificial intelligence (AI) is a popular metabolomics market trend that fuels the industry demand
The global natural language processing market is in an extremely profitable stage, especially for natural language processing software-based service providers and solution vendors. This is because of the increasing number of organizations and business firms working in a large number of domains and diverse verticals across the globe which are rapidly adopting natural language processing solutions for filling the communication gap between machines and humans. Rising demand for efficient improved and enhanced consumer experience around the world is uplifting to encourage end-user industries to increase their overall investments in natural language processing services and solutions which in turn is a key factor fueling the growth of the global natural language processing market over the forecast period. Moreover, the rising adoption of natural language programming in customer care processing organizations as well as a reduction in initial and operation costs is considered to be some of the key aspects anticipated to boost the growth of the global natural language processing market. In addition, improved insights into consumer perception as well as optimized business processes coupled with easy machine-to-machine technology can be easily derived by using natural processing language.
Global Metabolomics Market Dynamics
Market Drivers
- Increasing demand for personalized medicine
- Increased funding for metabolomics research
- Growing applications in drug discovery and development
- Rising prevalence of chronic diseases
- Emergence of metabolomics consortia
Market Restraints
- High cost of equipment and analysis
- Limited standardization of analytical methods
- Lack of comprehensive metabolite databases
Market Opportunities
- Expansion of metabolomics applications
- Growing interest in microbiome research
- Increasing demand for point-of-care testing
Metabolomics Market Report Coverage
Market |
Metabolomics Market |
Metabolomics Market Size 2022 |
USD 2.4 Billion |
Metabolomics Market Forecast 2032 |
USD 8.3 Billion |
Metabolomics Market CAGR During 2023 - 2032 |
13.2% |
Metabolomics Market Analysis Period |
2020 - 2032 |
Metabolomics Market Base Year |
2022 |
Metabolomics Market Forecast Data |
2023 - 2032 |
Segments Covered |
By Product & Service, By Indication, By Application, By End-Use, And By Geography
|
Regional Scope |
North America, Europe, Asia Pacific, Latin America, and Middle East & Africa |
Key Companies Profiled |
Thermo Fisher Scientific Inc., Biocrates Life Sciences AG, Human Metabolome Technologies Inc., Metabolon Inc., Bruker Corporation, LECO Corporation, Waters Corporation, Agilent Technologies, Bio-Rad laboratories Inc., Shimadzu Corporation.
|
Report Coverage
|
Market Trends, Drivers, Restraints, Competitive Analysis, Player Profiling, Covid-19 Analysis, Regulation Analysis |
Metabolomics Market Growth Factors
The global metabolomics market is majorly driven due to increasing demand for personalized medicines. Moreover, increasing government funding and organizational initiatives, especially in Europe and North America is a key factor fueling the growth of the metabolomics market. The increasing necessity for improved research and development facilities along with rising investments in toxicology technologies across pharmaceutical and biotechnology sectors are some key factors propelling the growth of the global metabolomics market. Since personalized healthcare facilities facilitate in providing information to detect the onset of diseases at an earlier stage, it prevents the progression of the disease as well as increases the effectiveness of the healthcare system by refining the overall availability, quality, and affordability, thus driving the global metabolomics market. The increasing prevalence of chronic degenerative diseases such as neurodegenerative diseases, cardiovascular diseases, cancer, etc. is a key opportunity for the growth of the metabolomics market. Also, growing unmet medical demands is in turn creating the demand for personalized medication facilities across the globe, thus driving the market for metabolomics. However, the lack of standardized protocols and data complexity are some major factors hindering the growth of the global metabolomics market. Moreover, the shortage of skilled personnel in the field of metabolomics and the unavailability of complete metabolite libraries are some important factors hampering the market growth.
Metabolomics Market Segmentation
The worldwide metabolomics market is categorized based on product & service, indication, application, end-use, and geography.
Metabolomics Market By Product & Service
- Metabolomics Instruments
- Metabolomics Bioinformatics Tools & Service
According to the metabolomics market forecast, the metabolomics bioinformatics tools and services segment is also growing rapidly, driven by the need for specialized software and expertise to analyze and interpret large metabolomics datasets. Data processing and analysis software, statistical tools, and data visualization tools are all part of the bioinformatics segment. This segment's expansion is anticipated to keep up in the coming years as the volume and complexity of metabolomics data increases. However, in 2022, the metabolomics instruments segment accounted for the lion's share of the metabolomics market, with mass spectrometry instruments accounting for the lion's share of this segment. This segment's expansion can be attributed to the increasing use of mass spectrometry-based metabolomics for drug discovery, disease diagnosis, and biomarker identification.
Metabolomics Market By Indication
- Cancer
- Cardiovascular Disorders
- Neurological Disorders
- Inborn Errors of Metabolism
- Others
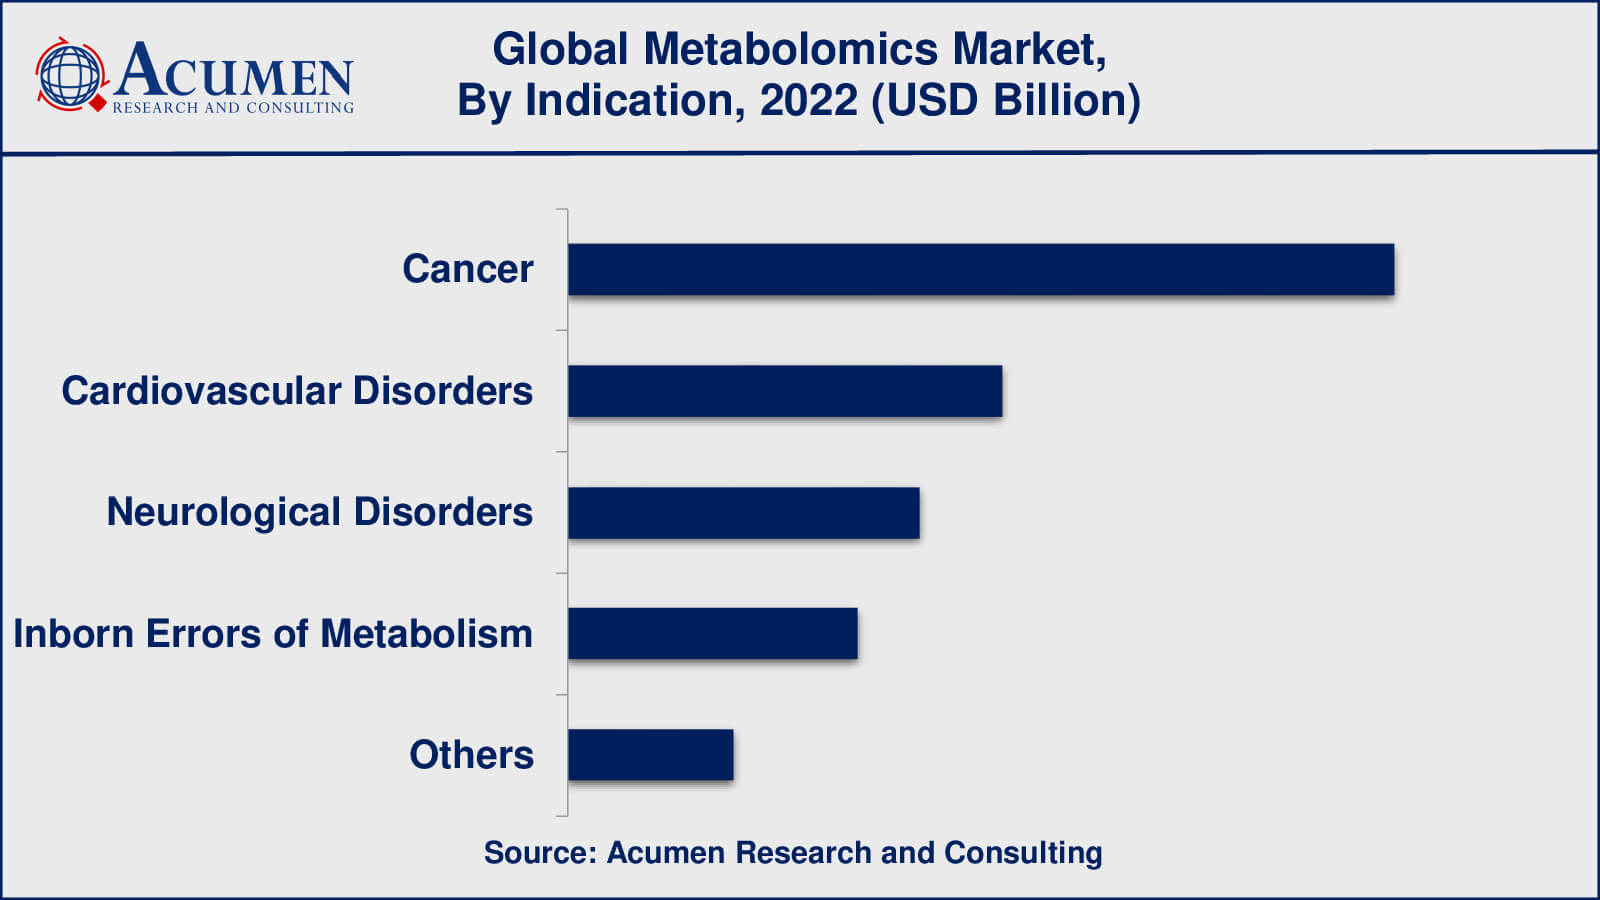
Among all the indications, cancer sub-segment is expected to occupy significant market share in 2022 and is likely to continue in the coming years from 2023 to 2032. Cancer is a significant indication for metabolomics research and has been the subject of numerous studies in recent years. Metabolomics has been used to identify metabolic biomarkers for various types of cancer, including breast, lung, prostate, and ovarian cancer. These biomarkers can be used to develop new diagnostic tools, monitor disease progression, and develop targeted therapies.
Metabolomics Market By Application
- Biomarker Discovery
- Drug Discovery
- Toxicology Testing
- Nutrigenomics
- Functional Genomics
- Personalized Medicine
- Others
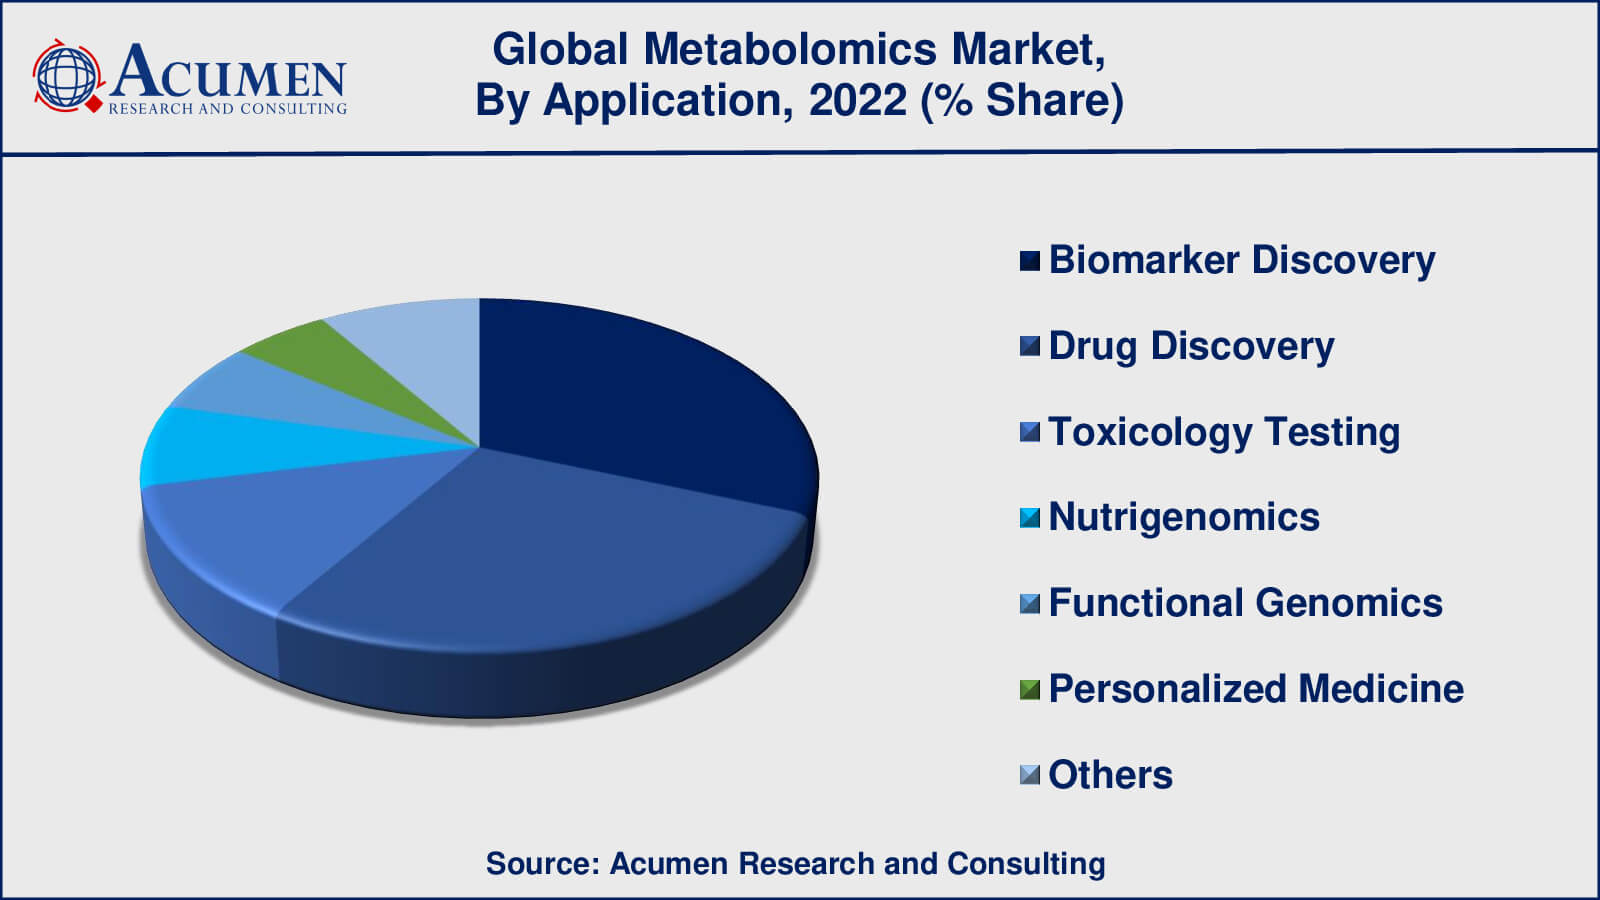
According to our metabolomics industry analysis, biomarker discovery will be the most important application segment for the metabolomics market in 2022. This segment includes diagnostics, drug discovery, and personalized medicine applications. Metabolomics' ability to identify metabolic biomarkers linked to a variety of diseases has made it an appealing tool for developing new diagnostic tests and personalized treatments. However, other application segments for metabolomics research and application include drug discovery, toxicology testing, nutrigenomics, and functional genomics. Metabolomics, for example, is increasingly being used in drug discovery to identify potential drug targets and screen compounds for their effects on metabolic pathways.
Metabolomics Market By End-Use
- Academic Research & Institutes
- Pharmaceutical & Biotechnology Companies
- Contract Research Organizations
- Others
End-users in the metabolomics market are dominated by pharmaceutical and biotechnology companies. Metabolomics is becoming a valuable tool for the pharmaceutical and biotechnology industries due to its increasing use in drug discovery and development, as well as personalized medicine. Metabolomics is a technique for identifying metabolic biomarkers linked to various diseases and developing targeted therapies based on these biomarkers. Because metabolomics is used in a wide range of basic and applied research applications, academic research and institutes is a significant end-use segment for the metabolomics market. Contract research organizations (CROs), which provide research services to the pharmaceutical, biotechnology, and academic sectors, are another important end-use segment.
Metabolomics Market Regional Outlook
North America
Europe
- U.K.
- Germany
- France
- Spain
- Rest of Europe
Asia-Pacific
- India
- Japan
- China
- Australia
- South Korea
- Rest of Asia-Pacific
Latin America
- Brazil
- Mexico
- Rest of Latin America
The Middle East & Africa
- South Africa
- GCC Countries
- Rest of the Middle East & Africa (ME&A)
Metabolomics Market Regional Analysis
In 2022, North America dominated the metabolomics market, accounting for the largest share. This is due, in part, to the presence of a large number of pharmaceutical and biotechnology companies in the region, as well as the high level of R&D investment.
Europe is also a major market for metabolomics, with major players in the field including the United Kingdom, Germany, and France. The Asia Pacific region is expected to be the fastest growing metabolomics market, owing to factors such as increased investment in healthcare and life sciences research, a thriving biopharmaceutical industry, and the existence of a large and diverse population.
Metabolomics Market Players
Some of the global Metabolomics companies profiled in the report include Thermo Fisher Scientific Inc., Biocrates Life Sciences AG, Human Metabolome Technologies Inc., Metabolon Inc., Bruker Corporation, LECO Corporation, Waters Corporation, Agilent Technologies, Bio-Rad laboratories Inc., Shimadzu Corporation.
CHAPTER 1. Industry Overview of Metabolomics Market
1.1. Definition and Scope
1.1.1. Definition of Metabolomics
1.1.2. Market Segmentation
1.1.3. Years Considered for the Study
1.1.4. Assumptions and Acronyms Used
1.1.4.1. Market Assumptions and Market Forecast
1.1.4.2. Acronyms Used in Global Metabolomics Market
1.2. Summary
1.2.1. Executive Summary
1.2.2. Metabolomics Market By Product & Service
1.2.3. Metabolomics Market By Indication
1.2.4. Metabolomics Market By Application
1.2.5. Metabolomics Market By End-Use
1.2.6. Metabolomics Market By Region
CHAPTER 2. Research Approach
2.1. Methodology
2.1.1. Research Programs
2.1.2. Market Size Estimation
2.1.3. Market Breakdown and Data Triangulation
2.2. Data Source
2.2.1. Secondary Sources
2.2.2. Primary Sources
CHAPTER 3. Market Dynamics And Competition Analysis
3.1. Market Drivers
3.1.1. Driver 1
3.1.2. Driver 2
3.2. Restraints and Challenges
3.2.1. Restraint 1
3.2.2. Restraint 2
3.3. Growth Opportunities
3.3.1. Opportunity 1
3.3.2. Opportunity 2
3.4. Porter’s Five Forces Analysis
3.4.1. Bargaining Power of Suppliers
3.4.2. Bargaining Power of Buyers
3.4.3. Threat of Substitute
3.4.4. Threat of New Entrants
3.4.5. Degree of Competition
3.5. Market Concentration Ratio and Market Maturity Analysis of Metabolomics Market
3.5.1. Go To Market Strategy
3.5.1.1. Introduction
3.5.1.2. Growth
3.5.1.3. Maturity
3.5.1.4. Saturation
3.5.1.5. Possible Development
3.6. Technological Roadmap for Metabolomics Market
3.7. Value Chain Analysis
3.7.1. List of Key Manufacturers
3.7.2. List of Customers
3.7.3. Level of Integration
3.8. Cost Structure Analysis
3.8.1. Price Trend of Key Raw Materials
3.8.2. Raw Material Suppliers
3.8.3. Proportion of Manufacturing Cost Structure
3.8.3.1. Material
3.8.3.2. Labor Cost
3.8.3.3. Manufacturing Expense
3.9. Regulatory Compliance
3.10. Competitive Landscape, 2022
3.10.1. Player Positioning Analysis
3.10.2. Key Strategies Adopted By Leading Players
CHAPTER 4. Flooring & Wall Panels Plant Analysis
4.1. Manufacturing Plant Location and Establish Date of Major Manufacturers in 2022
4.2. R&D Status of Major Manufacturers in 2022
CHAPTER 5. Metabolomics Market By Product & Service
5.1. Introduction
5.2. Metabolomics Market Revenue By Product & Service
5.2.1. Metabolomics Market Revenue (USD Billion) and Forecast, By Product & Service, 2020-2032
5.2.2. Metabolomics Instruments
5.2.2.1. Metabolomics Instruments Market Revenue (USD Billion) and Growth Rate (%), 2020-2032
5.2.3. Metabolomics Bioinformatics Tools & Service
5.2.3.1. Metabolomics Bioinformatics Tools & Service Market Revenue (USD Billion) and Growth Rate (%), 2020-2032
CHAPTER 6. Metabolomics Market By Indication
6.1. Introduction
6.2. Metabolomics Market Revenue By Indication
6.2.1. Metabolomics Market Revenue (USD Billion) and Forecast, By Indication, 2020-2032
6.2.2. Cancer
6.2.2.1. Cancer Market Revenue (USD Billion) and Growth Rate (%), 2020-2032
6.2.3. Cardiovascular Disorders
6.2.3.1. Cardiovascular Disorders Market Revenue (USD Billion) and Growth Rate (%), 2020-2032
6.2.4. Neurological Disorders
6.2.4.1. Neurological Disorders Market Revenue (USD Billion) and Growth Rate (%), 2020-2032
6.2.5. Inborn Errors of Metabolism
6.2.5.1. Inborn Errors of Metabolism Market Revenue (USD Billion) and Growth Rate (%), 2020-2032
6.2.6. Others
6.2.6.1. Others Market Revenue (USD Billion) and Growth Rate (%), 2020-2032
CHAPTER 7. Metabolomics Market By Application
7.1. Introduction
7.2. Metabolomics Market Revenue By Application
7.2.1. Metabolomics Market Revenue (USD Billion) and Forecast, By Application, 2020-2032
7.2.2. Biomarker Discovery
7.2.2.1. Biomarker Discovery Market Revenue (USD Billion) and Growth Rate (%), 2020-2032
7.2.3. Drug Discovery
7.2.3.1. Drug Discovery Market Revenue (USD Billion) and Growth Rate (%), 2020-2032
7.2.4. Toxicology Testing
7.2.4.1. Toxicology Testing Market Revenue (USD Billion) and Growth Rate (%), 2020-2032
7.2.5. Nutrigenomics
7.2.5.1. Nutrigenomics Market Revenue (USD Billion) and Growth Rate (%), 2020-2032
7.2.6. Functional Genomics
7.2.6.1. Functional Genomics Market Revenue (USD Billion) and Growth Rate (%), 2020-2032
7.2.7. Personalized Medicine
7.2.7.1. Personalized Medicine Market Revenue (USD Billion) and Growth Rate (%), 2020-2032
7.2.8. Others
7.2.8.1. Others Market Revenue (USD Billion) and Growth Rate (%), 2020-2032
CHAPTER 8. Metabolomics Market By End-Use
8.1. Introduction
8.2. Metabolomics Market Revenue By End-Use
8.2.1. Metabolomics Market Revenue (USD Billion) and Forecast, By End-Use, 2020-2032
8.2.2. Academic Research & Institutes
8.2.2.1. Academic Research & Institutes Market Revenue (USD Billion) and Growth Rate (%), 2020-2032
8.2.3. Pharmaceutical & Biotechnology Companies
8.2.3.1. Pharmaceutical & Biotechnology Companies Market Revenue (USD Billion) and Growth Rate (%), 2020-2032
8.2.4. Contract Research Organizations
8.2.4.1. Contract Research Organizations Market Revenue (USD Billion) and Growth Rate (%), 2020-2032
8.2.5. Others
8.2.5.1. Others Market Revenue (USD Billion) and Growth Rate (%), 2020-2032
CHAPTER 9. North America Metabolomics Market By Country
9.1. North America Metabolomics Market Overview
9.2. U.S.
9.2.1. U.S. Metabolomics Market Revenue (USD Billion) and Forecast By Product & Service, 2020-2032
9.2.2. U.S. Metabolomics Market Revenue (USD Billion) and Forecast By Indication, 2020-2032
9.2.3. U.S. Metabolomics Market Revenue (USD Billion) and Forecast By Application, 2020-2032
9.2.4. U.S. Metabolomics Market Revenue (USD Billion) and Forecast By End-Use, 2020-2032
9.3. Canada
9.3.1. Canada Metabolomics Market Revenue (USD Billion) and Forecast By Product & Service, 2020-2032
9.3.2. Canada Metabolomics Market Revenue (USD Billion) and Forecast By Indication, 2020-2032
9.3.3. Canada Metabolomics Market Revenue (USD Billion) and Forecast By Application, 2020-2032
9.3.4. Canada Metabolomics Market Revenue (USD Billion) and Forecast By End-Use, 2020-2032
9.4. North America PEST Analysis
CHAPTER 10. Europe Metabolomics Market By Country
10.1. Europe Metabolomics Market Overview
10.2. U.K.
10.2.1. U.K. Metabolomics Market Revenue (USD Billion) and Forecast By Product & Service, 2020-2032
10.2.2. U.K. Metabolomics Market Revenue (USD Billion) and Forecast By Indication, 2020-2032
10.2.3. U.K. Metabolomics Market Revenue (USD Billion) and Forecast By Application, 2020-2032
10.2.4. U.K. Metabolomics Market Revenue (USD Billion) and Forecast By End-Use, 2020-2032
10.3. Germany
10.3.1. Germany Metabolomics Market Revenue (USD Billion) and Forecast By Product & Service, 2020-2032
10.3.2. Germany Metabolomics Market Revenue (USD Billion) and Forecast By Indication, 2020-2032
10.3.3. Germany Metabolomics Market Revenue (USD Billion) and Forecast By Application, 2020-2032
10.3.4. Germany Metabolomics Market Revenue (USD Billion) and Forecast By End-Use, 2020-2032
10.4. France
10.4.1. France Metabolomics Market Revenue (USD Billion) and Forecast By Product & Service, 2020-2032
10.4.2. France Metabolomics Market Revenue (USD Billion) and Forecast By Indication, 2020-2032
10.4.3. France Metabolomics Market Revenue (USD Billion) and Forecast By Application, 2020-2032
10.4.4. France Metabolomics Market Revenue (USD Billion) and Forecast By End-Use, 2020-2032
10.5. Spain
10.5.1. Spain Metabolomics Market Revenue (USD Billion) and Forecast By Product & Service, 2020-2032
10.5.2. Spain Metabolomics Market Revenue (USD Billion) and Forecast By Indication, 2020-2032
10.5.3. Spain Metabolomics Market Revenue (USD Billion) and Forecast By Application, 2020-2032
10.5.4. Spain Metabolomics Market Revenue (USD Billion) and Forecast By End-Use, 2020-2032
10.6. Rest of Europe
10.6.1. Rest of Europe Metabolomics Market Revenue (USD Billion) and Forecast By Product & Service, 2020-2032
10.6.2. Rest of Europe Metabolomics Market Revenue (USD Billion) and Forecast By Indication, 2020-2032
10.6.3. Rest of Europe Metabolomics Market Revenue (USD Billion) and Forecast By Application, 2020-2032
10.6.4. Rest of Europe Metabolomics Market Revenue (USD Billion) and Forecast By End-Use, 2020-2032
10.7. Europe PEST Analysis
CHAPTER 11. Asia-Pacific Metabolomics Market By Country
11.1. Asia-Pacific Metabolomics Market Overview
11.2. China
11.2.1. China Metabolomics Market Revenue (USD Billion) and Forecast By Product & Service, 2020-2032
11.2.2. China Metabolomics Market Revenue (USD Billion) and Forecast By Indication, 2020-2032
11.2.3. China Metabolomics Market Revenue (USD Billion) and Forecast By Application, 2020-2032
11.2.4. China Metabolomics Market Revenue (USD Billion) and Forecast By End-Use, 2020-2032
11.3. Japan
11.3.1. Japan Metabolomics Market Revenue (USD Billion) and Forecast By Product & Service, 2020-2032
11.3.2. Japan Metabolomics Market Revenue (USD Billion) and Forecast By Indication, 2020-2032
11.3.3. Japan Metabolomics Market Revenue (USD Billion) and Forecast By Application, 2020-2032
11.3.4. Japan Metabolomics Market Revenue (USD Billion) and Forecast By End-Use, 2020-2032
11.4. India
11.4.1. India Metabolomics Market Revenue (USD Billion) and Forecast By Product & Service, 2020-2032
11.4.2. India Metabolomics Market Revenue (USD Billion) and Forecast By Indication, 2020-2032
11.4.3. India Metabolomics Market Revenue (USD Billion) and Forecast By Application, 2020-2032
11.4.4. India Metabolomics Market Revenue (USD Billion) and Forecast By End-Use, 2020-2032
11.5. Australia
11.5.1. Australia Metabolomics Market Revenue (USD Billion) and Forecast By Product & Service, 2020-2032
11.5.2. Australia Metabolomics Market Revenue (USD Billion) and Forecast By Indication, 2020-2032
11.5.3. Australia Metabolomics Market Revenue (USD Billion) and Forecast By Application, 2020-2032
11.5.4. Australia Metabolomics Market Revenue (USD Billion) and Forecast By End-Use, 2020-2032
11.6. South Korea
11.6.1. South Korea Metabolomics Market Revenue (USD Billion) and Forecast By Product & Service, 2020-2032
11.6.2. South Korea Metabolomics Market Revenue (USD Billion) and Forecast By Indication, 2020-2032
11.6.3. South Korea Metabolomics Market Revenue (USD Billion) and Forecast By Application, 2020-2032
11.6.4. South Korea Metabolomics Market Revenue (USD Billion) and Forecast By End-Use, 2020-2032
11.7. Rest of Asia-Pacific
11.7.1. Rest of Asia-Pacific Metabolomics Market Revenue (USD Billion) and Forecast By Product & Service, 2020-2032
11.7.2. Rest of Asia-Pacific Metabolomics Market Revenue (USD Billion) and Forecast By Indication, 2020-2032
11.7.3. Rest of Asia-Pacific Metabolomics Market Revenue (USD Billion) and Forecast By Application, 2020-2032
11.7.4. Rest of Asia-Pacific Metabolomics Market Revenue (USD Billion) and Forecast By End-Use, 2020-2032
11.8. Asia-Pacific PEST Analysis
CHAPTER 12. Latin America Metabolomics Market By Country
12.1. Latin America Metabolomics Market Overview
12.2. Brazil
12.2.1. Brazil Metabolomics Market Revenue (USD Billion) and Forecast By Product & Service, 2020-2032
12.2.2. Brazil Metabolomics Market Revenue (USD Billion) and Forecast By Indication, 2020-2032
12.2.3. Brazil Metabolomics Market Revenue (USD Billion) and Forecast By Application, 2020-2032
12.2.4. Brazil Metabolomics Market Revenue (USD Billion) and Forecast By End-Use, 2020-2032
12.3. Mexico
12.3.1. Mexico Metabolomics Market Revenue (USD Billion) and Forecast By Product & Service, 2020-2032
12.3.2. Mexico Metabolomics Market Revenue (USD Billion) and Forecast By Indication, 2020-2032
12.3.3. Mexico Metabolomics Market Revenue (USD Billion) and Forecast By Application, 2020-2032
12.3.4. Mexico Metabolomics Market Revenue (USD Billion) and Forecast By End-Use, 2020-2032
12.4. Rest of Latin America
12.4.1. Rest of Latin America Metabolomics Market Revenue (USD Billion) and Forecast By Product & Service, 2020-2032
12.4.2. Rest of Latin America Metabolomics Market Revenue (USD Billion) and Forecast By Indication, 2020-2032
12.4.3. Rest of Latin America Metabolomics Market Revenue (USD Billion) and Forecast By Application, 2020-2032
12.4.4. Rest of Latin America Metabolomics Market Revenue (USD Billion) and Forecast By End-Use, 2020-2032
12.5. Latin America PEST Analysis
CHAPTER 13. Middle East & Africa Metabolomics Market By Country
13.1. Middle East & Africa Metabolomics Market Overview
13.2. GCC
13.2.1. GCC Metabolomics Market Revenue (USD Billion) and Forecast By Product & Service, 2020-2032
13.2.2. GCC Metabolomics Market Revenue (USD Billion) and Forecast By Indication, 2020-2032
13.2.3. GCC Metabolomics Market Revenue (USD Billion) and Forecast By Application, 2020-2032
13.2.4. GCC Metabolomics Market Revenue (USD Billion) and Forecast By End-Use, 2020-2032
13.3. South Africa
13.3.1. South Africa Metabolomics Market Revenue (USD Billion) and Forecast By Product & Service, 2020-2032
13.3.2. South Africa Metabolomics Market Revenue (USD Billion) and Forecast By Indication, 2020-2032
13.3.3. South Africa Metabolomics Market Revenue (USD Billion) and Forecast By Application, 2020-2032
13.3.4. South Africa Metabolomics Market Revenue (USD Billion) and Forecast By End-Use, 2020-2032
13.4. Rest of Middle East & Africa
13.4.1. Rest of Middle East & Africa Metabolomics Market Revenue (USD Billion) and Forecast By Product & Service, 2020-2032
13.4.2. Rest of Middle East & Africa Metabolomics Market Revenue (USD Billion) and Forecast By Indication, 2020-2032
13.4.3. Rest of Middle East & Africa Metabolomics Market Revenue (USD Billion) and Forecast By Application, 2020-2032
13.4.4. Rest of Middle East & Africa Metabolomics Market Revenue (USD Billion) and Forecast By End-Use, 2020-2032
13.5. Middle East & Africa PEST Analysis
CHAPTER 14. Player Analysis Of Metabolomics Market
14.1. Metabolomics Market Company Share Analysis
14.2. Competition Matrix
14.2.1. Competitive Benchmarking of key players by Product & Service, presence, market share, and R&D investment
14.2.2. New Product & Service Launches and Product & Service Enhancements
14.2.3. Mergers And Acquisition In Global Metabolomics Market
14.2.4. Partnership, Joint Ventures and Strategic Alliances/ Sales Agreements
CHAPTER 15. Company Profile
15.1. Thermo Fisher Scientific Inc.
15.1.1. Company Snapshot
15.1.2. Business Overview
15.1.3. Financial Overview
15.1.3.1. Revenue (USD Billion), 2022
15.1.3.2. Thermo Fisher Scientific Inc. 2022 Metabolomics Business Regional Distribution
15.1.4. Product & Service/Service and Specification
15.1.5. Recent Developments & Business Strategy
15.2. Biocrates Life Sciences AG
15.3. Human Metabolome Technologies Inc.
15.4. Metabolon Inc.
15.5. Bruker Corporation
15.6. LECO Corporation
15.7. Waters Corporation
15.8. Agilent Technologies
15.9. Bio-Rad laboratories Inc.
15.10. Shimadzu Corporation