Marine Emission Control Systems Market Size - Global Industry, Share, Analysis, Trends and Forecast 2024 - 2032
Published :
Report ID:
Pages :
Format :
Marine Emission Control Systems Market Size - Global Industry, Share, Analysis, Trends and Forecast 2024 - 2032
Report Coverage
- Industry Dynamics
- Market Size and Forecast Data
- Segment Analysis
- Competitive Landscape
- Regional Analysis with a Niche Focus on Country-Level Data
- High Level Analysis - Porter's, PESTEL, Value Chain, etc.
- Company Profiles of Key Players
- Option to Customize the Report As Per Your Specific Need
Request Sample Report
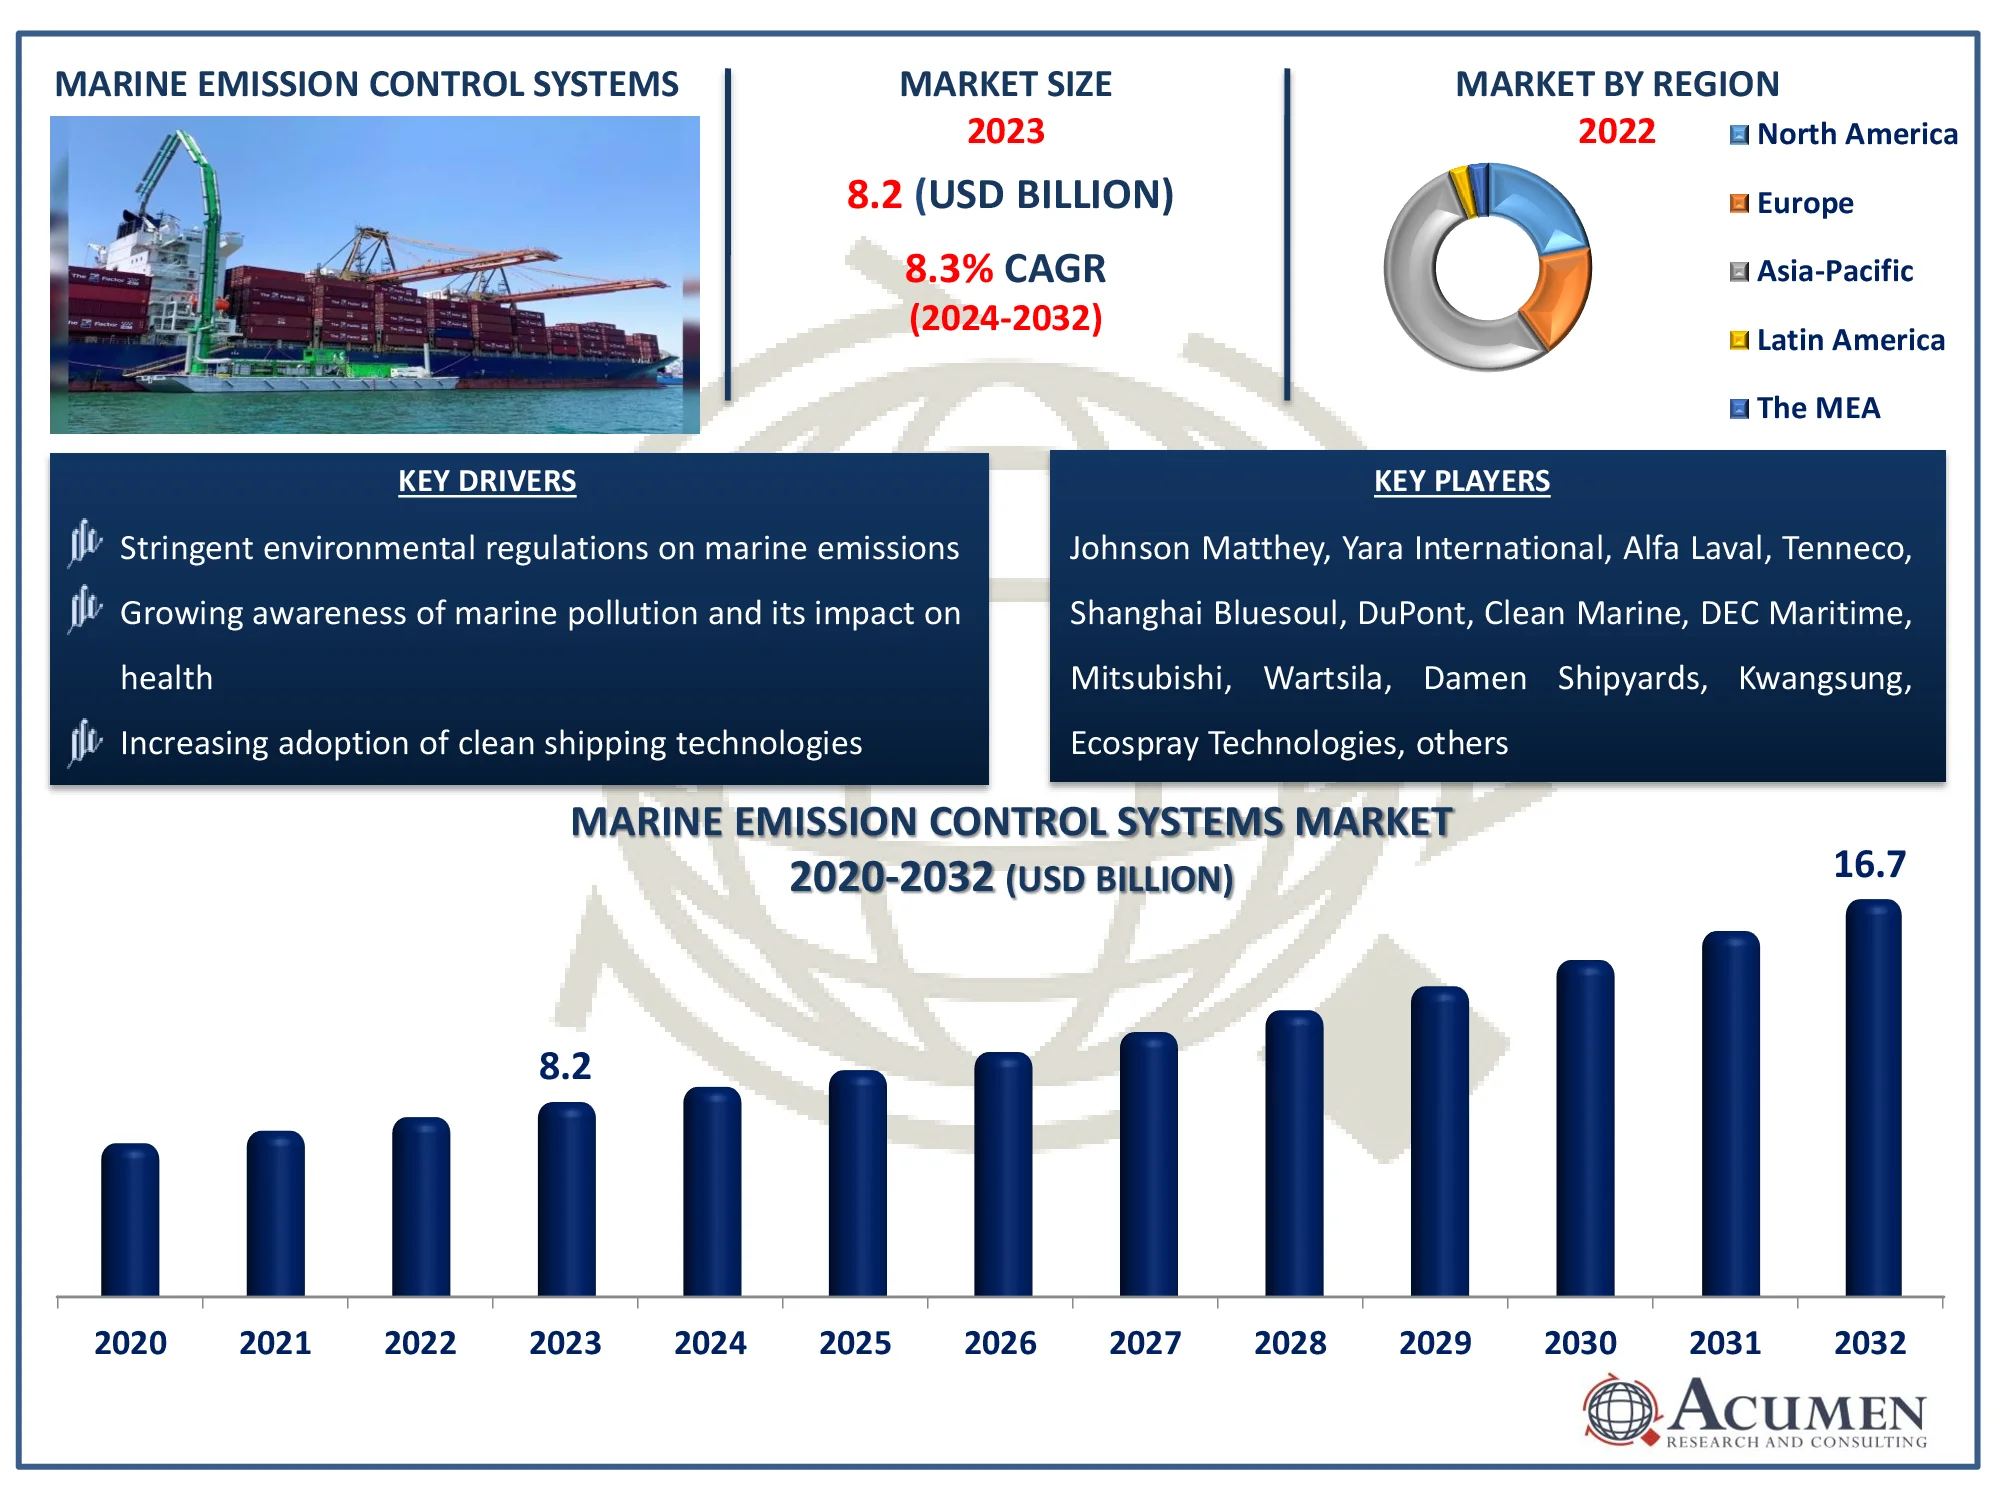
The Global Marine Emission Control Systems Market Size accounted for USD 8.2 Billion in 2023 and is estimated to achieve a market size of USD 16.7 Billion by 2032 growing at a CAGR of 8.3% from 2024 to 2032.
Marine Emission Control Systems Market Highlights
- Global marine emission control systems market revenue is poised to garner USD 16.7 billion by 2032 with a CAGR of 8.3% from 2024 to 2032
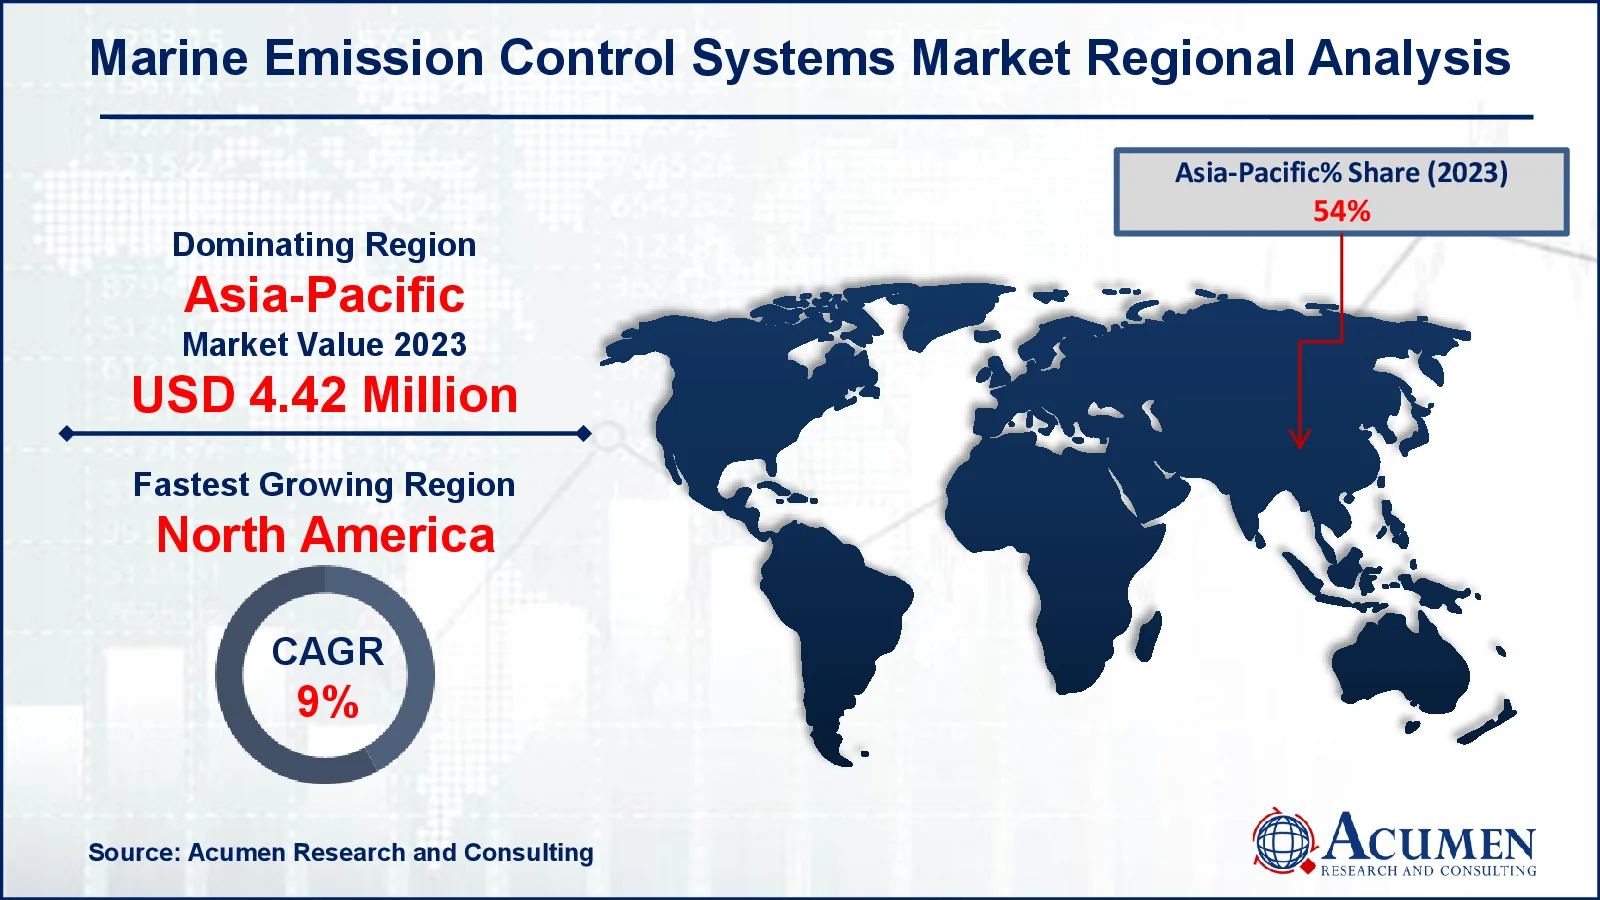
- Asia-Pacific marine emission control systems market value occupied around USD 4.42 billion in 2023
- North America marine emission control systems market growth will record a CAGR of more than 9% from 2024 to 2032
- Among technology, the scrubber sub-segment generated 47% of the market share in 2023
- Based on application, the commercial sub-segment generated 52% of market share in 2023

Growing emphasis on environmental sustainability is prompting investment in emission reduction technologies is the marine emission control systems market trend that fuels the industry demand
Marine emission control systems provide technological equipment that decreases ship emissions, increases fuel economy, and enables the use of cleaner fuels. Maritime pollution control systems use technology to meet environmental standards while also improving ship economic and operational efficiency. Because of rigorous pollution restrictions that hasten product improvements in the marine pollution system industry, the marine emission control systems market is predicted to grow rapidly.
Global Marine Emission Control Systems Market Dynamics
Market Drivers
- Stringent environmental regulations on marine emissions
- Growing awareness of marine pollution and its impact on health
- Increasing adoption of clean shipping technologies
Market Restraints
- High installation and operational costs
- Limited availability of low-sulfur fuel
- Technical challenges in retrofitting older vessels
Market Opportunities
- Innovation in hybrid and alternative fuel technologies
- Expansion in emerging markets with stricter emission norms
- Government incentives for green shipping initiatives
Marine Emission Control Systems Market Report Coverage
|
Market |
Marine Emission Control Systems Market |
|
Marine Emission Control Systems Market Size 2023 |
USD 8.2 Billion |
|
Marine Emission Control Systems Market Forecast 2032 |
USD 16.7 Billion |
|
Marine Emission Control Systems Market CAGR During 2024 - 2032 |
8.3% |
|
Marine Emission Control Systems Market Analysis Period |
2020 - 2032 |
|
Marine Emission Control Systems Market Base Year |
2023 |
|
Marine Emission Control Systems Market Forecast Data |
2024 - 2032 |
|
Segments Covered |
By Technology, By Fuel Type, By Application, and By Geography |
|
Regional Scope |
North America, Europe, Asia Pacific, Latin America, and Middle East & Africa |
|
Key Companies Profiled |
Johnson Matthey, Yara International, Alfa Laval, Tenneco, Shanghai Bluesoul, DuPont, Clean Marine, DEC Maritime, Mitsubishi, Wartsila, Damen Shipyards, Kwangsung, Ecospray Technologies, and others. |
|
Report Coverage |
Market Trends, Drivers, Restraints, Competitive Analysis, Player Profiling, Covid-19 Analysis, Regulation Analysis |
Marine Emission Control Systems Market Insights
Growing maritime emissions, advanced emission control technology, growing environmental and safety concerns, marine scrubber systems, and stricter public legislation are among the primary drivers of global marine emission control system development. The rapid growth of a global market for marine emission control systems is linked to increased maritime emissions and strict government regulation. Economic consequences for noncompliance with laws are expected to drive expansion in the global marine emission control systems business.
The development of maritime pollution control systems is projected to expedite the advancement of emission control technology. Reformation of existing ships to establish successful systems, as well as a healthy infrastructure and expansion in the construction industry, are all factors that contribute to global market development.
Furthermore, the global government seeks to reduce environmental damage by building a legislative framework that stimulates the use of various emissions-management technologies. This will present important organizations in the industrial emissions control system market with a variety of growth opportunities over the next few years.
The marketplace is currently facing issues in terms of greenhouse gas emissions from the marine emission management system. Pollution regulations protect all passenger and cargo ships, although their exhaust emissions have historically caused significant harm to the environment. With the stringency of regulatory regulations, companies are looking for ways to transport greener ships while ensuring a viable supply to the market.
Furthermore, new power plants are outfitted with equipment designed to last 10 to 15 years, and when older equipment is replaced, the energy generation sector has emerged as the primary industry. The market for industrial pollution control systems is predicted to grow considerably in the next years.
Marine Emission Control Systems Market Segmentation
The worldwide market for marine emission control systems is split based on technology, fuel type, application, and geography.
Marine Emission Control Systems Based on Technologies
- Scrubber
- Exhaust Gas Recirculation (EGR) Systems
- Selective Catalytic Reduction (SCR) Systems
- Others
According to the marine emission control systems industry analysis, scrubbers dominate the market because they are an effective solution for reducing sulfur emissions from ships, helping them comply with environmental regulations. These systems work by "scrubbing" harmful gases from exhaust before they are released into the atmosphere. Scrubbers are popular due to their cost-effectiveness and the ability to retrofit existing ships, making them a preferred choice for shipowners aiming to meet stringent emission standards.
Marine Emission Control Systems Based on Fuel Types
- Marine Diesel Oil
- Marine Gas Oil
- Hybrid
- Others
The marine gas oil fuel type is the largest fuel type category in the marine emission control systems market, because it is a cleaner-burning fuel with lower sulfur content compared to traditional heavy fuel oils. This makes it more compliant with international environmental regulations aimed at reducing air pollution from ships. Its widespread availability and ease of use also contribute to its dominance in the market, as it helps shipping companies meet strict emission standards while minimizing operational changes.
Marine Emission Control Systems Based on Applications
- Commercial
- Offshore
- Recreational
- Navy
- Others
According to the marine emission control systems market forecast, commercial application dominates the industry. This sector uses these systems to comply with strict environmental regulations that limit air pollution from ships. Commercial vessels, such as cargo ships and tankers, are the primary users because they operate in international waters where emission standards are enforced. As global trade grows, the demand for these systems increases, making commercial applications the dominant force in the market.
Marine Emission Control Systems Market Regional Outlook
North America
- U.S.
- Canada
Europe
- U.K.
- Germany
- France
- Spain
- Rest of Europe
Asia-Pacific
- India
- Japan
- China
- Australia
- South Korea
- Rest of Asia-Pacific
Latin America
- Brazil
- Mexico
- Rest of LATAM
The Middle East & Africa
- South Africa
- GCC Countries
- Rest of the Middle East & Africa (ME&A)

Marine Emission Control Systems Market Regional Analysis
For several reasons, Asia-Pacific is the largest contributor in the marine emission control systems market. Globalization has also caused numerous factories, particularly those in India and China, to relocate to low-cost countries from industrialized countries. In turn, government investment and economic development plans in the Asia-Pacific area are expected to boost the cement industry. For instance, according to the Ministry of Shipping, Government of India, maritime transport accounts for approximately 95% of India's commerce volume and 70% of its value. In contrast, the Asia-Pacific area has seen an increase in the development of coal-fired power plants due to a lack of renewable energy infrastructure. In addition to China and India, countries such as Indonesia and Thailand may raise demand in Asia-Pacific as power consumption rises.
North America's marine emission control systems market is expanding rapidly as a result of stronger environmental regulations and the use of cleaner technology in the shipping industry. Governments are enforcing regulations to minimize sulfur and nitrogen oxide emissions from ships, increasing demand for improved emission control systems. For instance, in 2023, the Government of Canada announced financing support for three energy modeling initiatives with prominent organizations throughout Canada to expand the evidence foundation for net-zero routes in Canada. Furthermore, increased marine activity and investments in cleaner fuel alternatives drive market growth in the region.
Marine Emission Control Systems Market Players
Some of the top marine emission control systems companies offered in our report include Johnson Matthey, Yara International, Alfa Laval, Tenneco, Shanghai Bluesoul, DuPont, Clean Marine, DEC Maritime, Mitsubishi, Wartsila, Damen Shipyards, Kwangsung, Ecospray Technologies, and others.
Frequently Asked Questions
How big is the marine emission control systems market?
The marine emission control systems market size was valued at USD 8.2 billion in 2023.
What is the CAGR of the global marine emission control systems market from 2024 to 2032?
The CAGR of marine emission control Systems is 8.3% during the analysis period of 2024 to 2032.
Which are the key players in the marine emission control systems market?
The key players operating in the global market are including Johnson Matthey, Yara International, Alfa Laval, Tenneco, Shanghai Bluesoul, DuPont, Clean Marine, DEC Maritime, Mitsubishi, Wartsila, Damen Shipyards, Kwangsung, Ecospray Technologies, and others.
Which region dominated the global marine emission control systems market share?
Asia-Pacific held the dominating position in marine emission control systems industry during the analysis period of 2024 to 2032.
Which region registered fastest CAGR from 2024 to 2032?
North America region exhibited fastest growing CAGR for market of marine emission control systems during the analysis period of 2024 to 2032.
What are the current trends and dynamics in the global marine emission control systems industry?
The current trends and dynamics in the marine emission control systems industry include stringent environmental regulations on marine emissions, growing awareness of marine pollution and its impact on health, and increasing adoption of clean shipping technologies.
Which technology held the maximum share in 2023?
The scrubber technology held the maximum share of the marine emission control systems industry.


